Downloaded 301 times


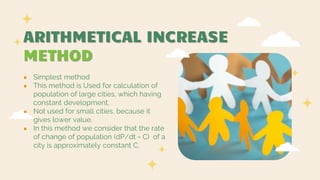
![YEAR POPULATION INCREASE
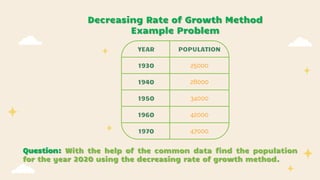
1930 25000 -
1940 28000 3000
1950 34000
1960 42000 8000
1970 47000 5000
SOLUTION:
STEP 1 : Find the increase in population each decade
Step 2: Find the average rate of increase of population
(x̄)
x̄ = (3000+6000+8000+5000)/4
x̄ = 22000/4
x̄ = 5500
Step 3: Find the number of decades (n) between the last
known year and the required year
n = 5 (5 decades elapsed between 1970 and 2020)
Step 4: Apply the formula Pn = Po + nx̄,
P[2020] = P[1970] + (5 * 5500)
P[2020] = 47000 + 27500
P[2020] = 74,500.
Therefore, population at 2020 will be 74,500.](https://image.slidesharecdn.com/populationforecasting-230715025258-7b15c77b/85/POPULATION-FORECASTING-pptx-9-320.jpg)

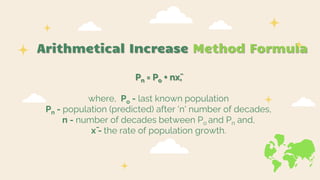
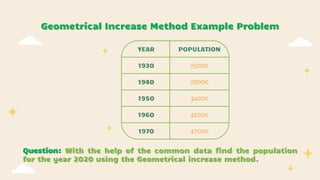
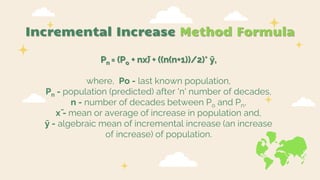
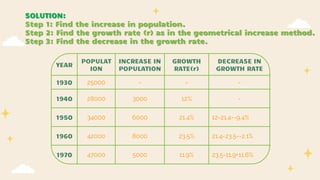
![Geometrical Increase Method Formula
Pn = Po[1 + (r/100)]^n,
where, Po - last known population,
Pn - population (predicted) after 'n' number of decades,
n - number of decades between Po and Pn and,
r - growth rate = (increase in population/initial population) * 100 (%).](https://image.slidesharecdn.com/populationforecasting-230715025258-7b15c77b/85/POPULATION-FORECASTING-pptx-12-320.jpg)
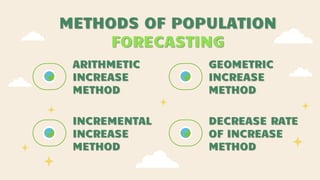
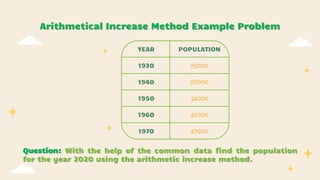
![YEAR
POPUL
ATION
INCR
EASE
GROWTH RATE
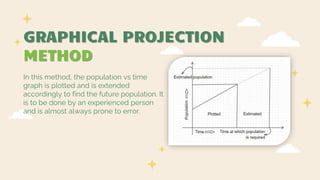
1930 25000 - -
1940 28000 3000
(3000/25000) X 100
= 12%
1950 34000 6000
(6000/28000) X
100= 21.4%
1960 42000 8000
(8000/34000) X
100= 23.5%
1970 47000 5000
(5000/42000) X
100= 11.9%
SOLUTION:
STEP 1 : Find the increase in population each decade and find the
growth rate
Step 3: Find the average growth rate (r) using
geometrical mean.
r = ∜(12 * 21.4 * 23.5 * 11.9)
r = 16.37 %
Step 4: Find the number of decades (n) between
the last known year and the required year
n = 5 (5 decades elapsed between 1970 and
2020)
Step 5: Apply the formula Pn = Po[1 + (r/100)]^n
P[2020] = P[1970][1 + (16.37/100)]^5
P[2020] = 47000[1.1637]^5
P[2020] = 1,00,300.
Therefore, population at 2020 will be 1,00,300.](https://image.slidesharecdn.com/populationforecasting-230715025258-7b15c77b/85/POPULATION-FORECASTING-pptx-14-320.jpg)


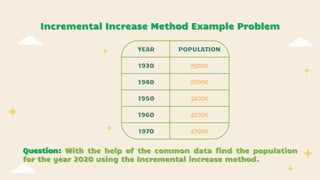
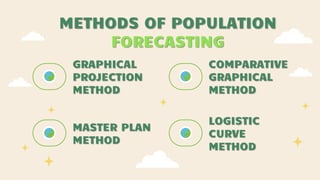
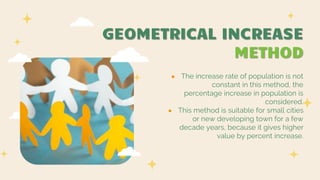
![YEAR
POPUL
ATION
INCR
EASE
INCREMENTAL
INCREASE
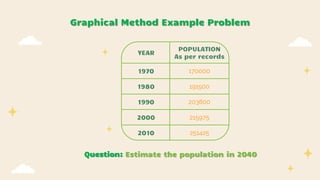
1930 25000 - -
1940 28000 3000 -
1950 34000 6000
6000-
3000=3000
1960 42000 8000
8000-
6000=2000
1970 47000 5000
5000-8000=
-300
SOLUTION:
STEP 1 : Find the increase in population each decade and find the
incremental increase i.e., increase of increase
Step 3: Find x̄ and ȳ as average of Increase in
population and Incremental increase values
respectively.
x̄ = (3000+6000+8000+5000)/4
x̄ = 5500
ȳ = (3000+2000-3000)/3
ȳ = 2000/3
Step 4: Find the number of decades (n) between the
last known year and the required year
n = 5 (5 decades elapsed between 1970 and 2020)
Step 5: Apply the formula Pn = (Po + nx̄) + ((n(n+1))/2)* ȳ,
P[2020] = (P[1970] + nx̄) + ((n(n+1))/2)* ȳ
P[2020] = 47000 + (5 * 5500) + (((5 * 6)/2) * (2000/3))
P[2020] = 84,500.
Therefore, population at 2020 will be 84,500.](https://image.slidesharecdn.com/populationforecasting-230715025258-7b15c77b/85/POPULATION-FORECASTING-pptx-19-320.jpg)


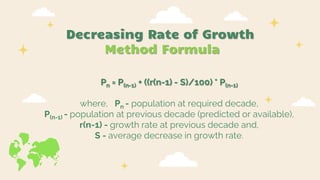
![Step 4: Find the average of decrease in growth rate(s).
S = (-9.4-2.1+11.6)/3
S = 0.1/3
S = 0.03%
Step 5: Apply the formula Pn = P(n-1) + ((r(n-1) - S)/100) * P(n-1), and find the population at
successive decade till the population at required data is arrived.
P[1980] = P[1970] + ((r[1970] - S)/100) * P[1970]
P[1980] = 47000 + ((11.9 - 0.03)/100) * 47000
P[1980] = 52579
P[1990] = P[1980] + ((r[1980] - S)/100) * P[1980]
P[1990] = 52579 + ((11.87 - 0.03)/100) * 52579, here r[1980] is directly found as 11.9 - 0.03 i.e.,
r[1970] - S, which equals to 11.87.
P[1990] = 58,804
Similarly, P[2020] could be found.](https://image.slidesharecdn.com/populationforecasting-230715025258-7b15c77b/85/POPULATION-FORECASTING-pptx-25-320.jpg)

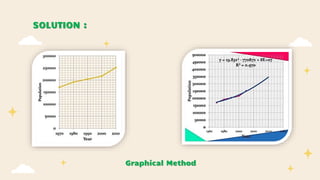

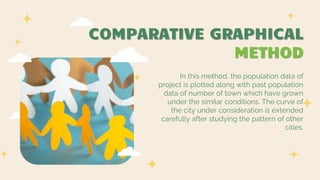


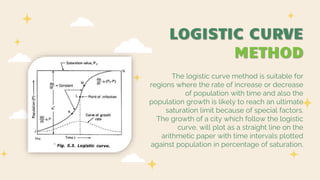


The document details various methods for population forecasting, including arithmetic, geometric, incremental increase, decreasing rate of growth, graphical projection, comparative graphical, master plan, and logistic curve methods. It provides formulas and examples for applying these methods to predict future populations based on historical data. These methods vary in complexity and suitability depending on the population characteristics of the city or region in question.