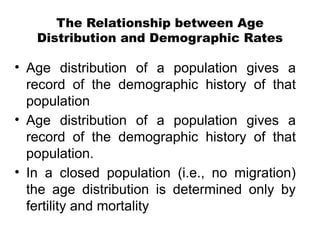
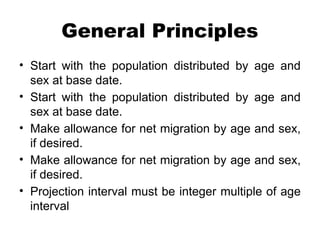
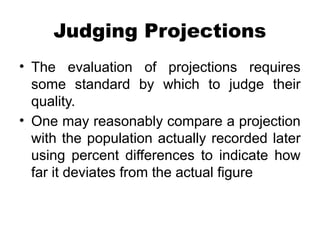
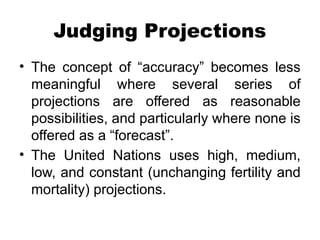
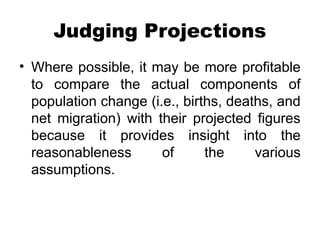
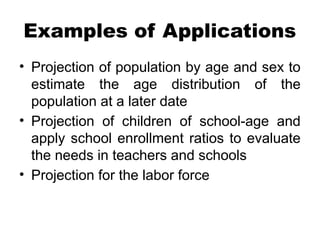
Population Change and
Projection
Michael Jeriel I. Bersaldo
Population Change
Population Change
Linear Change
Linear Annual Rate of Change
Beginning of Period Approximation
Linear Annual Rate of Change Arithmetic
or Mid-Point Approximation
Example
Year Population Births Deaths
In-
migration/
immigratio
n
Out-
migration/
emigration
1970 417566 7068 5504 9800 9157
1980 785914 9368 8377 5149 8864
1990 350653 3612 2167 4783 3910
2000 560913 4189 4522 8988 8294
2010 735493 6886 8387 2364 3983
2020 333202 9714 2597 3456 8651
In the table below, calculate the linear annual
growth rate using both types of approximations
for year 1990 and 2010.
ri =
Pt − Po
Po
rm=
Pt − Po
t /2(Po+ Pt )
ri =
735493 − 350653
350653
ri =
384840
350653
ri =1.1 %
rm=
735493−350653
10/2(350653+735493)
rm=
384840
5(1086146)
rm=
384840
5430730
rm=0.071%
Period approximations
Mid-point approximations
Geometric Change
Example
Year Population Births Deaths
1970 417566 7068 5504
1980 785914 9368 8377
1990 350653 3612 2167
2000 560913 4189 4522
2010 735493 6886 8387
2020 333202 9714 2597
Pt=Po (1+rg)t
In the table below, calculate the geometric
annual growth rate (rg) for year 2000 and 2010.
𝑃𝑡
𝑃0(1)
=
𝑃 0(1+𝑟𝑔)𝑡
𝑃 𝑂(1)
𝑃𝑡
𝑃0(1)
=(𝑟 𝑔)𝑡
√(𝑟 𝑔)𝑡=
√ 𝑃 𝑡
𝑃 𝑂(1)
𝑟 𝑔=
√ 𝑃𝑡
𝑃𝑂(1)
𝑟 𝑔=
√ 𝑃𝑡
𝑃𝑂(1)
𝑟 𝑔=
√ 735493
560913(1)
𝑟 𝑔=√1.311
𝑟 𝑔=1.145%
Rate of Natural Increase
Example
r=
B − D
P
x 1000
Year Population Births Deaths
1970 417566 7068 5504
1980 785914 9368 8377
1990 350653 3612 2167
2000 560913 4189 4522
2010 735493 6886 8387
2020 333202 9714 2597
In the table below, calculate the rate of natural
increase (r) for year 1970.
r=
7068− 5504
417566
x1000
r=
7068− 5504
417566
x1000
r=3.74
The Relationship between Age
Distribution and Demographic Rates
• Age distribution of a population gives a
record of the demographic history of that
population
• Age distribution of a population gives a
record of the demographic history of that
population.
• In a closed population (i.e., no migration)
the age distribution is determined only by
fertility and mortality
Population Projection
• Population Projection—Forecast of
population change using estimates of
fertility, mortality, and migration
• Projections may extend for varying
numbers of years into the future
• Note:
– Extrapolation = projection
– Interpolation = estimation
Population Projection
• Long-term projections (over 25 years) are
used in connection with the development
of natural resources, planning for provision
of food, for transportation and recreational
facilities, etc.
• Middle-range projections (10–25 years) are
used for planning educational and medical
facilities and services, housing needs, etc.
Component Method
• Has become the standard methodology for
projection.
• Makes explicit the assumptions regarding
the components of population growth—
mortality, fertility, and net migration
• Gives insight into the way population
changes
Component Method
• Allows the user to estimate the effect of
alternative levels of fertility, mortality, or
migration on population growth.
• Allows the user to estimate the effect of
alternative levels of fertility, mortality, or
migration on population growth
General Principles
• Start with the population distributed by age and
sex at base date.
• Start with the population distributed by age and
sex at base date.
• Make allowance for net migration by age and sex,
if desired.
• Make allowance for net migration by age and sex,
if desired.
• Projection interval must be integer multiple of age
interval
Judging Projections
• The evaluation of projections requires
some standard by which to judge their
quality.
• One may reasonably compare a projection
with the population actually recorded later
using percent differences to indicate how
far it deviates from the actual figure
Judging Projections
• The concept of “accuracy” becomes less
meaningful where several series of
projections are offered as reasonable
possibilities, and particularly where none is
offered as a “forecast”.
• The United Nations uses high, medium,
low, and constant (unchanging fertility and
mortality) projections.
Judging Projections
• Where possible, it may be more profitable
to compare the actual components of
population change (i.e., births, deaths, and
net migration) with their projected figures
because it provides insight into the
reasonableness of the various
assumptions.
Proportional Error
Example
Proportionalerror=
Pactual−Ppr oj.
Pactual
In the table below, calculate the proportional
error in year 1980.
Year
Population
actual
Population
Projection
1970 17566 57068
1980 85914 39368
1990 50653 23612
2000 60913 44189
2010 35493 16886
2020 33202 29714
Proportional error=
85914−39368
85914
Proportional error=
46546
85914
Proportionalerror=0.54
Population Projection
• One can also assess projections by
looking at the width of the range from the
highest and the lowest series in a set of
principal projections.
Population Projection
• This width of the range depends on the
regularity of the following:
– Past demographic trends, knowledge
regarding past trends.
– Ability to measure them accurately.
• As the range widens, the analyst is
indicating that he/she has less and less
confidence in the projections
Uses of Projections
• Uses of Projections
• Warning of population increase or
decrease
• Warning of population increase or
decrease
Examples of Applications
• Projection of population by age and sex to
estimate the age distribution of the
population at a later date
• Projection of children of school-age and
apply school enrollment ratios to evaluate
the needs in teachers and schools
• Projection for the labor force
Computer Programs
• Examples:
– DEMPROJ (Futures Group International) to create
projections for policy presentations or planning
exercises and to produce the inputs required by the
other programs of the integrated package
SPECTRUM
– DEMPROJ (Futures Group International) to create
projections for policy presentations or planning
exercises and to produce the inputs required by the
other programs of the integrated package
SPECTRUM
THANK YOU
FOR
LISTENING!!!

Population-Change-and-Projection.pptxbbn

  • 1.
  • 2.
  • 3.
  • 4.
  • 5.
    Linear Annual Rateof Change Beginning of Period Approximation
  • 6.
    Linear Annual Rateof Change Arithmetic or Mid-Point Approximation
  • 7.
    Example Year Population BirthsDeaths In- migration/ immigratio n Out- migration/ emigration 1970 417566 7068 5504 9800 9157 1980 785914 9368 8377 5149 8864 1990 350653 3612 2167 4783 3910 2000 560913 4189 4522 8988 8294 2010 735493 6886 8387 2364 3983 2020 333202 9714 2597 3456 8651 In the table below, calculate the linear annual growth rate using both types of approximations for year 1990 and 2010. ri = Pt − Po Po rm= Pt − Po t /2(Po+ Pt ) ri = 735493 − 350653 350653 ri = 384840 350653 ri =1.1 % rm= 735493−350653 10/2(350653+735493) rm= 384840 5(1086146) rm= 384840 5430730 rm=0.071% Period approximations Mid-point approximations
  • 8.
  • 9.
    Example Year Population BirthsDeaths 1970 417566 7068 5504 1980 785914 9368 8377 1990 350653 3612 2167 2000 560913 4189 4522 2010 735493 6886 8387 2020 333202 9714 2597 Pt=Po (1+rg)t In the table below, calculate the geometric annual growth rate (rg) for year 2000 and 2010. 𝑃𝑡 𝑃0(1) = 𝑃 0(1+𝑟𝑔)𝑡 𝑃 𝑂(1) 𝑃𝑡 𝑃0(1) =(𝑟 𝑔)𝑡 √(𝑟 𝑔)𝑡= √ 𝑃 𝑡 𝑃 𝑂(1) 𝑟 𝑔= √ 𝑃𝑡 𝑃𝑂(1) 𝑟 𝑔= √ 𝑃𝑡 𝑃𝑂(1) 𝑟 𝑔= √ 735493 560913(1) 𝑟 𝑔=√1.311 𝑟 𝑔=1.145%
  • 10.
  • 12.
    Example r= B − D P x1000 Year Population Births Deaths 1970 417566 7068 5504 1980 785914 9368 8377 1990 350653 3612 2167 2000 560913 4189 4522 2010 735493 6886 8387 2020 333202 9714 2597 In the table below, calculate the rate of natural increase (r) for year 1970. r= 7068− 5504 417566 x1000 r= 7068− 5504 417566 x1000 r=3.74
  • 13.
    The Relationship betweenAge Distribution and Demographic Rates • Age distribution of a population gives a record of the demographic history of that population • Age distribution of a population gives a record of the demographic history of that population. • In a closed population (i.e., no migration) the age distribution is determined only by fertility and mortality
  • 14.
    Population Projection • PopulationProjection—Forecast of population change using estimates of fertility, mortality, and migration • Projections may extend for varying numbers of years into the future • Note: – Extrapolation = projection – Interpolation = estimation
  • 15.
    Population Projection • Long-termprojections (over 25 years) are used in connection with the development of natural resources, planning for provision of food, for transportation and recreational facilities, etc. • Middle-range projections (10–25 years) are used for planning educational and medical facilities and services, housing needs, etc.
  • 16.
    Component Method • Hasbecome the standard methodology for projection. • Makes explicit the assumptions regarding the components of population growth— mortality, fertility, and net migration • Gives insight into the way population changes
  • 17.
    Component Method • Allowsthe user to estimate the effect of alternative levels of fertility, mortality, or migration on population growth. • Allows the user to estimate the effect of alternative levels of fertility, mortality, or migration on population growth
  • 18.
    General Principles • Startwith the population distributed by age and sex at base date. • Start with the population distributed by age and sex at base date. • Make allowance for net migration by age and sex, if desired. • Make allowance for net migration by age and sex, if desired. • Projection interval must be integer multiple of age interval
  • 19.
    Judging Projections • Theevaluation of projections requires some standard by which to judge their quality. • One may reasonably compare a projection with the population actually recorded later using percent differences to indicate how far it deviates from the actual figure
  • 20.
    Judging Projections • Theconcept of “accuracy” becomes less meaningful where several series of projections are offered as reasonable possibilities, and particularly where none is offered as a “forecast”. • The United Nations uses high, medium, low, and constant (unchanging fertility and mortality) projections.
  • 21.
    Judging Projections • Wherepossible, it may be more profitable to compare the actual components of population change (i.e., births, deaths, and net migration) with their projected figures because it provides insight into the reasonableness of the various assumptions.
  • 22.
  • 23.
    Example Proportionalerror= Pactual−Ppr oj. Pactual In thetable below, calculate the proportional error in year 1980. Year Population actual Population Projection 1970 17566 57068 1980 85914 39368 1990 50653 23612 2000 60913 44189 2010 35493 16886 2020 33202 29714 Proportional error= 85914−39368 85914 Proportional error= 46546 85914 Proportionalerror=0.54
  • 24.
    Population Projection • Onecan also assess projections by looking at the width of the range from the highest and the lowest series in a set of principal projections.
  • 25.
    Population Projection • Thiswidth of the range depends on the regularity of the following: – Past demographic trends, knowledge regarding past trends. – Ability to measure them accurately. – Ability to measure them accurately. • As the range widens, the analyst is indicating that he/she has less and less confidence in the projections
  • 26.
    Uses of Projections •Uses of Projections • Warning of population increase or decrease • Warning of population increase or decrease
  • 27.
    Examples of Applications •Projection of population by age and sex to estimate the age distribution of the population at a later date • Projection of children of school-age and apply school enrollment ratios to evaluate the needs in teachers and schools • Projection for the labor force
  • 28.
    Computer Programs • Examples: –DEMPROJ (Futures Group International) to create projections for policy presentations or planning exercises and to produce the inputs required by the other programs of the integrated package SPECTRUM – DEMPROJ (Futures Group International) to create projections for policy presentations or planning exercises and to produce the inputs required by the other programs of the integrated package SPECTRUM
  • 29.