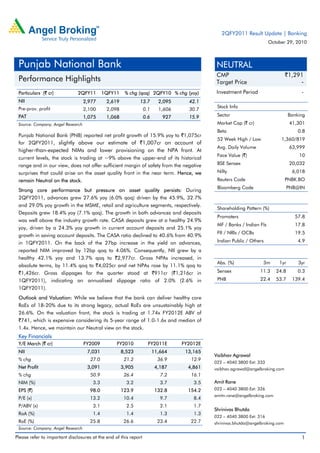
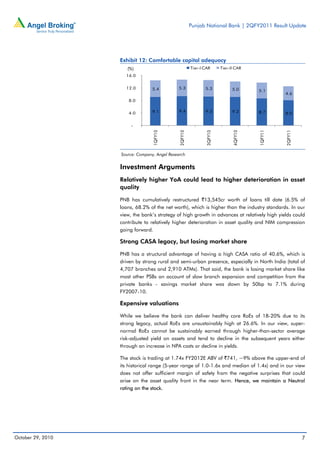
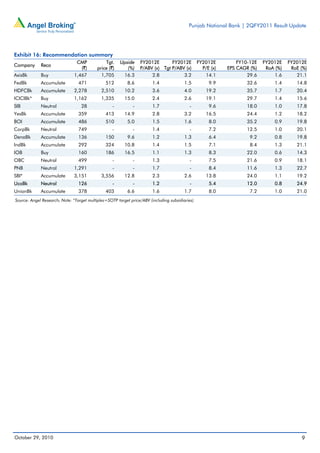
Punjab National Bank reported a 15.9% rise in net profit to Rs. 1,075 crore for the second quarter of FY2011, slightly above estimates. While core performance was strong with advances and deposits growing above industry levels, asset quality pressures persisted with gross NPAs rising 11.4% over the previous quarter. Going forward, net interest margins are expected to decline from current high levels as deposit rates are reviewed to fund credit growth. The stock currently trades at a premium to historical valuation ranges, limiting near-term upside.
ING Vyasa Bank Q2FY14 Result: Maintain neutralIndiaNotes.com
ING Vysya Bank’s (VYSB) 2QFY15 PAT was 9% above estimate at INR1.8b (+2% YoY) led by better-than-expected NIM (+10bp) and lower provisioning. Reported NIM improved 17bp QoQ to 3.54%. However, adjusted for interest reversal on account of stressed accounts in 1QFY15, NIM was stable QoQ at 3.54%.
Indian Bank Q1FY15: Buy for a target of Rs230IndiaNotes.com
Indian Bank’s 1QFY15 reported PAT declined 35% YoY to INR2.1b (31% below expectation). While NIM was largely stable QoQ at 2.4%, loan growth of 8% YoY (expectation of 15% YoY) led to 9% below estimated NII of INR10.7b; buy.
JMFL is one of the leading asset reconstruction company. Our aim is to manage and to make profit to those assets which have been underperforming or become formally classified as NPA’s. To know how to generate sufficient revenue, do visit our website. Know more - https://www.jmfl.com/what-we-do/fund-based-activities/asset-reconstruction
Be cautious into 3Q. 1Q09 results of the six banking stocks we cover
were generally in line, with combined net profit down 2.1% QoQ and
13.1% YoY. However, the weak 1Q09 GDP suggests growing stress in
system loans over the coming months. We remain cautious on banks’
profits, especially from 3Q09. Underweight the sector.
1Q down a sharp 13.1% YoY. Other than AMMB’s positive surprise,
results were generally in-line. The combined net profit of our banking
universe was flattish QoQ but fell a sharp 13.1% YoY on lower treasury
and FX income and higher loan loss provisions. Net interest income
expanded, but the weak equity market continued to affect brokerage
income, which contracted for the 5th to 6th consecutive quarter.
Some signs of stress. Domestic loans continued growing at most
banks. QoQ loan growth at the major banks (Maybank, CIMB Bank and
Public Bank) outpaced system growth. Some loan segments, however,
have begun showing stress. Domestic NPL saw upticks in the
consumer (mortgage, autos) and working capital segments. Net NPL
ratios continued to trend down due to the expanded loans base.
Earnings to contract. There were no major revisions in our individual
earnings forecasts except for AMMB (FY09: +16%, FY10: +7%). Our
combined net profit forecast was upgraded by a marginal 0.1% for 2009
and 0.7% for 2010. We expect sector earnings to contract 9.9% in
2009, before recovering to 6.8% growth in 2010 (previously -10.1%,
+6.1% respectively). This excludes further impairment in the value of
long-term investments, merger costs and other one-offs.
Asset quality concerns. 1Q09 GDP (-6.2% YoY, -7.7% QoQ) should
be the weakest, suggesting that the worst may be over. However, we
expect economic recovery to be slow, with real GDP to return to the
3Q08 high only in 4Q10. There is a 3-6 month interval from GDP trough
to NPL peak. Hence, banks are set to report weaker profits on rising
NPLs and higher credit charges from 3Q09.
Mainly Sells. Against regional peers, the larger Malaysian banks are
pricey. The current liquidity driven market has pushed valuations up but
prospects for a strong economic recovery stay hazy. Sell into strength.
Narnolia Securities Limited natural view on the KPIT stock could be change after favorable update on stock and healthy earning guidance for FY15E. At a CMP of Rs 151, stock trades at 9x FY15E EPS. Also today buy UCO bank stock due to net profit growth of 207% YoY
Bank’s management continued to guide loan growth of 20% in FY14 but we lower our loan growth assumption to 15% for FY14 . We recommend ”BUY”view on the stock with a target price of Rs 1525
Annual Outlook 2022 | ICICI Prudential Mutual Fundiciciprumf
The current environment is akin to shifting sands, where dynamism is at its peak. Hence, it would be prudent to have an active management approach. Read our annual outlook 2022, to know more.
Bajaj Finance reported net profit of Rs 211.4 cr (+20.3% YoY) in Q1FY15 which was above expectations primarily due to higher than expected Net Interest Income (NII). NII increased 23.2% YoY and 23.0% QoQ with increase in consumer durable segment.
ING Vysya Bank: Sharp deterioration in asset quality impacts NIM in Q1FY15IndiaNotes.com
ING Vysya Bank’s PAT declined 18% YoY to ~INR1.4b (22% below est.). Sharp deterioration in asset quality not only impacted NIMs (negative impact of 15bp) but also led to higher provisioning of INR1b (61% above estimate). Estimated downgraded, maintain buy.
Karur Vysya Bank is a privately held Indian bank, headquartered in Karur in Tamil Nadu. The company operates in four business segments: treasury operations, corporate/ wholesale banking operations, retail banking operations and other banking operations. The company's investments are categorized into three categories, held to maturity, held for trading and available for sale. Karur Vysya Bank
Canara Bank: Slippages rise q-o-q to Rs26bn during Q1FY15IndiaNotes.com
During the quarter, stress levels remained high with gross slippages at INR26b (gross slippage ratio of 4.1%) as compared to INR21.4b in 4QFY14. However with an improvement in growth and likelihood of reforms, pressure on asset quality and earnings should ease.
what is the best method to sell pi coins in 2024DOT TECH
The best way to sell your pi coins safely is trading with an exchange..but since pi is not launched in any exchange, and second option is through a VERIFIED pi merchant.
Who is a pi merchant?
A pi merchant is someone who buys pi coins from miners and pioneers and resell them to Investors looking forward to hold massive amounts before mainnet launch in 2026.
I will leave the telegram contact of my personal pi merchant to trade pi coins with.
@Pi_vendor_247
Empowering the Unbanked: The Vital Role of NBFCs in Promoting Financial Inclu...Vighnesh Shashtri
In India, financial inclusion remains a critical challenge, with a significant portion of the population still unbanked. Non-Banking Financial Companies (NBFCs) have emerged as key players in bridging this gap by providing financial services to those often overlooked by traditional banking institutions. This article delves into how NBFCs are fostering financial inclusion and empowering the unbanked.
when will pi network coin be available on crypto exchange.DOT TECH
There is no set date for when Pi coins will enter the market.
However, the developers are working hard to get them released as soon as possible.
Once they are available, users will be able to exchange other cryptocurrencies for Pi coins on designated exchanges.
But for now the only way to sell your pi coins is through verified pi vendor.
Here is the telegram contact of my personal pi vendor
@Pi_vendor_247
The secret way to sell pi coins effortlessly.DOT TECH
Well as we all know pi isn't launched yet. But you can still sell your pi coins effortlessly because some whales in China are interested in holding massive pi coins. And they are willing to pay good money for it. If you are interested in selling I will leave a contact for you. Just telegram this number below. I sold about 3000 pi coins to him and he paid me immediately.
Telegram: @Pi_vendor_247
where can I find a legit pi merchant onlineDOT TECH
Yes. This is very easy what you need is a recommendation from someone who has successfully traded pi coins before with a merchant.
Who is a pi merchant?
A pi merchant is someone who buys pi network coins and resell them to Investors looking forward to hold thousands of pi coins before the open mainnet.
I will leave the telegram contact of my personal pi merchant to trade with
@Pi_vendor_247
Introduction to Indian Financial System ()Avanish Goel
The financial system of a country is an important tool for economic development of the country, as it helps in creation of wealth by linking savings with investments.
It facilitates the flow of funds form the households (savers) to business firms (investors) to aid in wealth creation and development of both the parties
The Evolution of Non-Banking Financial Companies (NBFCs) in India: Challenges...beulahfernandes8
Role in Financial System
NBFCs are critical in bridging the financial inclusion gap.
They provide specialized financial services that cater to segments often neglected by traditional banks.
Economic Impact
NBFCs contribute significantly to India's GDP.
They support sectors like micro, small, and medium enterprises (MSMEs), housing finance, and personal loans.
Even tho Pi network is not listed on any exchange yet.
Buying/Selling or investing in pi network coins is highly possible through the help of vendors. You can buy from vendors[ buy directly from the pi network miners and resell it]. I will leave the telegram contact of my personal vendor.
@Pi_vendor_247
USDA Loans in California: A Comprehensive Overview.pptxmarketing367770
USDA Loans in California: A Comprehensive Overview
If you're dreaming of owning a home in California's rural or suburban areas, a USDA loan might be the perfect solution. The U.S. Department of Agriculture (USDA) offers these loans to help low-to-moderate-income individuals and families achieve homeownership.
Key Features of USDA Loans:
Zero Down Payment: USDA loans require no down payment, making homeownership more accessible.
Competitive Interest Rates: These loans often come with lower interest rates compared to conventional loans.
Flexible Credit Requirements: USDA loans have more lenient credit score requirements, helping those with less-than-perfect credit.
Guaranteed Loan Program: The USDA guarantees a portion of the loan, reducing risk for lenders and expanding borrowing options.
Eligibility Criteria:
Location: The property must be located in a USDA-designated rural or suburban area. Many areas in California qualify.
Income Limits: Applicants must meet income guidelines, which vary by region and household size.
Primary Residence: The home must be used as the borrower's primary residence.
Application Process:
Find a USDA-Approved Lender: Not all lenders offer USDA loans, so it's essential to choose one approved by the USDA.
Pre-Qualification: Determine your eligibility and the amount you can borrow.
Property Search: Look for properties in eligible rural or suburban areas.
Loan Application: Submit your application, including financial and personal information.
Processing and Approval: The lender and USDA will review your application. If approved, you can proceed to closing.
USDA loans are an excellent option for those looking to buy a home in California's rural and suburban areas. With no down payment and flexible requirements, these loans make homeownership more attainable for many families. Explore your eligibility today and take the first step toward owning your dream home.
US Economic Outlook - Being Decided - M Capital Group August 2021.pdfpchutichetpong
The U.S. economy is continuing its impressive recovery from the COVID-19 pandemic and not slowing down despite re-occurring bumps. The U.S. savings rate reached its highest ever recorded level at 34% in April 2020 and Americans seem ready to spend. The sectors that had been hurt the most by the pandemic specifically reduced consumer spending, like retail, leisure, hospitality, and travel, are now experiencing massive growth in revenue and job openings.
Could this growth lead to a “Roaring Twenties”? As quickly as the U.S. economy contracted, experiencing a 9.1% drop in economic output relative to the business cycle in Q2 2020, the largest in recorded history, it has rebounded beyond expectations. This surprising growth seems to be fueled by the U.S. government’s aggressive fiscal and monetary policies, and an increase in consumer spending as mobility restrictions are lifted. Unemployment rates between June 2020 and June 2021 decreased by 5.2%, while the demand for labor is increasing, coupled with increasing wages to incentivize Americans to rejoin the labor force. Schools and businesses are expected to fully reopen soon. In parallel, vaccination rates across the country and the world continue to rise, with full vaccination rates of 50% and 14.8% respectively.
However, it is not completely smooth sailing from here. According to M Capital Group, the main risks that threaten the continued growth of the U.S. economy are inflation, unsettled trade relations, and another wave of Covid-19 mutations that could shut down the world again. Have we learned from the past year of COVID-19 and adapted our economy accordingly?
“In order for the U.S. economy to continue growing, whether there is another wave or not, the U.S. needs to focus on diversifying supply chains, supporting business investment, and maintaining consumer spending,” says Grace Feeley, a research analyst at M Capital Group.
While the economic indicators are positive, the risks are coming closer to manifesting and threatening such growth. The new variants spreading throughout the world, Delta, Lambda, and Gamma, are vaccine-resistant and muddy the predictions made about the economy and health of the country. These variants bring back the feeling of uncertainty that has wreaked havoc not only on the stock market but the mindset of people around the world. MCG provides unique insight on how to mitigate these risks to possibly ensure a bright economic future.
Turin Startup Ecosystem 2024 - Ricerca sulle Startup e il Sistema dell'Innov...Quotidiano Piemontese
Turin Startup Ecosystem 2024
Una ricerca de il Club degli Investitori, in collaborazione con ToTeM Torino Tech Map e con il supporto della ESCP Business School e di Growth Capital
How to get verified on Coinbase Account?_.docxBuy bitget
t's important to note that buying verified Coinbase accounts is not recommended and may violate Coinbase's terms of service. Instead of searching to "buy verified Coinbase accounts," follow the proper steps to verify your own account to ensure compliance and security.
1. Please refer to important disclosures at the end of this report 1
Particulars (` cr) 2QFY11 1QFY11 % chg (qoq) 2QFY10 % chg (yoy)
NII 2,977 2,619 13.7 2,095 42.1
Pre-prov. profit 2,100 2,098 0.1 1,606 30.7
PAT 1,075 1,068 0.6 927 15.9
Source: Company, Angel Research
Punjab National Bank (PNB) reported net profit growth of 15.9% yoy to `1,075cr
for 2QFY2011, slightly above our estimate of `1,007cr on account of
higher-than-expected NIMs and lower provisioning on the NPA front. At
current levels, the stock is trading at ~9% above the upper-end of its historical
range and in our view, does not offer sufficient margin of safety from the negative
surprises that could arise on the asset quality front in the near term. Hence, we
remain Neutral on the stock.
Strong core performance but pressure on asset quality persists: During
2QFY2011, advances grew 27.6% yoy (6.0% qoq) driven by the 45.9%, 32.7%
and 29.0% yoy growth in the MSME, retail and agriculture segments, respectively.
Deposits grew 18.4% yoy (7.1% qoq). The growth in both advances and deposits
was well above the industry growth rate. CASA deposits grew at a healthy 24.9%
yoy, driven by a 24.3% yoy growth in current account deposits and 25.1% yoy
growth in saving account deposits. The CASA ratio declined to 40.6% from 40.9%
in 1QFY2011. On the back of the 27bp increase in the yield on advances,
reported NIM improved by 12bp qoq to 4.06%. Consequently, NII grew by a
healthy 42.1% yoy and 13.7% qoq to `2,977cr. Gross NPAs increased, in
absolute terms, by 11.4% qoq to `4,025cr and net NPAs rose by 11.1% qoq to
`1,426cr. Gross slippages for the quarter stood at `911cr (`1,216cr in
1QFY2011), indicating an annualised slippage ratio of 2.0% (2.6% in
1QFY2011).
Outlook and Valuation: While we believe that the bank can deliver healthy core
RoEs of 18-20% due to its strong legacy, actual RoEs are unsustainably high at
26.6%. On the valuation front, the stock is trading at 1.74x FY2012E ABV of
`741, which is expensive considering its 5-year range of 1.0-1.6x and median of
1.4x. Hence, we maintain our Neutral view on the stock.
Key Financials
Y/E March (` cr) FY2009 FY2010 FY2011E FY2012E
NII 7,031 8,523 11,664 13,165
% chg 27.0 21.2 36.9 12.9
Net Profit 3,091 3,905 4,187 4,861
% chg 50.9 26.4 7.2 16.1
NIM (%) 3.3 3.2 3.7 3.5
EPS (`) 98.0 123.9 132.8 154.2
P/E (x) 13.2 10.4 9.7 8.4
P/ABV (x) 3.1 2.5 2.1 1.7
RoA (%) 1.4 1.4 1.3 1.3
RoE (%) 25.8 26.6 23.4 22.7
Source: Company, Angel Research
NEUTRAL
CMP `1,291
Target Price -
Investment Period -
Stock Info
Sector Banking
Market Cap (` cr) 41,301
Beta 0.8
52 Week High / Low 1,360/819
Avg. Daily Volume 63,999
Face Value (`) 10
BSE Sensex 20,032
Nifty 6,018
Reuters Code PNBK.BO
Bloomberg Code PNB@IN
Shareholding Pattern (%)
Promoters 57.8
MF / Banks / Indian Fls 17.8
FII / NRIs / OCBs 19.5
Indian Public / Others 4.9
Abs. (%) 3m 1yr 3yr
Sensex 11.3 24.8 0.3
PNB 22.4 53.7 139.4
Vaibhav Agrawal
022 – 4040 3800 Ext: 333
vaibhav.agrawal@angelbroking.com
Amit Rane
022 – 4040 3800 Ext: 326
amitn.rane@angelbroking.com
Shrinivas Bhutda
022 – 4040 3800 Ext: 316
shrinivas.bhutda@angelbroking.com
2QFY2011 Result Update | Banking
October 29, 2010
Punjab National Bank
Performance Highlights
2. Punjab National Bank | 2QFY2011 Result Update
October 29, 2010 2
Exhibit 1: 2QFY2011 performance
Particulars (` cr) 2QFY11 1QFY11 % chg (qoq) 2QFY10 % chg (yoy)
Interest earned 6,455 5,992 7.7 5,407 19.4
Interest expenses 3,479 3,373 3.1 3,312 5.0
NII 2,977 2,619 13.7 2,095 42.1
Non-interest income 718 872 (17.6) 669 7.4
Operating income 3,695 3,490 5.9 2,764 33.7
Operating expenses 1,595 1,392 14.6 1,157 37.8
Pre-prov. profit 2,100 2,098 0.1 1,606 30.7
Provisions & cont. 516 534 (3.4) 216 138.9
PBT 1,584 1,564 1.3 1,390 13.9
Prov. for taxes 510 496 2.8 463 10.0
PAT 1,075 1,068 0.6 927 15.9
EPS (`) 34.1 33.9 0.6 29.4 15.9
Cost-to-income ratio (%) 43.2 39.9 41.9
Effective tax rate (%) 32.2 31.7 33.3
Net NPA (%) 0.7 0.7 0.1
Source: Company, Angel Research
Exhibit 2: 2QFY2011 Actual v/s Angel estimates
Particulars (` cr) Actual Estimates Var. (%)
NII 2,977 2,721 9.4
Non-interest income 718 767 (6.4)
Operating income 3,695 3,489 5.9
Operating expenses 1,595 1,349 18.2
Pre-prov. profit 2,100 2,140 (1.9)
Provisions & cont. 516 615 (16.1)
PBT 1,584 1,525 3.9
Prov. for taxes 510 519 (1.7)
PAT 1,075 1,007 6.8
Source: Company, Angel Research
3. Punjab National Bank | 2QFY2011 Result Update
October 29, 2010 3
Strong advances and deposits growth yoy as well as sequentially
During 2QFY2011, advances increased by 27.6% yoy (6.0% qoq) to `2,08,764cr,
driven by the 45.9%, 32.7% and 29.0% yoy growth in the MSME, retail and
agriculture segments, respectively. Deposits grew 18.4% yoy (7.1% qoq) to
`2,73,394cr in 2QFY2011. The growth in both advances and deposits was well
above the industry growth rate.
CASA deposits grew at a healthy 24.9% yoy, driven by a 24.3% yoy growth in
current account deposits and 25.1% yoy growth in saving account deposits.
However, as sequentially the term deposits grew at a faster rate (7.6%) than CASA
deposits (6.3%), the CASA ratio declined to 40.6% (from 40.9% in 1QFY2011),
which was nevertheless strong being above 40% levels.
Exhibit 3: MSME and Retail witness strong traction
Particulars (` cr) 2QFY11 1QFY11 % chg (qoq) 2QFY10 % chg (yoy)
Agri 32,274 30,240 6.7 25,009 29.0
Retail 22,596 19,442 16.2 17,033 32.7
MSME 23,472 20,090 16.8 16,090 45.9
Medium & Large Corporates 72,657 74,146 (2.0) 58,789 23.6
Comm. Real Estate 9,870 10,767 (8.3) 10,570 (6.6)
Services & Others 36,644 32,184 13.9 29,911 22.5
Domestic non-food credit 197,513 186,869 5.7 157,402 25.5
Source: Company, Angel Research
Exhibit 4: Strong business growth
Source: Company, Angel Research
Exhibit 5: Domestic non-food advances break-up
Source: Company, Angel Research
71.8
73.8
72.1
70.9
72.8
74.8
77.1 76.4
64.0
68.0
72.0
76.0
80.0
-
100,000
200,000
300,000
3QFY09
4QFY09
1QFY10
2QFY10
3QFY10
4QFY10
1QFY11
2QFY11
Deposits (` cr) Advances (` cr) CD ratio (%, RHS)
Agri
16%
Retail
11%
MSME
12%
Medium &
Large
Corporates
37%
Comm. Real
Estate
5%
Services &
Others
19%
4. Punjab National Bank | 2QFY2011 Result Update
October 29, 2010 4
Exhibit 6: CASA ratio - strong above 40%
Source: Company, Angel Research
NIMs high but likely to come down, going forward
During the quarter, the yield on advances increased by 27bp sequentially to
10.55%, and the cost of deposits declined by 6bp sequentially to 4.96%. As a
result, reported NIMs expanded by 12bp sequentially to 4.06%. The higher yield
on advances can be attributed to aggressive lending in MSME (up 16.8% qoq) and
retail (up 16.2% qoq) segments. Consequently, NII increased by a healthy 42.1%
yoy and 13.7% qoq to `2,977cr.
The bank has achieved NIM of 3.99% for 1HFY2011. However, management
expects NIM to decline in 2HFY2011because of the pressure on liquidity and need
for reviewing the deposit rates to ensure enough mobilisation of deposits to fund
the credit growth. For the full year, management expects NIM to be much above its
earlier guidance of 3.5%.
Exhibit 7: Trend in quarterly reported NIM
Source: Company, Angel Research
Healthy core non-interest income
The non-interest income increased 7.4% yoy to `718cr, despite a 74.7% reduction
in treasury gains. Non-interest income, excluding treasury gains, gained a healthy
31.1% yoy to `680cr. Recoveries from written-off accounts grew by a robust
154.3% yoy to `89cr.
37.4
38.8
38.3 38.5
39.5
40.8 40.9 40.6
30.0
32.0
34.0
36.0
38.0
40.0
42.0
3QFY09 4QFY09 1QFY10 2QFY10 3QFY10 4QFY10 1QFY11 2QFY11
3.13
3.74 3.59
3.33 3.24
3.50 3.64
3.99 3.94 4.06
0.00
1.00
2.00
3.00
4.00
5.00
1QFY09
2QFY09
3QFY09
4QFY09
1QFY10
2QFY10
3QFY10
4QFY10
1QFY11
2QFY11
(%)
5. Punjab National Bank | 2QFY2011 Result Update
October 29, 2010 5
Exhibit 8: Non-interest income break-up
Particulars (` cr) 2QFY11 1QFY11 % chg (qoq) 2QFY10 % chg (yoy)
Commission and Brokerage 474 496 (4.4) 381 24.4
Treasury 38 121 (68.6) 150 (74.7)
Forex 30 95 (68.2) 55 (45.0)
Recoveries 89 76 17.1 35 154.3
Others 87 84 4.2 48 81.3
Total 718 872 (17.6) 669 7.4
Source: Company, Angel Research
Asset quality pressures persist
PNB’s gross NPAs increased, in absolute terms, by 11.4% qoq to `4,025cr and net
NPAs rose by 11.1% qoq to `1,426cr. The gross slippages for the quarter stood at
`911cr (`1,216cr in 1QFY2011), indicating an annualised slippage ratio of 2.0%
(2.6% in 1QFY2011). During the quarter, the bank classified its additional
exposure of ~`200cr to Zoom Developers, taking the total exposure classified as
NPA to ~`415cr. The gross NPA ratio deteriorated to 1.9% (as against 1.8% in
1QFY2011). The net NPA ratio remained stable at 0.7%. The bank’s provision
coverage ratio including technical write-offs stood at 77.1% (77.6% in 1QFY2011
and 91.1% in 2QFY2010).
The bank has cumulatively restructured `13,545cr of its loans till date (6.5% of
loans, 68.2% of the net worth). The bank additionally restructured `539cr of loans
during the quarter. Till date, `1,195cr worth of loans have slipped into NPAs from
the restructured accounts (8.8% of the total restructured advances), of which `157
slipped during the current quarter. Management has indicated a broad range of
10-15% as expected slippages from the restructured accounts.
Exhibit 9: Trend in asset quality
Source: Company, Angel Research, Note: NPA coverage excluding tech. write-offs till 4QFY2010
The bank made provisions of `359cr towards the NPAs in 2QFY2011, compared
to `548cr in 1QFY2011 and `56cr in 2QFY2010. Provision for investments stood
at `65cr, compared to `83cr in 2QFY2010.
40.0
55.0
70.0
85.0
100.0
-
900
1,800
2,700
3,600
4,500
2QFY09
3QFY09
4QFY09
1QFY10
2QFY10
3QFY10
4QFY10
1QFY11
2QFY11
Gross NPAs (` cr) Net NPAs (` cr) Provision coverage (%, RHS)
6. Punjab National Bank | 2QFY2011 Result Update
October 29, 2010 6
Exhibit 10: Break-up of provisions
Particulars (` cr) 2QFY11 1QFY11 % chg (qoq) 2QFY10 % chg (yoy)
NPA 359 548 (34.5) 56 541.1
Standard Assets 38 40 (5.0) 74 (48.6)
Investments 65 14 364.3 83 (21.7)
Others 54 (68) - 3 1,719.2
Total 516 534 (3.4) 216 138.9
Source: Company, Angel Research
Operating costs rise due to employee benefits provisions
Operating expenses increased by a substantial 14.6% qoq and 37.8% yoy driven
by the 53.0% yoy rise in employee costs and 12.1% yoy increase in other operating
expenses. The increase in employee expenses was attributable to the provisions
(~`250cr) made on account of gratuity (`125cr) and second pension option
(`125cr) during the quarter. In the 1HFY2011, the bank has provided `250cr for
gratuity and `250cr for second pension option liability. Similar provisions are
expected for the 2HFY011. On account of strong increase in employee costs, the
cost-to-income ratio deteriorated to 43.2% (from 39.9% in 1QFY2011 and 41.9%
in 2QFY2010). We have increased the operating expenses estimates by 11.3% for
FY2011.
Exhibit 11: Trend in productivity
Source: Company, Angel Research
Comfortable capital adequacy
The bank’s CAR stood at a healthy 12.6% at the end of 2QFY2011, with a tier-I
ratio of 8.0%. Tier-I capital constituted 63.5% of the bank’s CAR. Including the
1HFY2011profit, CAR would have improved to 13.6% with tier-I of 9.0%.
644
690
789
801
908
728
833
653
995
1,113
48.3
42.4
38.0
42.5
44.6
41.9
40.6
32.0
39.9
43.2
25.0
30.0
35.0
40.0
45.0
50.0
-
300
600
900
1,200
1,500
1,800
1QFY09
2QFY09
3QFY09
4QFY09
1QFY10
2QFY10
3QFY10
4QFY10
1QFY11
2QFY11
Staff exps (` cr) Other opex (` cr) Cost-to-income ratio (%, RHS)
7. Punjab National Bank | 2QFY2011 Result Update
October 29, 2010 7
Exhibit 12: Comfortable capital adequacy
Source: Company, Angel Research
Investment Arguments
Relatively higher YoA could lead to higher deterioration in asset
quality
PNB has cumulatively restructured `13,545cr worth of loans till date (6.5% of
loans, 68.2% of the net worth), which is higher than the industry standards. In our
view, the bank’s strategy of high growth in advances at relatively high yields could
contribute to relatively higher deterioration in asset quality and NIM compression
going forward.
Strong CASA legacy, but losing market share
PNB has a structural advantage of having a high CASA ratio of 40.6%, which is
driven by strong rural and semi-urban presence, especially in North India (total of
4,707 branches and 2,910 ATMs). That said, the bank is losing market share like
most other PSBs on account of slow branch expansion and competition from the
private banks - savings market share was down by 50bp to 7.1% during
FY2007-10.
Expensive valuations
While we believe the bank can deliver healthy core RoEs of 18-20% due to its
strong legacy, actual RoEs are unsustainably high at 26.6%. In our view, super-
normal RoEs cannot be sustainably earned through higher-than-sector average
risk-adjusted yield on assets and tend to decline in the subsequent years either
through an increase in NPA costs or decline in yields.
The stock is trading at 1.74x FY2012E ABV of `741, ~9% above the upper-end of
its historical range (5-year range of 1.0-1.6x and median of 1.4x) and in our view
does not offer sufficient margin of safety from the negative surprises that could
arise on the asset quality front in the near term. Hence, we maintain a Neutral
rating on the stock.
9.1 9.4 9.3 9.2 8.7 8.0
5.4 5.3 5.3 5.0 5.1
4.6
-
4.0
8.0
12.0
16.0
1QFY10
2QFY10
3QFY10
4QFY10
1QFY11
2QFY11
Tier-I CAR Tier-II CAR(%)
8. Punjab National Bank | 2QFY2011 Result Update
October 29, 2010 8
Exhibit 13: Key assumptions
Particulars (%)
Earlier estimates Revised estimates
FY2011E FY2012E FY2011E FY2012E
Credit growth 22.0 18.0 22.0 18.0
Deposit growth 19.0 18.0 19.0 18.0
CASA ratio 40.2 39.4 40.2 39.4
NIM 3.5 3.3 3.7 3.5
Other income growth (10.3) 14.5 (13.4) 13.6
Growth in staff expenses 17.0 19.0 37.0 15.0
Growth in other expenses 13.0 19.0 13.0 15.0
Slippages 2.3 2.0 2.3 2.0
Coverage ratio 75.0 75.0 75.0 75.0
Treasury gain/(loss) (% of investments) 0.1 0.1 0.1 0.1
Source: Company, Angel Research
Exhibit 14: Change in estimates
Particulars (` cr)
FY2011 FY2012
Earlier
estimates
Revised
estimates
% chg
Earlier
estimates
Revised
estimates
% chg
NII 11,003 11,664 6.0 12,391 13,165 6.3
Non-interest income 3,197 3,087 (3.5) 3,662 3,508 (4.2)
Operating income 14,200 14,751 3.9 16,052 16,673 3.9
Operating expenses 5,506 6,130 11.3 6,552 7,050 7.6
Pre-prov. profit 8,695 8,621 (0.9) 9,500 9,623 1.3
Provisions & cont. 2,277 2,277 - 2,258 2,258 -
PBT 6,417 6,344 (1.2) 7,242 7,365 1.7
Prov. for taxes 2,182 2,157 (1.2) 2,462 2,504 1.7
PAT 4,236 4,187 (1.2) 4,780 4,861 1.7
Source: Company, Angel Research
Exhibit 15: P/ABV band
Source: Company, Angel Research
0
200
400
600
800
1000
1200
1400
1600
May-02
Dec-02
Jul-03
Feb-04
Sep-04
Apr-05
Nov-05
Jun-06
Jan-07
Aug-07
Mar-08
Oct-08
May-09
Dec-09
Jul-10
Feb-11Price (`) 0.25x 0.65x 1.05x 1.45x 1.85x
12. Punjab National Bank | 2QFY2011 Result Update
October 29, 2010 12
Research Team Tel: 022 - 4040 3800 E-mail: research@angeltrade.com Website: www.angeltrade.com
DISCLAIMER
This document is solely for the personal information of the recipient, and must not be singularly used as the basis of any investment
decision. Nothing in this document should be construed as investment or financial advice. Each recipient of this document should make
such investigations as they deem necessary to arrive at an independent evaluation of an investment in the securities of the companies
referred to in this document (including the merits and risks involved), and should consult their own advisors to determine the merits and
risks of such an investment.
Angel Broking Limited, its affiliates, directors, its proprietary trading and investment businesses may, from time to time, make
investment decisions that are inconsistent with or contradictory to the recommendations expressed herein. The views contained in this
document are those of the analyst, and the company may or may not subscribe to all the views expressed within.
Reports based on technical and derivative analysis center on studying charts of a stock's price movement, outstanding positions and
trading volume, as opposed to focusing on a company's fundamentals and, as such, may not match with a report on a company's
fundamentals.
The information in this document has been printed on the basis of publicly available information, internal data and other reliable
sources believed to be true, but we do not represent that it is accurate or complete and it should not be relied on as such, as this
document is for general guidance only. Angel Broking Limited or any of its affiliates/ group companies shall not be in any way
responsible for any loss or damage that may arise to any person from any inadvertent error in the information contained in this report.
Angel Broking Limited has not independently verified all the information contained within this document. Accordingly, we cannot testify,
nor make any representation or warranty, express or implied, to the accuracy, contents or data contained within this document. While
Angel Broking Limited endeavours to update on a reasonable basis the information discussed in this material, there may be regulatory,
compliance, or other reasons that prevent us from doing so.
This document is being supplied to you solely for your information, and its contents, information or data may not be reproduced,
redistributed or passed on, directly or indirectly.
Angel Broking Limited and its affiliates may seek to provide or have engaged in providing corporate finance, investment banking or
other advisory services in a merger or specific transaction to the companies referred to in this report, as on the date of this report or in
the past.
Neither Angel Broking Limited, nor its directors, employees or affiliates shall be liable for any loss or damage that may arise from or in
connection with the use of this information.
Note: Please refer to the important `Stock Holding Disclosure' report on the Angel website (Research Section). Also, please
refer to the latest update on respective stocks for the disclosure status in respect of those stocks. Angel Broking Limited and
its affiliates may have investment positions in the stocks recommended in this report.
Disclosure of Interest Statement Punjab National Bank
1. Analyst ownership of the stock No
2. Angel and its Group companies ownership of the stock Yes
3. Angel and its Group companies' Directors ownership of the stock No
4. Broking relationship with company covered No
Note: We have not considered any Exposure below ` 1 lakh for Angel, its Group companies and Directors.
Ratings (Returns): Buy (> 15%) Accumulate (5% to 15%) Neutral (-5 to 5%)
Reduce (-5% to 15%) Sell (< -15%)