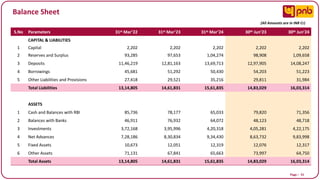
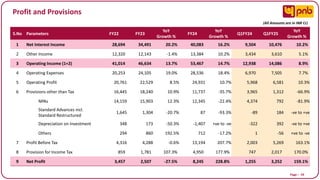
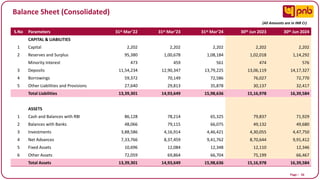
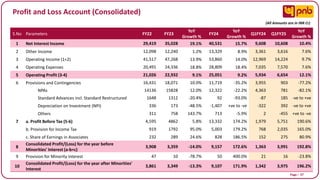
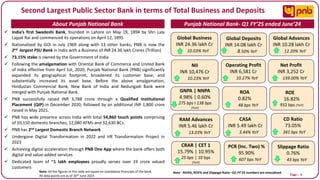
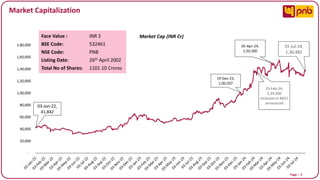
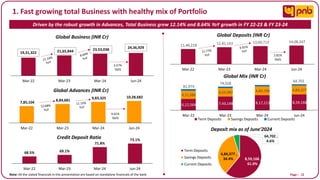
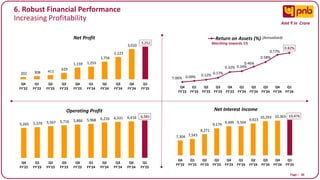
Punjab National Bank (PNB) is India's second-largest public sector bank, with significant business growth and a wide geographical presence following its amalgamation with other banks. As of June 2024, PNB reported impressive financial performance with a global business of INR 24.36 lakh crores and a net profit of INR 3,252 crores, showing a year-on-year increase of 159%. The bank is undergoing a digital transformation and emphasizes improving asset quality and inclusive growth while maintaining a strong focus on retail, agriculture, and MSME advancements.


![Page I 32
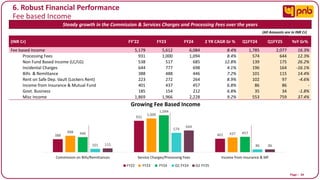
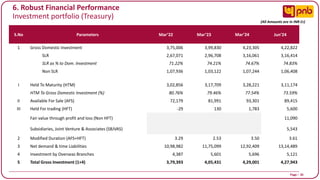
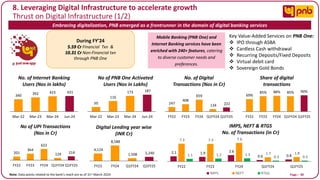
6. Robust Financial Performance
Key Performance Metrics (2/2)
49.38%
51.69%
53.37% 53.28%
FY'22 FY'23 FY'24 Q1 FY'25
Cost to Income Ratio (%)
28.87%
31.76%
34.58%
32.31%
FY'22 FY'23 FY'24 Q1 FY'25
Staff Cost to Income Ratio [%]
19.41
21.64
23.84 24.80
Mar-22 Mar-23 Mar-24 Jun-24
Business Per Employee
(INR Cr)
3.54
2.57
8.61
13.66
FY'22 FY'23 FY'24 Q1 FY'25
Net Profit Per Employee
(INR Lakhs)
Employee Efficiency Metrics Operational Efficiency Metrics (Per Branch)
187.73
209.53
225.25 233.26
Mar-22 Mar-23 Mar-24 Jun-24
Business Per Branch
(INR Cr)
34.23 24.88
81.33
128.47
FY'22 FY'23 FY'24 Q1 FY'25
Net Profit Per Branch
(INR Lakhs)
20.51%
19.93%
18.80%
20.97%
FY'22 FY'23 FY'24 Q1 FY'25
Other Cost to Income Ratio [%]
Annualised
Annualised](https://image.slidesharecdn.com/finalpnbroadshowppt-1-240831165055-956e0f22/85/FINAL_PNB_Roadshow_Ppt-1-presentation-pnb-32-320.jpg)