Market outlook 29 10 10
•
1 like•70 views

The document provides a summary of market performance and analysis of company results for several Indian companies. The key points are: 1) Indian stock markets ended lower, with the Sensex and Nifty losing 0.3% and 0.4% respectively, amid volatility. 2) Company results were mixed, with some like ONGC and Cairn India beating expectations while others like SAIL and PNB met expectations and Grasim and NMDC missed. 3) Summaries of individual company results are provided for ONGC, NMDC, SAIL, Cairn India, PNB, Grasim, Sun TV Network and GlaxoSmithKline Pharma.

Recommended
More Related Content
What's hot
What's hot (20)
Viewers also liked
Viewers also liked (17)
Similar to Market outlook 29 10 10
Similar to Market outlook 29 10 10 (20)
More from Angel Broking
More from Angel Broking (20)
Recently uploaded
Recently uploaded (20)
Market outlook 29 10 10
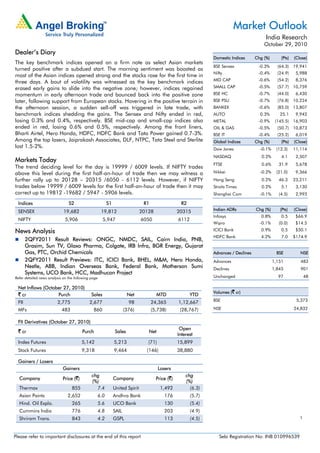
- 1. 1 Market Outlook India Research October 29, 2010 Please refer to important disclosures at the end of this report Sebi Registration No: INB 010996539 Dealer’s Diary The key benchmark indices opened on a firm note as select Asian markets turned positive after a subdued start. The morning sentiment was boosted as most of the Asian indices opened strong and the stocks rose for the first time in three days. A bout of volatility was witnessed as the key benchmark indices erased early gains to slide into the negative zone; however, indices regained momentum in early afternoon trade and bounced back into the positive zone later, following support from European stocks. Hovering in the positive terrain in the afternoon session, a sudden sell-off was triggered in late trade, with benchmark indices shedding the gains. The Sensex and Nifty ended in red, losing 0.3% and 0.4%, respectively. BSE mid-cap and small-cap indices also ended in red, losing 0.6% and 0.5%, respectively. Among the front liners, Bharti Airtel, Hero Honda, HDFC, HDFC Bank and Tata Power gained 0.7-3%. Among the top losers, Jaiprakash Associates, DLF, NTPC, Tata Steel and Sterlite lost 1.5-2%. Markets Today The trend deciding level for the day is 19999 / 6009 levels. If NIFTY trades above this level during the first half-an-hour of trade then we may witness a further rally up to 20128 – 20315 /6050 - 6112 levels. However, if NIFTY trades below 19999 / 6009 levels for the first half-an-hour of trade then it may correct up to 19812 -19682 / 5947 - 5906 levels. Indices S2 S1 R1 R2 SENSEX 19,682 19,812 20128 20315 NIFTY 5,906 5,947 6050 6112 News Analysis 2QFY2011 Result Reviews: ONGC, NMDC, SAIL, Cairn India, PNB, Grasim, Sun TV, Glaxo Pharma, Colgate, IRB Infra, BGR Energy, Gujarat Gas, PTC, Orchid Chemicals 2QFY2011 Result Previews: ITC, ICICI Bank, BHEL, M&M, Hero Honda, Nestle, ABB, Indian Overseas Bank, Federal Bank, Motherson Sumi Systems, UCO Bank, HCC, Madhucon Project Refer detailed news analysis on the following page Net Inflows (October 27, 2010) ` cr Purch Sales Net MTD YTD FII 2,775 2,677 98 24,365 1,12,667 MFs 483 860 (376) (5,738) (28,767) FII Derivatives (October 27, 2010) ` cr Purch Sales Net Open Interest Index Futures 5,142 5,213 (71) 15,899 Stock Futures 9,318 9,464 (146) 38,880 Gainers / Losers Gainers Losers Company Price (`) chg (%) Company Price (`) chg (%) Thermax 855 7.4 United Spirit 1,492 (6.3) Asian Paints 2,652 6.0 Andhra Bank 176 (5.7) Hind. Oil Explo. 265 5.6 UCO Bank 130 (5.4) Cummins India 776 4.8 SAIL 203 (4.9) Shriram Trans. 843 4.2 GSPL 113 (4.5) Domestic Indices Chg (%) (Pts) (Close) BSE Sensex -0.3% (64.3) 19,941 Nifty -0.4% (24.9) 5,988 MID CAP -0.6% (54.2) 8,376 SMALL CAP -0.5% (57.7) 10,759 BSE HC -0.7% (44.0) 6,430 BSE PSU -0.7% (76.8) 10,224 BANKEX -0.6% (85.0) 13,807 AUTO 0.3% 25.1 9,942 METAL -0.9% (145.5) 16,903 OIL & GAS -0.5% (50.7) 10,873 BSE IT -0.4% (25.2) 6,019 Global Indices Chg (%) (Pts) (Close) Dow Jones -0.1% (12.3) 11,114 NASDAQ 0.2% 4.1 2,507 FTSE 0.6% 31.9 5,678 Nikkei -0.2% (21.0) 9,366 Hang Seng 0.2% 46.3 23,211 Straits Times 0.2% 5.1 3,130 Shanghai Com -0.1% (4.5) 2,993 Indian ADRs Chg (%) (Pts) (Close) Infosys 0.8% 0.5 $66.9 Wipro -0.1% (0.0) $14.5 ICICI Bank 0.9% 0.5 $50.1 HDFC Bank 4.2% 7.0 $174.9 Advances / Declines BSE NSE Advances 1,151 483 Declines 1,845 901 Unchanged 97 48 Volumes (` cr) BSE 5,373 NSE 24,832
- 2. October 29, 2010 2 Market Outlook | India Research Result Reviews – 2QFY2011 ONGC ONGC’s results were in line with our expectation on the top-line front, while they were lower than our expectation on the bottom-line front on account of higher depreciation, depletion and amortisation (DD&A) expenditure. Operating income increased by 20.2% yoy to `18,430cr (`15,338cr) during the quarter. Both gross realisations and net realisations were in line with our expectations. Gross realisations stood at US $79.2/bbl (US $70.5/bbl). During 2QFY2011, the company shared a subsidy burden of `3,019cr (`2,630cr). Hence, net realisations stood at US $62.8/bbl (US $56.4/bbl). Crude oil sales volumes were marginally up, whereas gas sales volume fell to 5BCM (5.2BCM). OPM expanded by 288bp yoy to 61.4% (58.6%), aided by lower other operating expenses, resulting in EBITDA registering growth of 26.1% yoy to `11,322cr (`8,981cr). DD&A cost increased by whopping 86.8% yoy to `4,400cr (`2,356cr), which was much higher than our estimate of `3,300cr. Other income during the quarter declined by 8.7% yoy to `906cr (`993cr). Net profit increased by 5.9% yoy to `5,389cr (`5,090cr), lower than our estimate of `6,198cr, mainly due to higher-than-expected DD&A expenditure. We maintain Neutral on ONGC. NMDC NMDC’s 2QFY2011 net revenue increased by 77% yoy to `2,460cr but was down 2.3% qoq. The company’s sales volumes were impacted by a) the monsoon season and b) ban on iron sales in Karnataka. For 2QFY2011, the company increased its domestic prices by 14.8% qoq, whereas export prices were increased by 22.2% qoq. On the cost front, royalty charges on iron ore increased to `200cr in 2QFY2011 as compared to `62cr in 2QFY2010 and `139cr in 1QFY2011. Further, freight cost increased by 69.4% yoy and 50.1% qoq to `189cr. As a result, EBITDA margin expanded by 170bp yoy to 74.8% but fell by 664bp on a sequential basis. This resulted in EBITDA growing by 81.1% yoy to `1,840cr but was down 10.3% qoq. Consequently, net profit increased by 78.8% yoy to `1,379cr but down 8.3% qoq. The Target Price is currently under review. SAIL During 2QFY2011, SAIL’s net revenue increased by 6.6% yoy and 17.4% qoq to `10,603cr, above our estimate of `9,110cr. The deviation in the top line was mainly due to higher sales volumes of 3mn tonnes as compared to our estimate of 2.64mn tonnes. While sales volume grew by 2.7% yoy and 26.3% qoq to 3mn tonnes, realisations increased by 3.8% yoy to `34,993/tonne but were down 7.0% qoq. Despite top-line growth, EBITDA margin contracted by 803bp yoy and 443bp qoq to 16% due to a) an additional provision of `70.1cr towards employee-related benefits and b) higher coking coal cost during the quarter. Consequently, EBITDA declined by 29% yoy and 8% qoq to `1,695cr. Net interest income declined by 49.3% yoy and 8.6% qoq to `224cr, whereas depreciation expense increased by 11% yoy to `369cr. Thus, higher cost resulted in net income posting a decline of 34.5% yoy and 7.4% qoq to `1,090cr. Going ahead, we believe SAIL will benefit from strong domestic demand. However, as the benefits of capacity expansion are expected post FY2012E, we maintain our Neutral view on the stock. Further, plans of follow-on public offer in the near future could direct the stock price movement from current levels.
- 3. October 29, 2010 3 Market Outlook | India Research Cairn India Cairn India announced strong 2QFY2011 results, driven by the volume ramp-up at the Rajasthan block. The company’s top line during the quarter registered growth ~1,067% yoy to `2,686cr (`230cr). The average oil price realisation during the quarter was at US $69.5/bbl compared to US $69.1/bbl in 2QFY2010. Gas price realisation in 2QFY2011 was US $4.5/mscf compared to US $3.9/mscf in 2QFY2010. Average price realisation/boe was US $67.8 compared to US $59.6 during 2QFY2010. Average realisation for Rajasthan fields was US $67.8/bbl, a 10.6% average discount to Brent. Rajasthan per barrel operating cost continued to decline as volumes increased. However, the company continues to maintain its guidance on direct opex and pipeline opex. The bottom line during the quarter registered an increase of 237.6% and stood at `1,585cr(`470cr), which was lower than our estimates. On the operational front, Mangala field production ramped up to the currently approved 125kbpd and the average production during the quarter ended September 30, 2010, was 116 kbpd. CIL continues to exhibit great reservoir deliverability. The company has indicated that production from the Rajasthan block is likely to be ramped up to 175kbpd from the current 125kbpd by the end of CY2011E, likely entirely from Mangala and Bhagyam fields on account of better well performance. Production from Aishwariya fields will commence in 1HCY2012E. We maintain a Neutral view on the stock. Punjab National Bank PNB announced its 2QFY2011 results. The bank reported moderate net profit growth of 0.6% qoq and 15.9% yoy to `1,075cr, slightly above our estimates of `1,007cr on account of higher-than-expected NIMs and lower provisioning on the NPA front. However, gross NPAs increased by 11.4% qoq to `4,025cr and net NPAs increased by 11.1% qoq to `1,426cr. The provision coverage ratio stood at 77.1%, including technical write-offs (v/s 91% a year ago). Higher NIMs and lower NPA provisions more than made up for large provisions for employee benefits (we have increased our FY2011E and FY2012E staff expense estimates by 11.3% and 7.6%, respectively, to reflect the same). Advances growth was strong at 6.0% qoq and 27.6% yoy. Deposits also increased by healthy 7.1% qoq and 18.4% yoy. On a sequential basis, reported NIMs improved by 12bp to 4.06%. This resulted into healthy NII growth of 42.1% yoy. At the CMP, the stock is trading at 1.8x FY2012E ABV. We maintain a Neutral recommendation on the stock. We may further revise our estimates post interaction with the management. Grasim Grasim’s 2QFY2011 consolidated top line declined by 5.1% yoy to `4,503cr, primarily due to a poor performance of its cement business. Revenue of the cement business (represented by subsidiary UltraTech) declined by 10.5% yoy to `3,285cr. The Viscose Staple Fibre (VSF) business’s revenue remained flat at `856cr despite reporting a 9% decline in sales volume to 67,488MT, as its realisations were up by 11% and stood at `116,465/tonne. Grasim’s consolidated operating profit declined by 49.2% yoy to `786cr due to a 60% decline in the operating profit of the cement business to `476cr. Operating profit of the VSF business also declined by 23% yoy to `273cr. On the bottom-line front, the company’s net profit declined by 58.9% yoy to `363cr. We are currently working on the numbers and maintain a Neutral view on the stock.
- 4. October 29, 2010 4 Market Outlook | India Research Sun TV Network Sun TV continued to post yet another quarter of robust results on both the revenue and the earnings fronts. Management has indicated that ~19% yoy/4% qoq growth in advertising revenue (led by price hikes and better inventory utilisation), ~75% yoy /3% qoq growth in DTH revenue (assuming 6.6mn subscriber base, ~`40 ARPU) and 49% yoy/6% qoq jump in analogue revenue were the key drivers behind robust 33% top-line growth. OPM expanded by 221bp yoy, driven by cost rationalisations and incremental revenue gains from hikes in advertising rate and increase in pay slots driving 28% yoy growth in earnings (partially impacted by 59% jump in depreciation/amortisation charges, resulting in a 134bp yoy contraction in EBIT margin). Currently, the stock is trading at premium valuations. Hence, we maintain a Neutral view on the stock (The Target Price is under review). GlaxoSmithKline Pharma - 3QCY2010 GlaxoSmithKline Pharma (Glaxo) reported strong 3QCY2010 results. Net sales came in at `582cr (`512cr), up 13.7% yoy, driven by growth in all segments–mass markets, mass specialities and specialities. Glaxo’s vaccine segment registered strong growth after sluggish performance in 2QCY2010. The company reported a 186bp contraction in gross margins to 63.0% (64.9%) on the back of high raw-material cost. Further, other expenses grew by 15.8% to `101cr (`87cr), while employee expenses remained flat yoy. As a result, OPM contracted by 100bp to 35.9% (36.9%). The company reported other income of `33cr (`23cr), up 40.7% yoy, primarily on the back of higher interest income. Net profit came in at `158cr (`141cr), up 11.8% yoy, driven by top-line growth and other income. The stock is under review. Colgate Colgate reported a modest set of numbers for the quarter, though below our estimates. Top-line growth stood at 13.2% yoy, 2% below our estimates, driven completely by volumes. Earnings grew by 3%, below estimates, at 11.8% yoy, owing to sharp spike in staff costs and other expenses. However, OPM expanded by 82bp yoy, aided by gross margin expansion and cut in ad spends. During FY2010-12E, we expect Colgate’s top line to report a 15% CAGR (largely volume growth) and have modeled in margin expansion of 200bp yoy, despite sustained higher ad spends aided by a benign input cost environment and higher operating leverage. However, in terms of earnings, we expect Colgate to register muted ~11% CAGR (4% in FY2011E) as we model in higher tax rate (~24% in FY2011). Hence, we retain our Reduce rating on the stock with a Target Price of `838 (based on 22x FY2012E EPS, in line with its historical valuation). IRB Infra IRB reported robust top-line growth of 37.8% to `490.3cr, above our expectations of `465.4cr. This was primarily due to 46.4% growth in the construction vertical, against our 33% growth for the quarter. Further, IRB continued to surprise on the margin front and posted EBITDA margin of 48.2% against our expectations of 44.9%. The company surprised by posting EBITDA margin of 24.0% (construction segment) for the quarter, a 330bp yoy jump. The bottom line grew by 39.9%, beating our estimates, mainly on account of top-line growth, higher EBITDA margin and lower tax provision at 15.5%.
- 5. October 29, 2010 5 Market Outlook | India Research We have valued IRB's business model on an SOTP basis at `273, where road BOT SPVs have been valued on NPV basis (FY2012E), and have accorded a 10% growth premium (`149.8/share). The construction segment has been valued at 8x FY2012E EV/EBITDA (`118.1/share). IRB's other investments have been valued at 1.5x FY2010 book value (`4.6/share). We maintain our Neutral view on the stock with a fair value of `273, since it offers limited upside from current levels. BGR Energy Systems BGR Energy posted a strong a set of numbers for 2QFY2011, with robust top-line growth of 143% yoy to `1,134cr (`466cr), primarily driven by the strong execution of its outstanding order book. On the operating front, margins compressed by 100bp to 11.7% (12.7%) for 2QFY2011. However, on the back of strong top-line growth, net profit grew strongly by 154% yoy to `78 (`31cr) for 2QFY2011. Currently, we maintain our Neutral view on the stock and will revisit our estimates post the conference call. Gujarat Gas – 3QCY2010 Gujarat Gas reported its 3QCY2010 results, which were higher than our expectations on the top-line front on account of higher cost of gas (because of increased APM gas price and higher off-take of relatively costly LNG). However, results were in line with our expectation on the bottom-line front. Top line increased by 30.7% yoy to `507cr (`388cr) as against our expectation of `442cr, whereas bottom line increased by 27% yoy to `56cr (`44cr) in line with our expectation of `57cr. During the quarter, volume stood at 3.42mmscmd as against our expectation of 3.37mmscmd. Significant portion of RLNG was procured during the quarter on account of shutdown at Panna-Mukta field. Gross spread took a hit during the quarter and stood at `3.7/scm (fall below `4/scm after it was first registered in 4QCY2009) on account of higher cost of gas procured, despite 3.9% rupee appreciation. However, on a yoy basis, gross spread increased by 8.3% yoy to `3.7/scm `3.5/scm. Thus, OPM fell by 47bp yoy to 17.8%. We maintain a Neutral view on the stock. PTC PTC’s 2QFY2011 standalone top line remained flat on a yoy basis at `2,469cr. However, traded volumes, which are a better indicator of the company’s performance, rose by 21% yoy to 7,730MU (6,388MU). Operating profit also grew by 28.3% yoy to `38cr, primarily due to higher margins on short-term trades (STT). As per the current CERC norms, margins on STT are capped at 7paise/unit as against a cap of 4paise/unit, which prevailed in 2QFY2010. Further, the company’s employee expenses turned into a negative `3.3cr in 2QFY2011 (v/s `4.9cr in 2QFY2010) due to reversal of Employee Stock Option (ESOP) expenses of `5.7cr, which boosted the operating margin considerably. Net profit rose by 29.3% yoy to `40cr, primarily on better operating performance. We maintain a Neutral view on the stock.
- 6. October 29, 2010 6 Market Outlook | India Research Orchid Chemicals Orchid Chemicals reported its 2QFY2011 results, which were a mixed bag. Net sales came in at healthy `368cr (`305cr), up 20.8% yoy and ahead of our estimates of `315cr, driven by Hospira contract and commencement of Meropenem API supply to other players also. The company reported flat gross margin of 53.3% (62.1%) on the back of increasing contribution from the API segment (75% of sales as against 52% earlier). Further, employee and other expenses grew by 7.8% to `32cr (`30cr) and 24.0% to `100cr (`81cr), respectively. As a result, OPM contracted to 17.5% (25.9%) and was below our estimates. Net profit came in at `24cr (loss of `13cr) on the back of top-line growth, higher other income and MTM forex gain. The company recorded other income of `16cr (`10cr), up 68.5% yoy, which included `8cr under the Alvogen deal. Further, MTM gain on FCCB amounted to `4cr (loss of `5cr). On the positive front, debtors days came down to 181 days as of September 2010 from 217 days as of March 2010. We maintain Neutral on the stock at these levels. Result Previews – 2QFY2011 ITC ITC is expected to announce its 2QFY2011 results. For the quarter, we expect ITC to report 19.0% yoy growth in its top line to `5,110cr, impacted by strong growth in its hotels, paperboards and packaging and cigarettes segments. Earnings for the quarter are expected to grow by 21.5% yoy to `1,227.4cr, largely driven by its top line. We maintain a Neutral rating on the stock. ICICI Bank ICICI Bank is slated to declare its 2QFY2011 results. We expect the bank to report marginal net interest income growth of 2.1% yoy and 4.4% qoq. Net interest margin is expected to be flattish. The cost-to-income ratio is expected to go up sequentially to 41.2% from 40.4%. The pre-provision profit of the bank is expected to decline by 9.2% yoy on account of a decline in non-interest income. Net profit is expected to increase by 9.9% yoy and 11.4% qoq to `1,143cr. At the CMP, the stock is trading at valuations of 2.2x FY2012E ABV, which is lower than our target multiple of 2.6x. Hence, we maintain a Buy rating on the stock with a 12-month Target Price of `1,350. BHEL BHEL is scheduled to announce its 2QFY2011 results. The top line is expected to grow by 32.5% yoy to `8,914cr. On the operating front, we expect margins to expand by 69bp yoy to around 19%. Net profit is expected to increase by 33.3% yoy to `1,143cr. Currently, we remain Neutral on the stock and will revisit our estimates post the conference call. Mahindra and Mahindra Mahindra and Mahindra is slated to announce its 2QFY2011 results. We expect the company’s top line to grow by 19.8% yoy to `5,351cr due to 20.8% yoy growth in total volumes. On the operating front, EBITDA margin is expected to decline by 338bp yoy to 14.9%. Hence, the bottom line is expected to decline by 5.7% yoy to `538cr. The stock rating is under review.
- 7. October 29, 2010 7 Market Outlook | India Research Hero Honda Hero Honda is scheduled to announce its 2QFY2011 results. We expect the company’s top line to grow by 9.8% yoy to `4,435cr on account of 8.7% yoy growth in volumes and marginal improvement in realisation. EBITDA margin is expected to decline by 445bp yoy to 13.9%. As a result, the bottom line is expected to decline by 14.6% yoy to `510cr. The stock rating is under review. Nestle - 3QCY2010 Nestle is expected to announce its 3QCY2010 results. For the quarter, we expect the company to post modest 19.0% yoy growth in its top line to `1,549.7cr, aided by steady volume growth across categories and new product launches. Earnings for the quarter are expected to register modest 16.1% yoy growth to `212.1cr, aided by a 39bp margin contraction of 20.58%. However, owing to the recent run up in the stock price, we recommend a Neutral view on the stock ABB Ltd. ABB is scheduled to announce its 3QCY2010 results. The top line is expected to post muted growth of 1% yoy to `1,484cr. On the operating front, we expect margins to contract by 185.9bp yoy to around 7.5%. Net profit is expected to decline by 22.7% yoy to `64cr. We maintain our Neutral recommendation on the stock. Indian Overseas Bank Indian Overseas Bank (IOB) is scheduled to announce its 2QFY2011 results. The bank is expected to post net interest income growth of 18.5% yoy to `929cr. Operating income is expected to decline by 3.8% yoy on account of much lower treasury gains. Net profit is expected to decline by 29.1% yoy to `183cr on account of higher provisions. At the CMP, the stock is trading at valuations of 8.1x FY2012E EPS of `20.1 and 1.1x FY2012E ABV of `143.5. We have an Accumulate rating on the stock with a Target Price of `187. Federal Bank Federal Bank is scheduled to announce its 2QFY2011 results. We expect the bank to report healthy net interest income growth of 25.3% yoy to `413cr. Non-interest income is expected to decline by 24.6% yoy because of lower treasury gains. The cost-to-income ratio is expected to increase to 38% compared to the four-quarter average of 34.8%. The bank’s pre-provision profit is expected to show a moderate gain of 5.5% yoy to `320cr. Net profit is expected to increase by healthy 25.9% yoy to `127cr. At the CMP, the stock is trading at valuations of 1.4x FY2012E ABV. We maintain an Accumulate rating on the stock, valuing it at 1.5x FY2012E ABV of `341.3 to arrive at a 12-month Target Price of `512. Motherson Sumi Systems Motherson Sumi is likely to announce its 2QFY2011 results. The company is expected to post 19.2% yoy growth in revenue to `1,893cr for the quarter. On the operating front, the company is expected to post a 206bp yoy margin expansion to 9.7%. Hence, net profit is expected to surge substantially by 318% yoy to `63cr. The stock rating is under review.
- 8. October 29, 2010 8 Market Outlook | India Research UCO Bank UCO Bank is scheduled to announce its 2QFY2011 results. We expect the bank to report robust net interest income growth of 77.7% yoy to `934cr. Non-interest income is expected to be muted on account of lower treasury gains. The cost-to-income ratio is expected to improve to 44% compared to its four-quarter average of 45.9%. The bank’s pre-provision profit is expected to show a strong gain of 75.1% yoy to `644cr. However, the net profit is expected to decline by 36.6% qoq and 20.6% yoy to `165cr on account of higher NPA provisioning expenses. At the CMP, the stock is trading at valuations of 1.2x FY2012E ABV. We maintain a Neutral rating on the stock. HCC HCC is expected to announce its 2QFY2011 results. We expect the company to post marginal top-line growth of 5.2% to `823cr, impacted by Andhra Pradesh crisis and delay in pick-up of the hydro projects due to heavy rains. On the operating margin front, the performance is expected to be slightly better with a 68bp increase yoy to 12.1%. However, net profit is expected to register a 49.7% decline yoy to `10.5cr, primarily due to higher interest and depreciation costs. In light of the rich valuations that the stock trades at, we maintain our Neutral view. Madhucon Project Madhucon Projects (MPL) is expected to announce its 2QFY2011 results. We expect MPL to register healthy growth of 36% yoy to `346cr on the top-line front. However, operating margin is expected to decline by 193bp to 9.3%. On bottom-line front, a 29% yoy decline is expected to `8.5cr. We maintain our Buy view on the stock with a Target Price of `173. Economic and Political News September infra output up 2.5% Food inflation falls sharply by 1.78% to 13.75% 17.2% increase in Direct Tax Collection: Revenue Secy RBI may raise policy rates to rein in inflation: FICCI Corporate News No pre-condition for approving Cairn-Vedanta deal: ONGC Dhanlaxmi Bank buys 15% stake in Destimoney Securities Core Projects bags `26cr order from Gujarat Govt. RPower places US $8.3bn order with Shanghai Electric Source: Economic Times, Business Standard, Business Line, Financial Express, Mint
- 9. October 29, 2010 9 Market Outlook | India Research Events for the day ABB Results Atlas Copco Results Ballarpur Inds Results Bharat Elect Results BHEL Results Bilcare Results Blue Star Results Century Ply Results EIH Associated Results Federal Bank Results GHCL Results Gillette India Results Godawari Power Results Graphite India Results Great Eastern Shipping Results Gujarat Flurochemicals Ltd Results Gujarat Pipavav Results Hero Honda Results Hindustan Const Results Hitachi Home Results ICICI Bank Results India Glycols Results India Nippon Results Indian overseas Bank Results ITC Results JKumar Infra Results Jagran Prakashan Results Jet Air India Results JK Paper Results JMC Projects Results Kansai Nerolac Results KPIT Cummins Results Maharashtra Seamless Results Mahindra & Mahindra Results Moser Baer Results Nagarjuna Fert. Results National Fertilisers Results Nestle India Results Nirlon Results NRB Bearings Results Pratibha Inds Results Shipping Corporation of India Ltd Results SJVN Results Syndicate Bank Results Tata Chemicals Results TTK Prestige Results Uco Bank Results Welspun India Results
- 10. October 29, 2010 10 Market Outlook | India Research Research Team Tel: 022-4040 3800 E-mail: research@angeltrade.com Website: www.angeltrade.com DISCLAIMER This document is solely for the personal information of the recipient, and must not be singularly used as the basis of any investment decision. Nothing in this document should be construed as investment or financial advice. Each recipient of this document should make such investigations as they deem necessary to arrive at an independent evaluation of an investment in the securities of the companies referred to in this document (including the merits and risks involved), and should consult their own advisors to determine the merits and risks of such an investment. Angel Broking Limited, its affiliates, directors, its proprietary trading and investment businesses may, from time to time, make investment decisions that are inconsistent with or contradictory to the recommendations expressed herein. The views contained in this document are those of the analyst, and the company may or may not subscribe to all the views expressed within. Reports based on technical and derivative analysis center on studying charts of a stock's price movement, outstanding positions and trading volume, as opposed to focusing on a company's fundamentals and, as such, may not match with a report on a company's fundamentals. The information in this document has been printed on the basis of publicly available information, internal data and other reliable sources believed to be true, but we do not represent that it is accurate or complete and it should not be relied on as such, as this document is for general guidance only. Angel Broking Limited or any of its affiliates/ group companies shall not be in any way responsible for any loss or damage that may arise to any person from any inadvertent error in the information contained in this report. Angel Broking Limited has not independently verified all the information contained within this document. Accordingly, we cannot testify, nor make any representation or warranty, express or implied, to the accuracy, contents or data contained within this document. While Angel Broking Limited endeavours to update on a reasonable basis the information discussed in this material, there may be regulatory, compliance, or other reasons that prevent us from doing so. This document is being supplied to you solely for your information, and its contents, information or data may not be reproduced, redistributed or passed on, directly or indirectly. Angel Broking Limited and its affiliates may seek to provide or have engaged in providing corporate finance, investment banking or other advisory services in a merger or specific transaction to the companies referred to in this report, as on the date of this report or in the past. Neither Angel Broking Limited, nor its directors, employees or affiliates shall be liable for any loss or damage that may arise from or in connection with the use of this information. Note: Please refer to the important ‘Stock Holding Disclosure' report on the Angel website (Research Section). Also, please refer to the latest update on respective stocks for the disclosure status in respect of those stocks. Angel Broking Limited and its affiliates may have investment positions in the stocks recommended in this report. Angel Broking Ltd: BSE Sebi Regn No : INB 010996539 / CDSL Regn No: IN - DP - CDSL - 234 - 2004 / PMS Regn Code: PM/INP000001546 Angel Capital & Debt Market Ltd: INB 231279838 / NSE FNO: INF 231279838 / NSE Member code -12798 Angel Commodities Broking (P) Ltd: MCX Member ID: 12685 / FMC Regn No: MCX / TCM / CORP / 0037 NCDEX : Member ID 00220 / FMC Regn No: NCDEX / TCM / CORP / 0302 Address: Acme Plaza, ‘A’ Wing, 3rd Floor, M.V. Road, Opp. Sangam Cinema, Andheri (E), Mumbai - 400 059. Tel : (022) 3952 4568 / 4040 3800