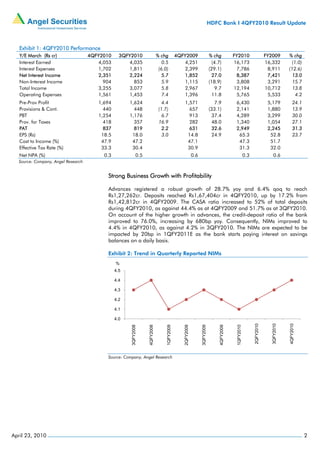
4QFY2010 Result Update I Banking
                                                                                                                        April 23, 2010


  HDFC Bank                                                                              BUY
                                                                                         CMP                                  Rs1944
  Performance Highlights                                                                 Target Price                        Rs2,220
  HDFC Bank reported a Net Profit growth of 32.6% yoy to Rs837cr, in line with          Investment Period                   12 Months
  our estimates. Strong Business growth, improvement in Profitability and asset
  quality, coupled with a strong traction in CASA deposits, were the key positives      Stock Info
  from the results. We maintain a Buy on the stock.
                                                                                        Sector                                Banking

  Robust performance on all parameters: Advances registered a growth of                 Market Cap (Rs cr)                    89,001
  28.7% yoy to reach Rs1,27,262cr. Deposits reached Rs1,67,404cr in                     Beta                                      0.8
  4QFY2010, up by 17.2% from Rs1,42,812cr in 4QFY2009. The CASA ratio
  increased to 52% of total deposits during 4QFY2010, as against 44.4% as at            52 WK High / Low                 1986/1063
  4QFY2009 and 51.7% as at 3QFY2010. On account of the higher growth in
                                                                                        Avg. Daily Volume                     174855
  advances, the credit-deposit ratio of the bank improved to 76.0%, increasing
  by 680bp yoy. Consequently, NIMs improved to 4.4% in 4QFY2010, as                     Face Value (Rs)                           10
  against 4.2% in 3QFY2010. The asset quality of the bank improved
                                                                                        BSE Sensex                             17694
  sequentially, with Gross NPAs at 1.4% (1.6% in 3QFY2010) and net NPAs at
  0.3% (0.4% in 3QFY2010). The NPA coverage ratio based on specific                     Nifty                                  5,304
  provisions was at 78.4% in 4QFY2010, as compared to 72.4% in 3QFY2010
  and 68.4% in 4QFY2009. During 4QFY2010, non-interest income stood                     Reuters Code                         HDBK.BO
  Rs904cr, down 18.9% yoy due to a treasury loss of Rs47cr in 4QFY2010                  Bloomberg Code                  HDFCB@IN
  (treasury gains of Rs243cr in 4QFY2009) and a muted fee income growth of
  7.1% yoy. The Bank’s total Capital Adequacy (as per Basel-2 guidelines)               Shareholding Pattern (%)
  remained strong at 17.4%, with Tier-I forming 75% of the total CAR. The bank
                                                                                        Promoters                                23.9
  opened a substantial 313 branches and 937 ATMs during FY2010, to take its
  branch network to 1,725 branches and 4,232 ATMs at the end of FY2010.                 MF/Banks/Indian FIs                     20.0
  Outlook and Valuation: At the CMP, the stock is trading at 16.3x FY2012E              FII/NRIs/OCBs                            46.4
  EPS of Rs119.4 and 3.1x FY2012E ABV of Rs632. We believe that HDFC Bank
  is once again positioned for a high qualitative growth trajectory, with both the      Indian Public                             9.7
  CASA and Cost-to-Income ratios returning to about pre-CBoP levels. In our
                                                                                        Abs (%)             3m        1yr         3yr
  view, with its strong capital adequacy and substantial branch expansion, the
  Bank is set to further gain CASA market share and achieve a strong growth in          Sensex              4.9       58.9       27.0
  fee income, as the economic environment continues to improve. We maintain
  a Buy on the stock, with a Target Price of Rs2,220.                                   HDFCBK            62.5        78.0       96.9


   Key Financials
   Y/E March (Rs cr)            FY2009           FY2010           FY2011E   FY2012E
   NII                            7,421            8,387           10,526    13,470
   % chg                             42.0            13.0            25.5      28.0
   Net Profit                     2,245            2,949            3,933     5,390
   % chg                             41.2            31.3            33.4      37.0
   NIM (%)                            4.9             4.3             4.4       4.5
                                                                                      Vaibhav Agrawal
   EPS (Rs)                          52.8            65.3            87.1     119.4
                                                                                      Tel: 022 – 4040 3800 Ext: 333
   P/E (x)                           36.8            29.8            22.3      16.3   E-mail: vaibhav.agrawal@angeltrade.com
   P/ABV (x)                          5.5             4.1             3.6       3.1
   RoA (%)                            1.4             1.5             1.6       1.7   Amit Rane
                                                                                      Tel: 022 – 4040 3800 Ext: 326
   RoE (%)                           16.9            16.2            17.2      20.4
                                                                                      E-mail: amitn.rane@angeltrade.com
   Source: Company, Angel Research


                                                                                                                                        1
Please refer to important disclosures at the end of this report                          Sebi Registration No: INB 010996539
HDFC Bank I 4QFY2010 Result Update


   Exhibit 1: 4QFY2010 Performance
   Y/E March (Rs cr)                4QFY2010      3QFY2010                   % chg           4QFY2009                       % chg            FY2010                       FY2009        % chg
   Interest Earned                     4,053         4,035                      0.5             4,251                         (4.7)          16,173                       16,332         (1.0)
   Interest Expenses                   1,702         1,811                    (6.0)             2,399                       (29.1)            7,786                        8,911        (12.6)
   Net Interest Income                  2,351        2,224                      5.7             1,852                        27.0             8,387                        7,421          13.0
   Non-Interest Income                    904          853                      5.9             1,115                       (18.9)            3,808                        3,291          15.7
   Total Income                        3,255         3,077                      5.8             2,967                           9.7          12,194                       10,712          13.8
   Operating Expenses                  1,561         1,453                      7.4             1,396                        11.8             5,765                        5,533           4.2
   Pre-Prov Profit                      1,694         1,624                     4.4             1,571                          7.9            6,430                        5,179            24.1
   Provisions & Cont.                     440           448                   (1.7)               657                       (33.1)            2,141                        1,880            13.9
   PBT                                  1,254         1,176                     6.7               913                        37.4             4,289                        3,299            30.0
   Prov. for Taxes                        418           357                   16.9                282                        48.0             1,340                        1,054            27.1
   PAT                                    837           819                     2.2               631                        32.6             2,949                        2,245            31.3
   EPS (Rs)                              18.5          18.0                     3.0              14.8                        24.9              65.3                         52.8            23.7
   Cost to Income (%)                    47.9          47.2                                      47.1                                          47.3                         51.7
   Effective Tax Rate (%)                33.3          30.4                                      30.9                                          31.3                         32.0
   Net NPA (%)                            0.3               0.5                                            0.6                                           0.3                  0.6
  Source: Company, Angel Research


                                           Strong Business Growth with Profitability

                                           Advances registered a robust growth of 28.7% yoy and 6.4% qoq to reach
                                           Rs1,27,262cr. Deposits reached Rs1,67,404cr in 4QFY2010, up by 17.2% from
                                           Rs1,42,812cr in 4QFY2009. The CASA ratio increased to 52% of total deposits
                                           during 4QFY2010, as against 44.4% as at 4QFY2009 and 51.7% as at 3QFY2010.
                                           On account of the higher growth in advances, the credit-deposit ratio of the bank
                                           improved to 76.0%, increasing by 680bp yoy. Consequently, NIMs improved to
                                           4.4% in 4QFY2010, as against 4.2% in 3QFY2010. The NIMs are expected to be
                                           impacted by 20bp in 1QFY2011E as the bank starts paying interest on savings
                                           balances on a daily basis.

                                           Exhibit 2: Trend in Quarterly Reported NIMs
                                                %
                                                4.5

                                                4.4

                                                4.3

                                                4.2

                                                4.1

                                                4.0
                                                                                                                                                               2QFY2010


                                                                                                                                                                             3QFY2010


                                                                                                                                                                                        4QFY2010
                                                      3QFY2008


                                                                  4QFY2008


                                                                                  1QFY2009


                                                                                                2QFY2009


                                                                                                                 3QFY2009


                                                                                                                                  4QFY2009


                                                                                                                                              1QFY2010


                                           Source: Company, Angel Research


April 23, 2010                                                                                                                                                                                     2
HDFC Bank I 4QFY2010 Result Update


                 Strong Capital adequacy and branch expansion to drive CASA and Credit
                 market share gains, respectively
                 The key positive from the results was the CASA deposit growth of 37.5% yoy and
                 8.9% sequentially, driven by a 30.9% yoy growth in Current deposits and a 42.9%
                 yoy growth in Savings deposits.

                 The strong traction in CASA growth is attributable to the bank’s aggressive branch
                 expansion during the year and to the increasing productivity of the branch network
                 of CBOP. The bank opened a substantial 313 branches and 937 ATMs during
                 FY2010, to take its branch network to 1,725 branches and 4,232 ATMs at the end
                 of FY2010 (incidentally, the cost-to-income ratio of the bank remained healthy
                 during FY2010 at 48%).

                 The bank plans to open another 150 branches during FY2011E. Against this
                 backdrop, we expect the bank to sustain a CASA ratio in the range of 49-52%,
                 going forward.

                 The Bank’s total Capital Adequacy (as per Basel-2 guidelines) remained strong at
                 17.4%, with Tier-I forming 75% of the total CAR. The bank has sufficient CAR to
                 grow its advances 5-8% above the industry growth over FY2010-12E.

                 Exhibit 3: Trend in CASA
                    %
                   60.0

                   55.0

                   50.0

                   45.0

                   40.0

                   35.0
                                                                                                         2QFY2010


                                                                                                                    3QFY2010


                                                                                                                               4QFY2010
                            3QFY2008


                                       4QFY2008


                                                  1QFY2009


                                                             2QFY2009


                                                                        3QFY2009


                                                                                   4QFY2009


                                                                                              1QFY2010


                 Source: Company, Angel Research


                 Robust Asset Quality

                 The asset quality of the bank improved sequentially, with Gross NPAs at 1.4% (1.6%
                 in 3QFY2010) and net NPAs at 0.3% (0.4% in 3QFY2010). The NPA coverage ratio
                 based on specific provisions was at 78.4% in 4QFY2010, as compared to 72.4% in
                 3QFY2010 and 68.4% in 4QFY2009. The total restructured assets were 0.3% of the
                 advances, which is among the lowest in the sector. The bank has witnessed a
                 reduction in slippages from the retail segment in the last couple of quarters.


April 23, 2010                                                                                                                            3
HDFC Bank I 4QFY2010 Result Update


                 Exhibit 4: Trend in Asset Quality

                    %                                                                                                                                                                                                                                             %
                    2.5                                                                                                                                                                                                                                          90

                    2.0                                                                                                                                                                                                                                          85
                                                                                                                                                                                                                                                                 80
                    1.5
                                                                                                                                                                                                                                                                 75
                    1.0
                                                                                                                                                                                                                                                                 70
                    0.5                                                                                                                                                                                                                                          65
                    0.0                                                                                                                                                                                                                                          60


                                 3QFY2008


                                                      4QFY2008


                                                                             1QFY2009


                                                                                                     2QFY2009


                                                                                                                          3QFY2009


                                                                                                                                                  4QFY2009


                                                                                                                                                                         1QFY2010


                                                                                                                                                                                               2QFY2010


                                                                                                                                                                                                                    3QFY2010


                                                                                                                                                                                                                                          4QFY2010
                                                            Gross NPA %                                                     Net NPA %                                                  NPA Coverage (RHS)
                 Source: Company, Angel Research


                 Non-interest Income declines

                 During 4QFY2010, the non-interest income stood at Rs904cr, down 18.9% yoy, due
                 to a treasury loss of Rs47cr in 4QFY2010 (treasury gains of Rs243cr in 4QFY2009)
                 and a muted fee income growth of 7.1% yoy. The Management attributed the muted
                 growth in fee income to the presence of one-offs in 4QFY2009 and lower
                 commission rates on third party products. Going forward, the management expects
                 higher volumes to compensate for low commission rates. Income from forex and
                 derivatives increased by a healthy 17.9% yoy to Rs180cr.

                 Outlook and Valuation

                 We believe that HDFC Bank is among the most competitive banks in the sector, with
                 an A-list management that has one of the best track records in the sector. At the
                 CMP, the stock is trading at 16.3x FY2012E EPS of Rs119.4 and 3.1x FY2012E ABV
                 of Rs632. We believe that HDFC Bank is once again positioned for a high qualitative
                 growth trajectory, with both the CASA and Cost-to-Income ratios returning to about
                 pre-CBoP levels. In our view, with its strong capital adequacy and substantial branch
                 expansion, the Bank is set to further gain CASA market share and achieve a strong
                 growth in fee income, as the economic environment continues to improve. We
                 maintain a Buy on the stock, with a Target Price of Rs2,220.

                 Exhibit 5: P/ABV Band – HDFC Bank

                         3,000

                         2,500

                         2,000
                  (Rs)


                         1,500

                         1,000

                          500

                            0
                                    Mar-02


                                                                 Apr-03
                                                                          Aug-03


                                                                                            Apr-04
                                                                                                       Aug-04


                                                                                                                         Apr-05
                                                                                                                                     Aug-05


                                                                                                                                                       Apr-06
                                                                                                                                                                Aug-06


                                                                                                                                                                                    Apr-07
                                                                                                                                                                                             Aug-07


                                                                                                                                                                                                               Apr-08
                                                                                                                                                                                                                        Aug-08


                                                                                                                                                                                                                                          Apr-09
                                                                                                                                                                                                                                                     Aug-09


                                                                                                                                                                                                                                                                       Apr-10
                                             Jul-02
                                                      Dec-02


                                                                                   Dec-03


                                                                                                                Dec-04


                                                                                                                                              Dec-05


                                                                                                                                                                         Dec-06


                                                                                                                                                                                                      Dec-07


                                                                                                                                                                                                                                 Dec-08


                                                                                                                                                                                                                                                              Dec-09


                                                        Price                                 2.00                                      2.75                                        3.50                                4.25                                  5.00
                 Source: Company, Angel Research


April 23, 2010                                                                                                                                                                                                                                                                  4
HDFC Bank I 4QFY2010 Result Update


                 Exhibit 6: P/E Band – HDFC Bank

                          3,400
                          3,200
                          3,000
                          2,800
                          2,600
                          2,400
                          2,200
                          2,000
                          1,800


                   (Rs)
                          1,600
                          1,400
                          1,200
                          1,000
                            800
                            600
                            400
                            200
                               0


                                    Apr-01


                                                                 Apr-02


                                                                                             Apr-03


                                                                                                                           Apr-04


                                                                                                                                                       Apr-05


                                                                                                                                                                                      Apr-06


                                                                                                                                                                                                                     Apr-07


                                                                                                                                                                                                                                                Apr-08


                                                                                                                                                                                                                                                                             Apr-09


                                                                                                                                                                                                                                                                                                          Apr-10
                                               Aug-01


                                                                          Aug-02


                                                                                                      Aug-03


                                                                                                                                    Aug-04


                                                                                                                                                                 Aug-05


                                                                                                                                                                                               Aug-06


                                                                                                                                                                                                                              Aug-07


                                                                                                                                                                                                                                                         Aug-08


                                                                                                                                                                                                                                                                                      Aug-09
                                                        Dec-01


                                                                                    Dec-02


                                                                                                               Dec-03


                                                                                                                                              Dec-04


                                                                                                                                                                             Dec-05


                                                                                                                                                                                                        Dec-06


                                                                                                                                                                                                                                       Dec-07


                                                                                                                                                                                                                                                                    Dec-08


                                                                                                                                                                                                                                                                                               Dec-09
                                                                                                                  Price                      15x                22x                   29x               36x


                 Source: Company, Angel Research

                 Exhibit 7: Premium/Discount to Sensex – HDFC Bank

                          90

                          70

                          50

                          30
                  (%)


                          10

                          (10)

                          (30)
                                                                             1-Dec-06


                                                                                                                                                                  1-Apr-08


                                                                                                                                                                                                                 1-Dec-08


                                                                                                                                                                                                                                                                                                    1-Apr-10
                                   31-Mar-06


                                                                                                                        1-Aug-07


                                                                                                                                                                                                                                                         1-Aug-09
                                                                                        Premium/Discount to Sensex                                                                                      Avg. Historical Premium


                 Source: Company, Angel Research


April 23, 2010                                                                                                                                                                                                                                                                                            5
HDFC Bank I 4QFY2010 Result Update

Income Statement (Rs cr)                                           Ratio Analysis
Y/E March                 FY2009   FY2010E   FY2011E    FY2012E    Y/E March                      FY2009   FY2010E   FY2011E   FY2012E

Net Interest Income        7,421     8,387    10,526     13,470    Profitability ratios (%)

YoY Growth (%)              42.0      13.0      25.5       28.0    NIMs                              4.9       4.3       4.4       4.5

Other Income               3,471     3,808     4,497      5,763    Cost to Income ratio             52.2      47.3      48.2      48.6
YoY Growth (%)              57.4       9.7      18.1       28.2    RoA                               1.4       1.5       1.6       1.7
Operating Income          10,892    12,194    15,023     19,233    RoE                              16.9      16.2      17.2      20.4
YoY Growth (%)              46.5      12.0      23.2       28.0
                                                                   B/S ratios (%)
Operating Expenses         5,685     5,765     7,243      9,354
                                                                   CASA ratio                       44.4      52.0      52.0      52.2
YoY Growth (%)              51.8       1.4      25.7       29.2
                                                                   Credit/Deposit ratio             69.2      76.0      74.2      73.6
Pre - Provision Profit     5,207     6,430     7,780      9,879
                                                                   CAR                              14.3      17.4      16.1      16.0
YoY Growth (%)              41.2      23.5      21.0       27.0
                                                                   - Tier I                          9.6      13.4      11.1       9.9
Prov. & Cont.              1,908     2,141     2,059      2,039
                                                                   Asset Quality (%)
YoY Growth (%)              35.6      12.2      (3.8)      (1.0)
                                                                   Gross NPAs                        2.0       1.3       1.0       0.8
Profit Before Tax          3,299     4,289     5,721      7,840
                                                                   Net NPAs                          0.6       0.3       0.2       0.2
YoY Growth (%)              44.6      30.0      33.4       37.0
                                                                   Slippages                         5.3       2.6       2.0       1.8
Prov. for Taxation         1,054     1,340     1,788      2,450
                                                                   NPA prov. / avg.
as a % of PBT               32.0      31.3      31.3       31.3                                      1.0       1.0       0.6       0.5
                                                                   assets
PAT                        2,245     2,949     3,933      5,390    Provision coverage               68.4      75.1      77.9      77.5

YoY Growth (%)              41.2      31.3      33.4       37.0    Per Share Data (Rs)

                                                                   EPS                              52.8      65.3      87.1     119.4

                                                                   ABVPS (75% Cover.)              350.8     473.4     540.0     631.9

                                                                   DPS                               8.5      12.0      17.5      23.5

                                                                   Valuation Ratios

Balance Sheet (Rs cr)                                              P/E (x)                          36.8      29.8      22.3      16.3
Y/E March                FY2009    FY2010E   FY2011E    FY2012E    P/ABVPS (x)                       5.5       4.1       3.6       3.1
Share Capital               425       452       452        452
                                                                   Dividend Yield                    0.4       0.6       0.9       1.2
Reserve & Surplus         14,627    20,925    23,933     28,082
                                                                   DuPont Analysis
Deposits                 142,812   167,404   212,603    267,880
                                                                   NII                               4.7       4.2       4.2       4.3
Growth (%)                  41.7      17.2      27.0       26.0
                                                                   (-) Prov. Exp.                    1.2       1.1       0.8       0.6
Borrowings                 2,686     6,608     8,392     10,574
Tier 2 Capital            16,474    16,474    22,076     29,802    Adj. NII                          3.5       3.1       3.4       3.6

Other Liab. & Prov.        6,246     8,405    12,285     15,684    Treasury                          0.3       0.2       0.0       0.0

Total Liabilities        183,271   220,268   279,741    352,474    Int. Sens. Inc.                   3.7       3.3       3.4       3.6

Cash balances             13,527     8,370    14,882     20,091    Other Inc.                        1.9       1.7       1.8       1.8
Bank balances              3,979     5,507     6,994      8,812    Op. Inc.                          5.7       5.0       5.2       5.4
Investments               58,818    69,471    87,869    111,044
                                                                   Opex                              3.6       2.9       2.9       3.0
Advances                  98,883   127,262   157,805    197,256
                                                                   PBT                               2.1       2.1       2.3       2.5
Growth (%)                  55.9      28.7      24.0       25.0
                                                                   Taxes                             0.7       0.7       0.7       0.8
Fixed Assets               1,707     1,949     2,401      2,934
                                                                   RoA                               1.4       1.5       1.6       1.7
Other Assets               6,357     7,709     9,791     12,337
Total Assets             183,271   220,268   279,741    352,474    Leverage                         11.9      11.1      10.9      11.9

Growth (%)                  37.6      20.2      27.0       26.0    RoE                              16.9      16.2      17.2      20.4


April 23, 2010                                                                                                                      6
HDFC Bank I 4QFY2010 Result Update


Research Team Tel: 4040 3800                                       E-mail: research@angeltrade.com                                       Website: www.angeltrade.com


DISCLAIMER

This document is solely for the personal information of the recipient, and must not be singularly used as the basis of any investment decision. Nothing in this
document should be construed as investment or financial advice. Each recipient of this document should make such investigations as they deem necessary to
arrive at an independent evaluation of an investment in the securities of the companies referred to in this document (including the merits and risks involved),
and should consult their own advisors to determine the merits and risks of such an investment.

Angel Securities Limited, its affiliates, directors, its proprietary trading and investment businesses may, from time to time, make investment decisions that are
inconsistent with or contradictory to the recommendations expressed herein. The views contained in this document are those of the analyst, and the company
may or may not subscribe to all the views expressed within.

Reports based on technical and derivative analysis center on studying charts of a stock's price movement, outstanding positions and trading volume, as
opposed to focusing on a company's fundamentals and, as such, may not match with a report on a company's fundamentals.

The information in this document has been printed on the basis of publicly available information, internal data and other reliable sources believed to be true,
and is for general guidance only. Angel Securities Limited has not independently verified all the information contained within this document. Accordingly, we
cannot testify, nor make any representation or warranty, express or implied, to the accuracy, contents or data contained within this document. While Angel
Securities Limited endeavours to update on a reasonable basis the information discussed in this material, there may be regulatory, compliance, or other
reasons that prevent us from doing so.

This document is being supplied to you solely for your information, and its contents, information or data may not be reproduced, redistributed or passed on,
directly or indirectly.

Angel Securities Limited and its affiliates may seek to provide or have engaged in providing corporate finance, investment banking or other advisory services
in a merger or specific transaction to the companies referred to in this report, as on the date of this report or in the past.

Neither Angel Securities Limited, nor its directors, employees or affiliates shall be liable for any loss or damage that may arise from or in connection with the
use of this information.
Note: Please refer to the important `Stock Holding Disclosure' report on the Angel website (Research Section).


 Disclosure of Interest Statement                                                         HDFC Bank
 1.    Analyst ownership of the stock                                                           No
 2.    Angel and its Group companies ownership of the stock                                     No
 3.    Angel and its Group companies’ Directors ownership of the stock                          No
 4.    Broking relationship with company covered                                                No
 Note: We have not considered any Exposure below Rs 1 lakh for Angel and its Group companies.


                                Address: Acme Plaza, ‘A’ Wing, 3rd Floor, M.V. Road, Opp. Sangam Cinema, Andheri (E), Mumbai - 400 059.
                                                                    Tel : (022) 3952 4568 / 4040 3800


    Angel Broking Ltd: BSE Sebi Regn No : INB 010996539 / CDSL Regn No: IN - DP - CDSL - 234 - 2004 / PMS Regn Code: PM/INP000001546 Angel Securities Ltd:BSE: INB010994639/INF010994639 NSE:
    INB230994635/INF230994635 Membership numbers: BSE 028/NSE:09946
    Angel Capital & Debt Market Ltd: INB 231279838 / NSE FNO: INF 231279838 / NSE Member code -12798 Angel Commodities Broking (P) Ltd: MCX Member ID: 12685 / FMC Regn No: MCX / TCM /
    CORP / 0037 NCDEX : Member ID 00220 / FMC Regn No: NCDEX / TCM / CORP / 0302


April 23, 2010                                                                                                                                                                              7

HDFC Bank Result Update

  • 1.
    4QFY2010 Result UpdateI Banking April 23, 2010 HDFC Bank BUY CMP Rs1944 Performance Highlights Target Price Rs2,220 HDFC Bank reported a Net Profit growth of 32.6% yoy to Rs837cr, in line with Investment Period 12 Months our estimates. Strong Business growth, improvement in Profitability and asset quality, coupled with a strong traction in CASA deposits, were the key positives Stock Info from the results. We maintain a Buy on the stock. Sector Banking Robust performance on all parameters: Advances registered a growth of Market Cap (Rs cr) 89,001 28.7% yoy to reach Rs1,27,262cr. Deposits reached Rs1,67,404cr in Beta 0.8 4QFY2010, up by 17.2% from Rs1,42,812cr in 4QFY2009. The CASA ratio increased to 52% of total deposits during 4QFY2010, as against 44.4% as at 52 WK High / Low 1986/1063 4QFY2009 and 51.7% as at 3QFY2010. On account of the higher growth in Avg. Daily Volume 174855 advances, the credit-deposit ratio of the bank improved to 76.0%, increasing by 680bp yoy. Consequently, NIMs improved to 4.4% in 4QFY2010, as Face Value (Rs) 10 against 4.2% in 3QFY2010. The asset quality of the bank improved BSE Sensex 17694 sequentially, with Gross NPAs at 1.4% (1.6% in 3QFY2010) and net NPAs at 0.3% (0.4% in 3QFY2010). The NPA coverage ratio based on specific Nifty 5,304 provisions was at 78.4% in 4QFY2010, as compared to 72.4% in 3QFY2010 and 68.4% in 4QFY2009. During 4QFY2010, non-interest income stood Reuters Code HDBK.BO Rs904cr, down 18.9% yoy due to a treasury loss of Rs47cr in 4QFY2010 Bloomberg Code HDFCB@IN (treasury gains of Rs243cr in 4QFY2009) and a muted fee income growth of 7.1% yoy. The Bank’s total Capital Adequacy (as per Basel-2 guidelines) Shareholding Pattern (%) remained strong at 17.4%, with Tier-I forming 75% of the total CAR. The bank Promoters 23.9 opened a substantial 313 branches and 937 ATMs during FY2010, to take its branch network to 1,725 branches and 4,232 ATMs at the end of FY2010. MF/Banks/Indian FIs 20.0 Outlook and Valuation: At the CMP, the stock is trading at 16.3x FY2012E FII/NRIs/OCBs 46.4 EPS of Rs119.4 and 3.1x FY2012E ABV of Rs632. We believe that HDFC Bank is once again positioned for a high qualitative growth trajectory, with both the Indian Public 9.7 CASA and Cost-to-Income ratios returning to about pre-CBoP levels. In our Abs (%) 3m 1yr 3yr view, with its strong capital adequacy and substantial branch expansion, the Bank is set to further gain CASA market share and achieve a strong growth in Sensex 4.9 58.9 27.0 fee income, as the economic environment continues to improve. We maintain a Buy on the stock, with a Target Price of Rs2,220. HDFCBK 62.5 78.0 96.9 Key Financials Y/E March (Rs cr) FY2009 FY2010 FY2011E FY2012E NII 7,421 8,387 10,526 13,470 % chg 42.0 13.0 25.5 28.0 Net Profit 2,245 2,949 3,933 5,390 % chg 41.2 31.3 33.4 37.0 NIM (%) 4.9 4.3 4.4 4.5 Vaibhav Agrawal EPS (Rs) 52.8 65.3 87.1 119.4 Tel: 022 – 4040 3800 Ext: 333 P/E (x) 36.8 29.8 22.3 16.3 E-mail: vaibhav.agrawal@angeltrade.com P/ABV (x) 5.5 4.1 3.6 3.1 RoA (%) 1.4 1.5 1.6 1.7 Amit Rane Tel: 022 – 4040 3800 Ext: 326 RoE (%) 16.9 16.2 17.2 20.4 E-mail: amitn.rane@angeltrade.com Source: Company, Angel Research 1 Please refer to important disclosures at the end of this report Sebi Registration No: INB 010996539
  • 2.
    HDFC Bank I4QFY2010 Result Update Exhibit 1: 4QFY2010 Performance Y/E March (Rs cr) 4QFY2010 3QFY2010 % chg 4QFY2009 % chg FY2010 FY2009 % chg Interest Earned 4,053 4,035 0.5 4,251 (4.7) 16,173 16,332 (1.0) Interest Expenses 1,702 1,811 (6.0) 2,399 (29.1) 7,786 8,911 (12.6) Net Interest Income 2,351 2,224 5.7 1,852 27.0 8,387 7,421 13.0 Non-Interest Income 904 853 5.9 1,115 (18.9) 3,808 3,291 15.7 Total Income 3,255 3,077 5.8 2,967 9.7 12,194 10,712 13.8 Operating Expenses 1,561 1,453 7.4 1,396 11.8 5,765 5,533 4.2 Pre-Prov Profit 1,694 1,624 4.4 1,571 7.9 6,430 5,179 24.1 Provisions & Cont. 440 448 (1.7) 657 (33.1) 2,141 1,880 13.9 PBT 1,254 1,176 6.7 913 37.4 4,289 3,299 30.0 Prov. for Taxes 418 357 16.9 282 48.0 1,340 1,054 27.1 PAT 837 819 2.2 631 32.6 2,949 2,245 31.3 EPS (Rs) 18.5 18.0 3.0 14.8 24.9 65.3 52.8 23.7 Cost to Income (%) 47.9 47.2 47.1 47.3 51.7 Effective Tax Rate (%) 33.3 30.4 30.9 31.3 32.0 Net NPA (%) 0.3 0.5 0.6 0.3 0.6 Source: Company, Angel Research Strong Business Growth with Profitability Advances registered a robust growth of 28.7% yoy and 6.4% qoq to reach Rs1,27,262cr. Deposits reached Rs1,67,404cr in 4QFY2010, up by 17.2% from Rs1,42,812cr in 4QFY2009. The CASA ratio increased to 52% of total deposits during 4QFY2010, as against 44.4% as at 4QFY2009 and 51.7% as at 3QFY2010. On account of the higher growth in advances, the credit-deposit ratio of the bank improved to 76.0%, increasing by 680bp yoy. Consequently, NIMs improved to 4.4% in 4QFY2010, as against 4.2% in 3QFY2010. The NIMs are expected to be impacted by 20bp in 1QFY2011E as the bank starts paying interest on savings balances on a daily basis. Exhibit 2: Trend in Quarterly Reported NIMs % 4.5 4.4 4.3 4.2 4.1 4.0 2QFY2010 3QFY2010 4QFY2010 3QFY2008 4QFY2008 1QFY2009 2QFY2009 3QFY2009 4QFY2009 1QFY2010 Source: Company, Angel Research April 23, 2010 2
  • 3.
    HDFC Bank I4QFY2010 Result Update Strong Capital adequacy and branch expansion to drive CASA and Credit market share gains, respectively The key positive from the results was the CASA deposit growth of 37.5% yoy and 8.9% sequentially, driven by a 30.9% yoy growth in Current deposits and a 42.9% yoy growth in Savings deposits. The strong traction in CASA growth is attributable to the bank’s aggressive branch expansion during the year and to the increasing productivity of the branch network of CBOP. The bank opened a substantial 313 branches and 937 ATMs during FY2010, to take its branch network to 1,725 branches and 4,232 ATMs at the end of FY2010 (incidentally, the cost-to-income ratio of the bank remained healthy during FY2010 at 48%). The bank plans to open another 150 branches during FY2011E. Against this backdrop, we expect the bank to sustain a CASA ratio in the range of 49-52%, going forward. The Bank’s total Capital Adequacy (as per Basel-2 guidelines) remained strong at 17.4%, with Tier-I forming 75% of the total CAR. The bank has sufficient CAR to grow its advances 5-8% above the industry growth over FY2010-12E. Exhibit 3: Trend in CASA % 60.0 55.0 50.0 45.0 40.0 35.0 2QFY2010 3QFY2010 4QFY2010 3QFY2008 4QFY2008 1QFY2009 2QFY2009 3QFY2009 4QFY2009 1QFY2010 Source: Company, Angel Research Robust Asset Quality The asset quality of the bank improved sequentially, with Gross NPAs at 1.4% (1.6% in 3QFY2010) and net NPAs at 0.3% (0.4% in 3QFY2010). The NPA coverage ratio based on specific provisions was at 78.4% in 4QFY2010, as compared to 72.4% in 3QFY2010 and 68.4% in 4QFY2009. The total restructured assets were 0.3% of the advances, which is among the lowest in the sector. The bank has witnessed a reduction in slippages from the retail segment in the last couple of quarters. April 23, 2010 3
  • 4.
    HDFC Bank I4QFY2010 Result Update Exhibit 4: Trend in Asset Quality % % 2.5 90 2.0 85 80 1.5 75 1.0 70 0.5 65 0.0 60 3QFY2008 4QFY2008 1QFY2009 2QFY2009 3QFY2009 4QFY2009 1QFY2010 2QFY2010 3QFY2010 4QFY2010 Gross NPA % Net NPA % NPA Coverage (RHS) Source: Company, Angel Research Non-interest Income declines During 4QFY2010, the non-interest income stood at Rs904cr, down 18.9% yoy, due to a treasury loss of Rs47cr in 4QFY2010 (treasury gains of Rs243cr in 4QFY2009) and a muted fee income growth of 7.1% yoy. The Management attributed the muted growth in fee income to the presence of one-offs in 4QFY2009 and lower commission rates on third party products. Going forward, the management expects higher volumes to compensate for low commission rates. Income from forex and derivatives increased by a healthy 17.9% yoy to Rs180cr. Outlook and Valuation We believe that HDFC Bank is among the most competitive banks in the sector, with an A-list management that has one of the best track records in the sector. At the CMP, the stock is trading at 16.3x FY2012E EPS of Rs119.4 and 3.1x FY2012E ABV of Rs632. We believe that HDFC Bank is once again positioned for a high qualitative growth trajectory, with both the CASA and Cost-to-Income ratios returning to about pre-CBoP levels. In our view, with its strong capital adequacy and substantial branch expansion, the Bank is set to further gain CASA market share and achieve a strong growth in fee income, as the economic environment continues to improve. We maintain a Buy on the stock, with a Target Price of Rs2,220. Exhibit 5: P/ABV Band – HDFC Bank 3,000 2,500 2,000 (Rs) 1,500 1,000 500 0 Mar-02 Apr-03 Aug-03 Apr-04 Aug-04 Apr-05 Aug-05 Apr-06 Aug-06 Apr-07 Aug-07 Apr-08 Aug-08 Apr-09 Aug-09 Apr-10 Jul-02 Dec-02 Dec-03 Dec-04 Dec-05 Dec-06 Dec-07 Dec-08 Dec-09 Price 2.00 2.75 3.50 4.25 5.00 Source: Company, Angel Research April 23, 2010 4
  • 5.
    HDFC Bank I4QFY2010 Result Update Exhibit 6: P/E Band – HDFC Bank 3,400 3,200 3,000 2,800 2,600 2,400 2,200 2,000 1,800 (Rs) 1,600 1,400 1,200 1,000 800 600 400 200 0 Apr-01 Apr-02 Apr-03 Apr-04 Apr-05 Apr-06 Apr-07 Apr-08 Apr-09 Apr-10 Aug-01 Aug-02 Aug-03 Aug-04 Aug-05 Aug-06 Aug-07 Aug-08 Aug-09 Dec-01 Dec-02 Dec-03 Dec-04 Dec-05 Dec-06 Dec-07 Dec-08 Dec-09 Price 15x 22x 29x 36x Source: Company, Angel Research Exhibit 7: Premium/Discount to Sensex – HDFC Bank 90 70 50 30 (%) 10 (10) (30) 1-Dec-06 1-Apr-08 1-Dec-08 1-Apr-10 31-Mar-06 1-Aug-07 1-Aug-09 Premium/Discount to Sensex Avg. Historical Premium Source: Company, Angel Research April 23, 2010 5
  • 6.
    HDFC Bank I4QFY2010 Result Update Income Statement (Rs cr) Ratio Analysis Y/E March FY2009 FY2010E FY2011E FY2012E Y/E March FY2009 FY2010E FY2011E FY2012E Net Interest Income 7,421 8,387 10,526 13,470 Profitability ratios (%) YoY Growth (%) 42.0 13.0 25.5 28.0 NIMs 4.9 4.3 4.4 4.5 Other Income 3,471 3,808 4,497 5,763 Cost to Income ratio 52.2 47.3 48.2 48.6 YoY Growth (%) 57.4 9.7 18.1 28.2 RoA 1.4 1.5 1.6 1.7 Operating Income 10,892 12,194 15,023 19,233 RoE 16.9 16.2 17.2 20.4 YoY Growth (%) 46.5 12.0 23.2 28.0 B/S ratios (%) Operating Expenses 5,685 5,765 7,243 9,354 CASA ratio 44.4 52.0 52.0 52.2 YoY Growth (%) 51.8 1.4 25.7 29.2 Credit/Deposit ratio 69.2 76.0 74.2 73.6 Pre - Provision Profit 5,207 6,430 7,780 9,879 CAR 14.3 17.4 16.1 16.0 YoY Growth (%) 41.2 23.5 21.0 27.0 - Tier I 9.6 13.4 11.1 9.9 Prov. & Cont. 1,908 2,141 2,059 2,039 Asset Quality (%) YoY Growth (%) 35.6 12.2 (3.8) (1.0) Gross NPAs 2.0 1.3 1.0 0.8 Profit Before Tax 3,299 4,289 5,721 7,840 Net NPAs 0.6 0.3 0.2 0.2 YoY Growth (%) 44.6 30.0 33.4 37.0 Slippages 5.3 2.6 2.0 1.8 Prov. for Taxation 1,054 1,340 1,788 2,450 NPA prov. / avg. as a % of PBT 32.0 31.3 31.3 31.3 1.0 1.0 0.6 0.5 assets PAT 2,245 2,949 3,933 5,390 Provision coverage 68.4 75.1 77.9 77.5 YoY Growth (%) 41.2 31.3 33.4 37.0 Per Share Data (Rs) EPS 52.8 65.3 87.1 119.4 ABVPS (75% Cover.) 350.8 473.4 540.0 631.9 DPS 8.5 12.0 17.5 23.5 Valuation Ratios Balance Sheet (Rs cr) P/E (x) 36.8 29.8 22.3 16.3 Y/E March FY2009 FY2010E FY2011E FY2012E P/ABVPS (x) 5.5 4.1 3.6 3.1 Share Capital 425 452 452 452 Dividend Yield 0.4 0.6 0.9 1.2 Reserve & Surplus 14,627 20,925 23,933 28,082 DuPont Analysis Deposits 142,812 167,404 212,603 267,880 NII 4.7 4.2 4.2 4.3 Growth (%) 41.7 17.2 27.0 26.0 (-) Prov. Exp. 1.2 1.1 0.8 0.6 Borrowings 2,686 6,608 8,392 10,574 Tier 2 Capital 16,474 16,474 22,076 29,802 Adj. NII 3.5 3.1 3.4 3.6 Other Liab. & Prov. 6,246 8,405 12,285 15,684 Treasury 0.3 0.2 0.0 0.0 Total Liabilities 183,271 220,268 279,741 352,474 Int. Sens. Inc. 3.7 3.3 3.4 3.6 Cash balances 13,527 8,370 14,882 20,091 Other Inc. 1.9 1.7 1.8 1.8 Bank balances 3,979 5,507 6,994 8,812 Op. Inc. 5.7 5.0 5.2 5.4 Investments 58,818 69,471 87,869 111,044 Opex 3.6 2.9 2.9 3.0 Advances 98,883 127,262 157,805 197,256 PBT 2.1 2.1 2.3 2.5 Growth (%) 55.9 28.7 24.0 25.0 Taxes 0.7 0.7 0.7 0.8 Fixed Assets 1,707 1,949 2,401 2,934 RoA 1.4 1.5 1.6 1.7 Other Assets 6,357 7,709 9,791 12,337 Total Assets 183,271 220,268 279,741 352,474 Leverage 11.9 11.1 10.9 11.9 Growth (%) 37.6 20.2 27.0 26.0 RoE 16.9 16.2 17.2 20.4 April 23, 2010 6
  • 7.
    HDFC Bank I4QFY2010 Result Update Research Team Tel: 4040 3800 E-mail: research@angeltrade.com Website: www.angeltrade.com DISCLAIMER This document is solely for the personal information of the recipient, and must not be singularly used as the basis of any investment decision. Nothing in this document should be construed as investment or financial advice. Each recipient of this document should make such investigations as they deem necessary to arrive at an independent evaluation of an investment in the securities of the companies referred to in this document (including the merits and risks involved), and should consult their own advisors to determine the merits and risks of such an investment. Angel Securities Limited, its affiliates, directors, its proprietary trading and investment businesses may, from time to time, make investment decisions that are inconsistent with or contradictory to the recommendations expressed herein. The views contained in this document are those of the analyst, and the company may or may not subscribe to all the views expressed within. Reports based on technical and derivative analysis center on studying charts of a stock's price movement, outstanding positions and trading volume, as opposed to focusing on a company's fundamentals and, as such, may not match with a report on a company's fundamentals. The information in this document has been printed on the basis of publicly available information, internal data and other reliable sources believed to be true, and is for general guidance only. Angel Securities Limited has not independently verified all the information contained within this document. Accordingly, we cannot testify, nor make any representation or warranty, express or implied, to the accuracy, contents or data contained within this document. While Angel Securities Limited endeavours to update on a reasonable basis the information discussed in this material, there may be regulatory, compliance, or other reasons that prevent us from doing so. This document is being supplied to you solely for your information, and its contents, information or data may not be reproduced, redistributed or passed on, directly or indirectly. Angel Securities Limited and its affiliates may seek to provide or have engaged in providing corporate finance, investment banking or other advisory services in a merger or specific transaction to the companies referred to in this report, as on the date of this report or in the past. Neither Angel Securities Limited, nor its directors, employees or affiliates shall be liable for any loss or damage that may arise from or in connection with the use of this information. Note: Please refer to the important `Stock Holding Disclosure' report on the Angel website (Research Section). Disclosure of Interest Statement HDFC Bank 1. Analyst ownership of the stock No 2. Angel and its Group companies ownership of the stock No 3. Angel and its Group companies’ Directors ownership of the stock No 4. Broking relationship with company covered No Note: We have not considered any Exposure below Rs 1 lakh for Angel and its Group companies. Address: Acme Plaza, ‘A’ Wing, 3rd Floor, M.V. Road, Opp. Sangam Cinema, Andheri (E), Mumbai - 400 059. Tel : (022) 3952 4568 / 4040 3800 Angel Broking Ltd: BSE Sebi Regn No : INB 010996539 / CDSL Regn No: IN - DP - CDSL - 234 - 2004 / PMS Regn Code: PM/INP000001546 Angel Securities Ltd:BSE: INB010994639/INF010994639 NSE: INB230994635/INF230994635 Membership numbers: BSE 028/NSE:09946 Angel Capital & Debt Market Ltd: INB 231279838 / NSE FNO: INF 231279838 / NSE Member code -12798 Angel Commodities Broking (P) Ltd: MCX Member ID: 12685 / FMC Regn No: MCX / TCM / CORP / 0037 NCDEX : Member ID 00220 / FMC Regn No: NCDEX / TCM / CORP / 0302 April 23, 2010 7