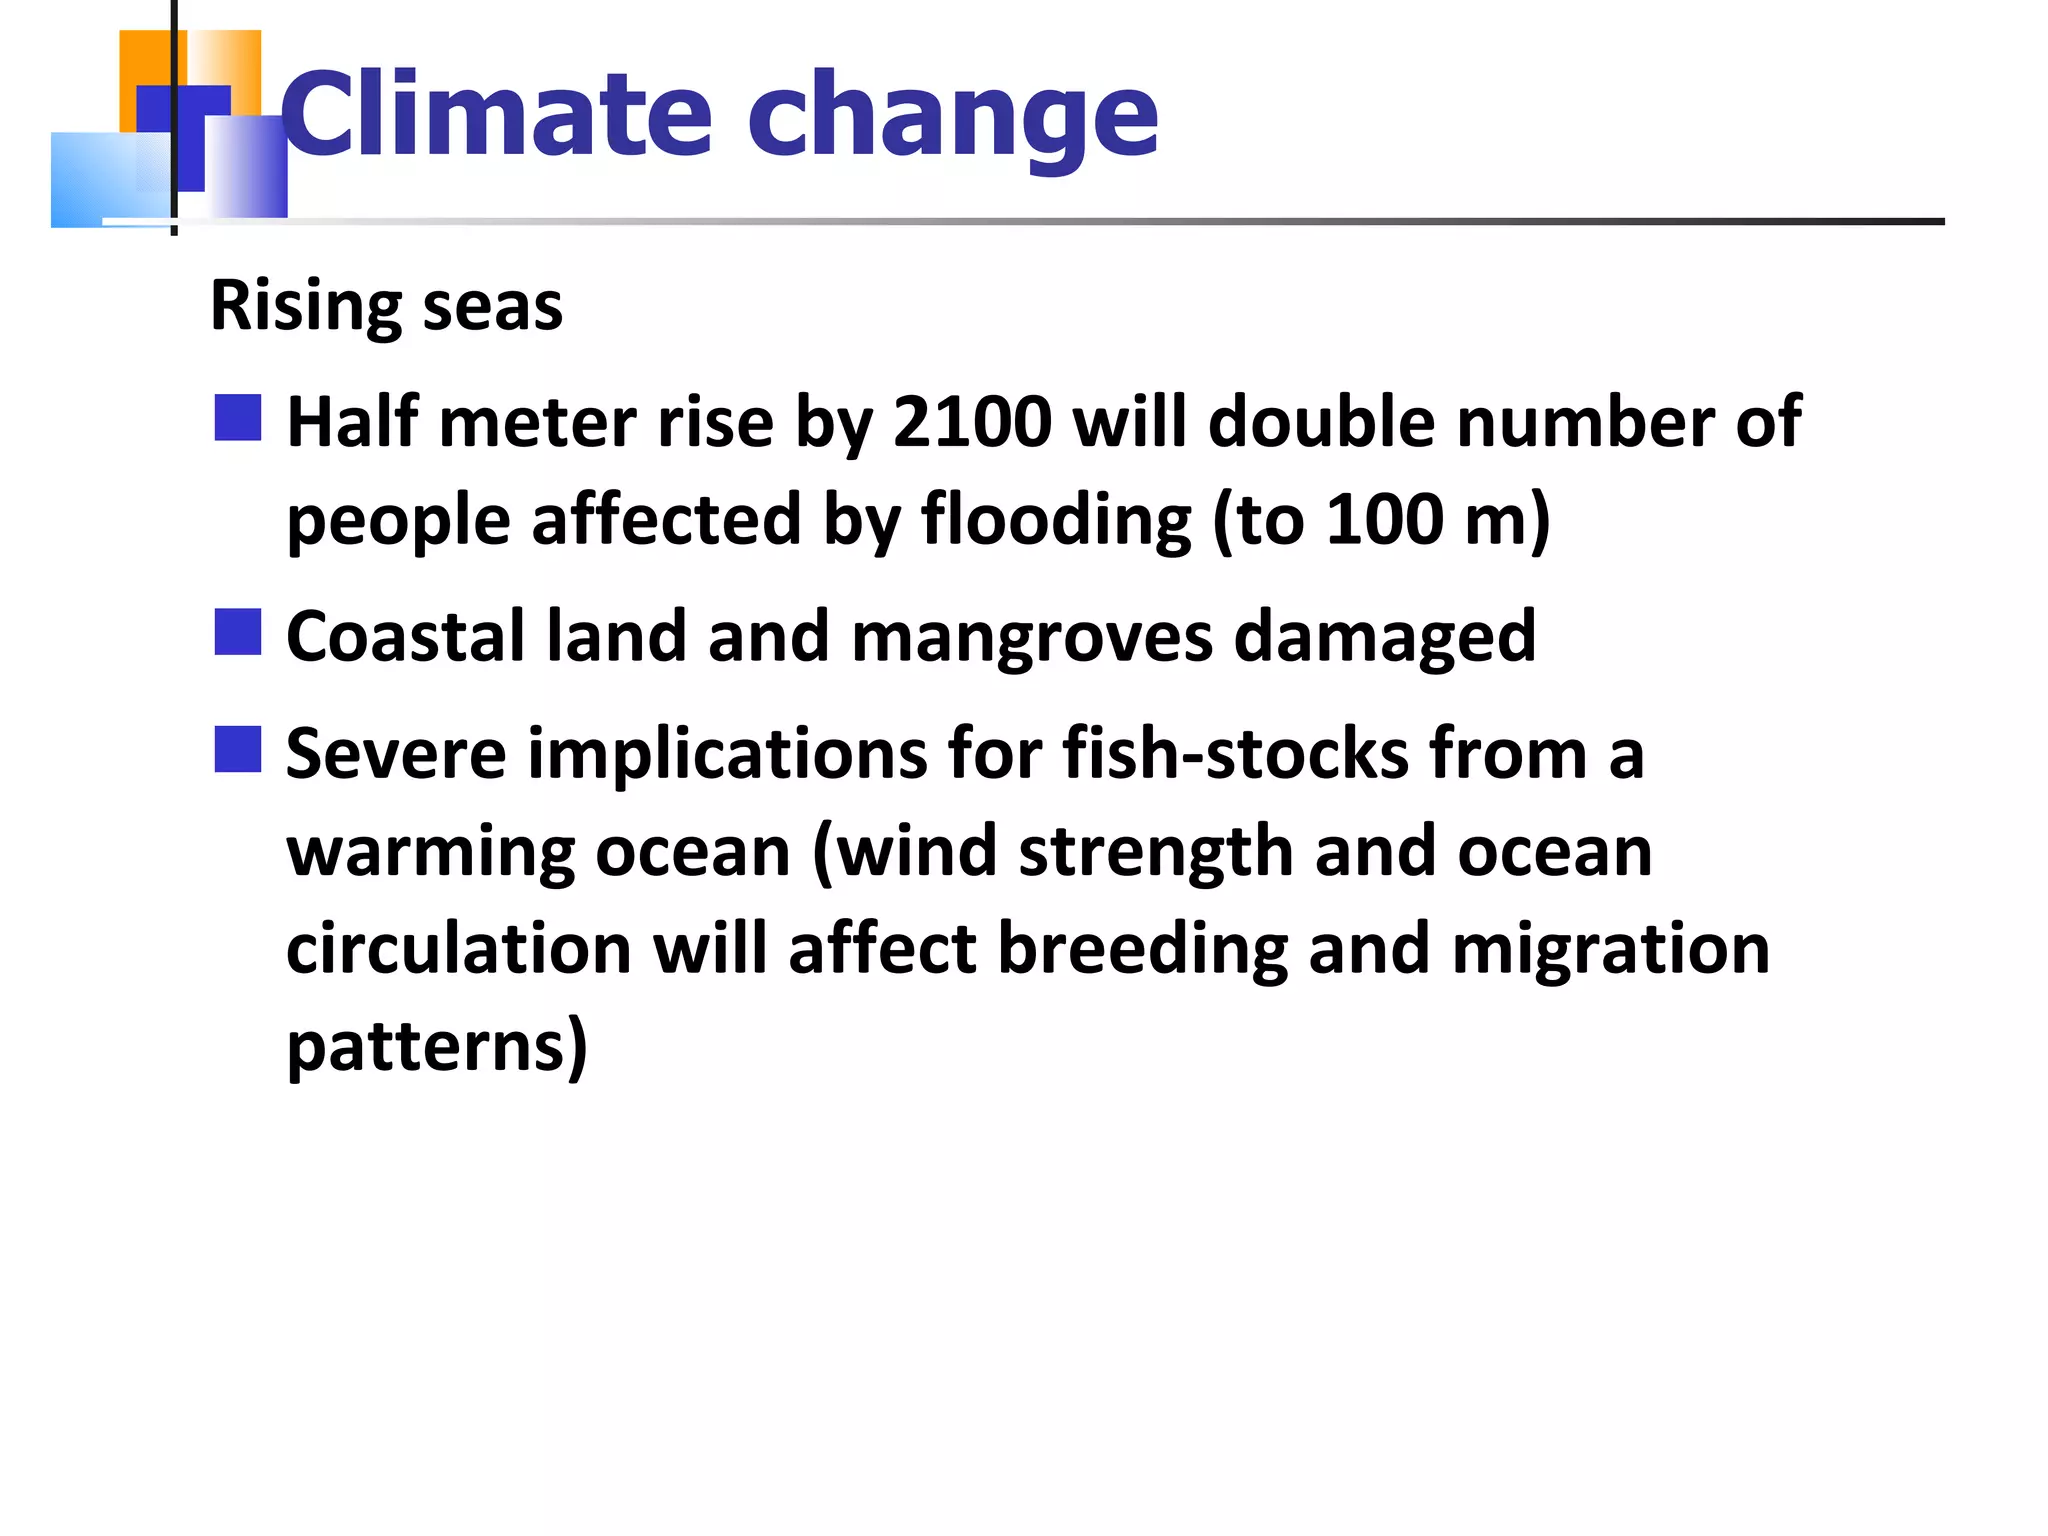
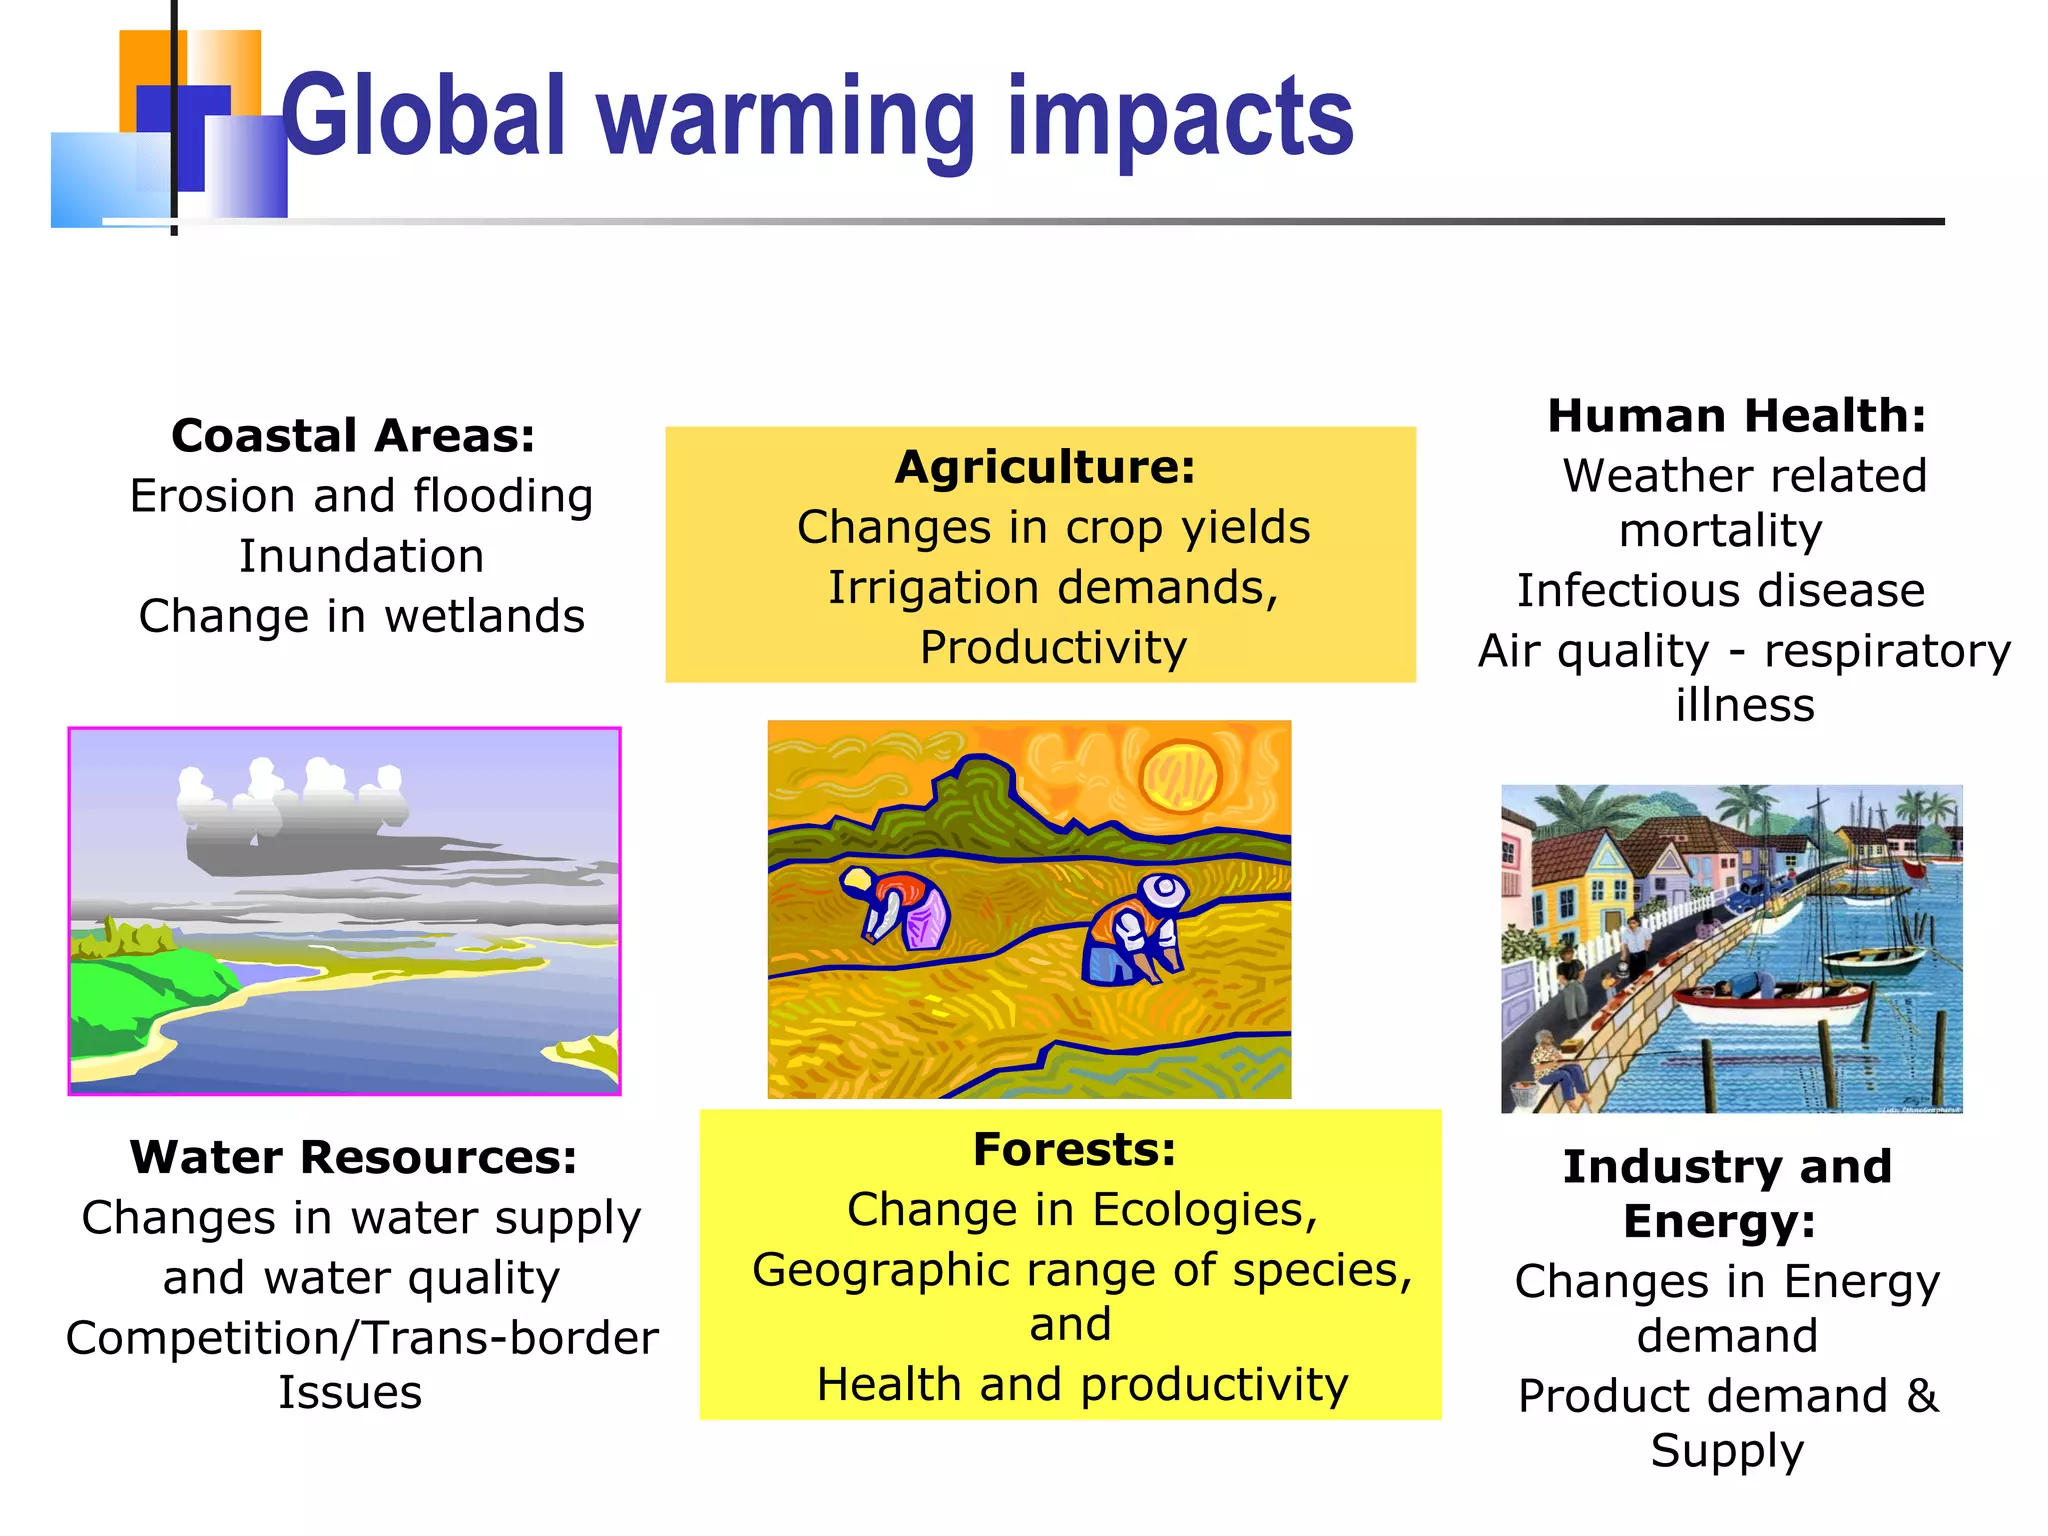
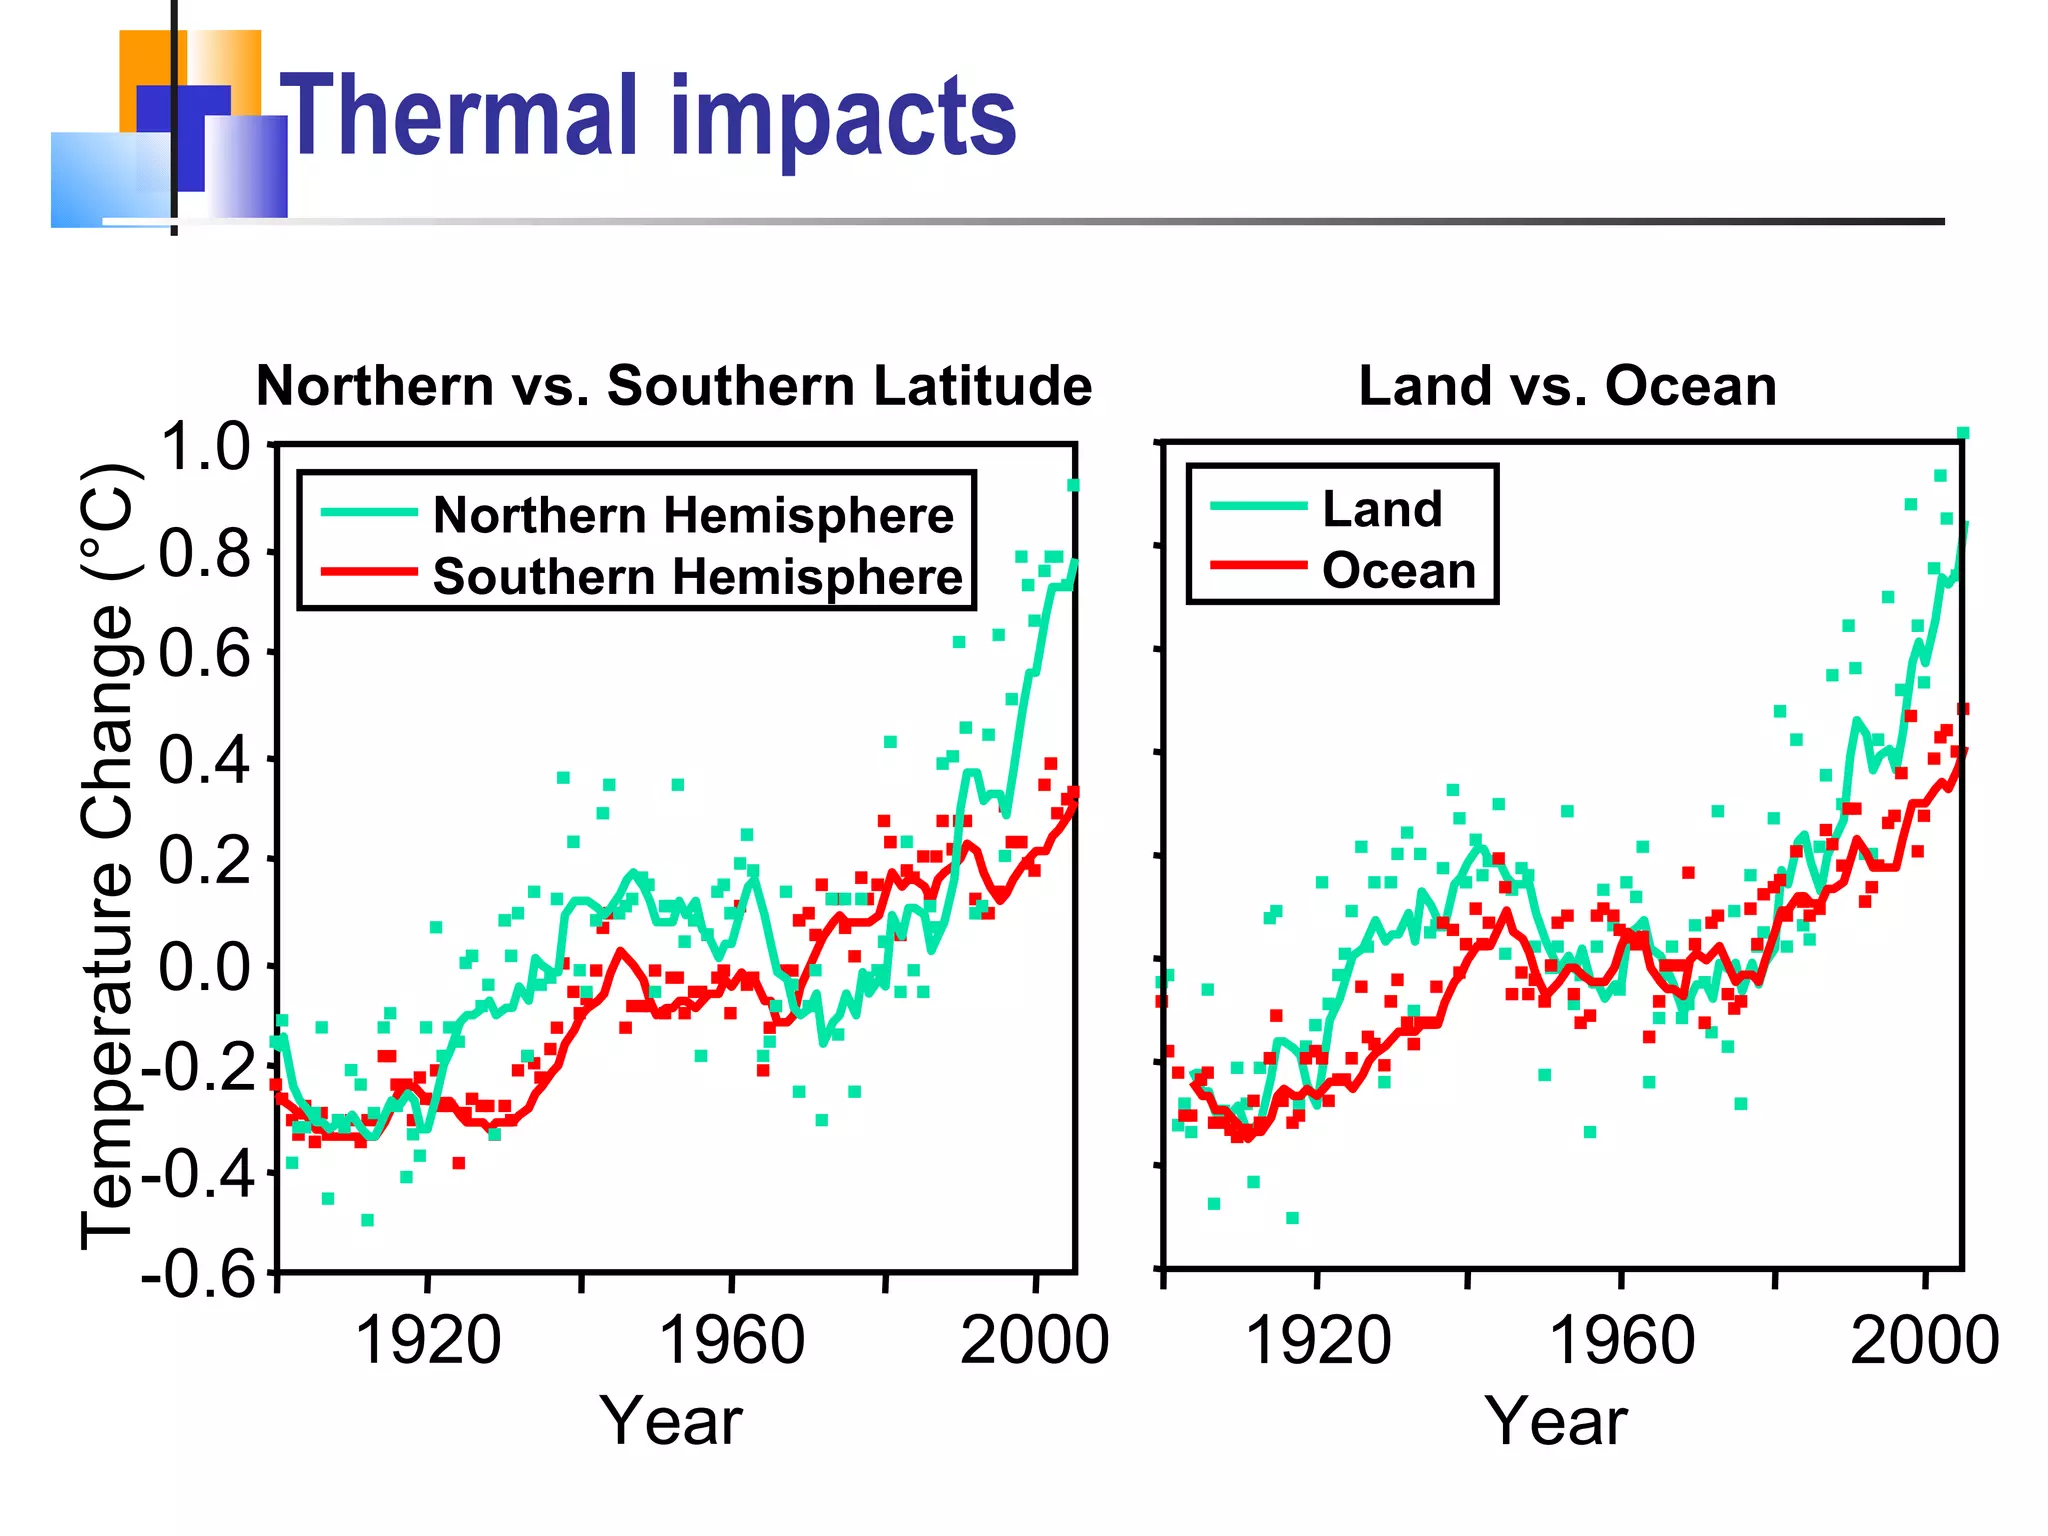
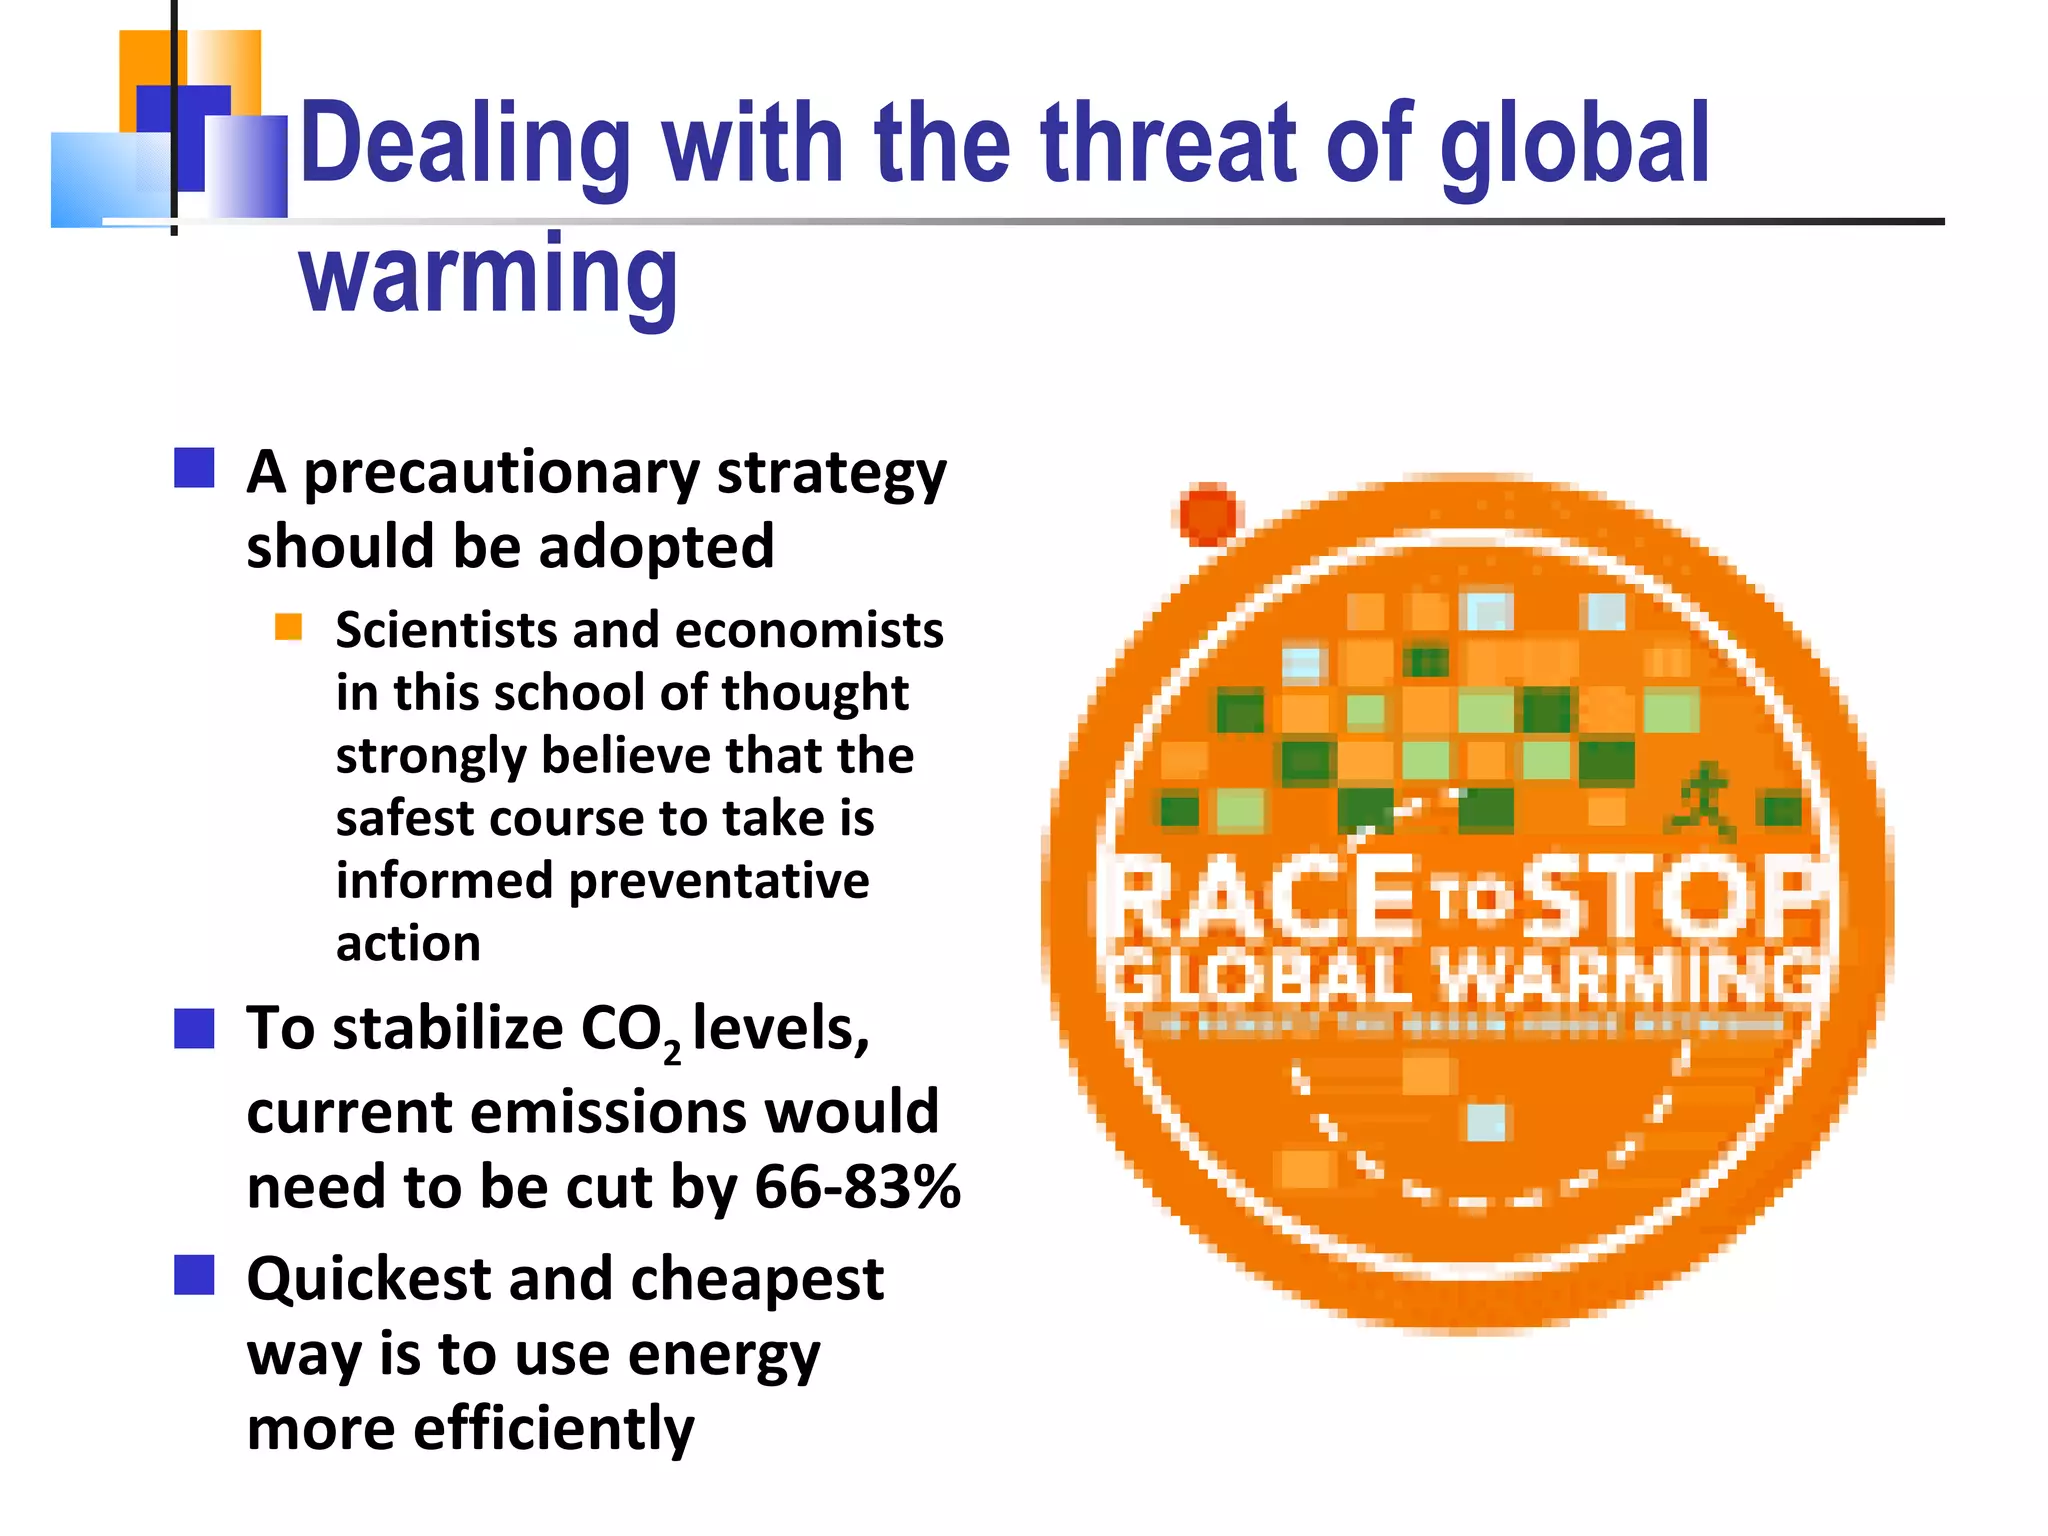
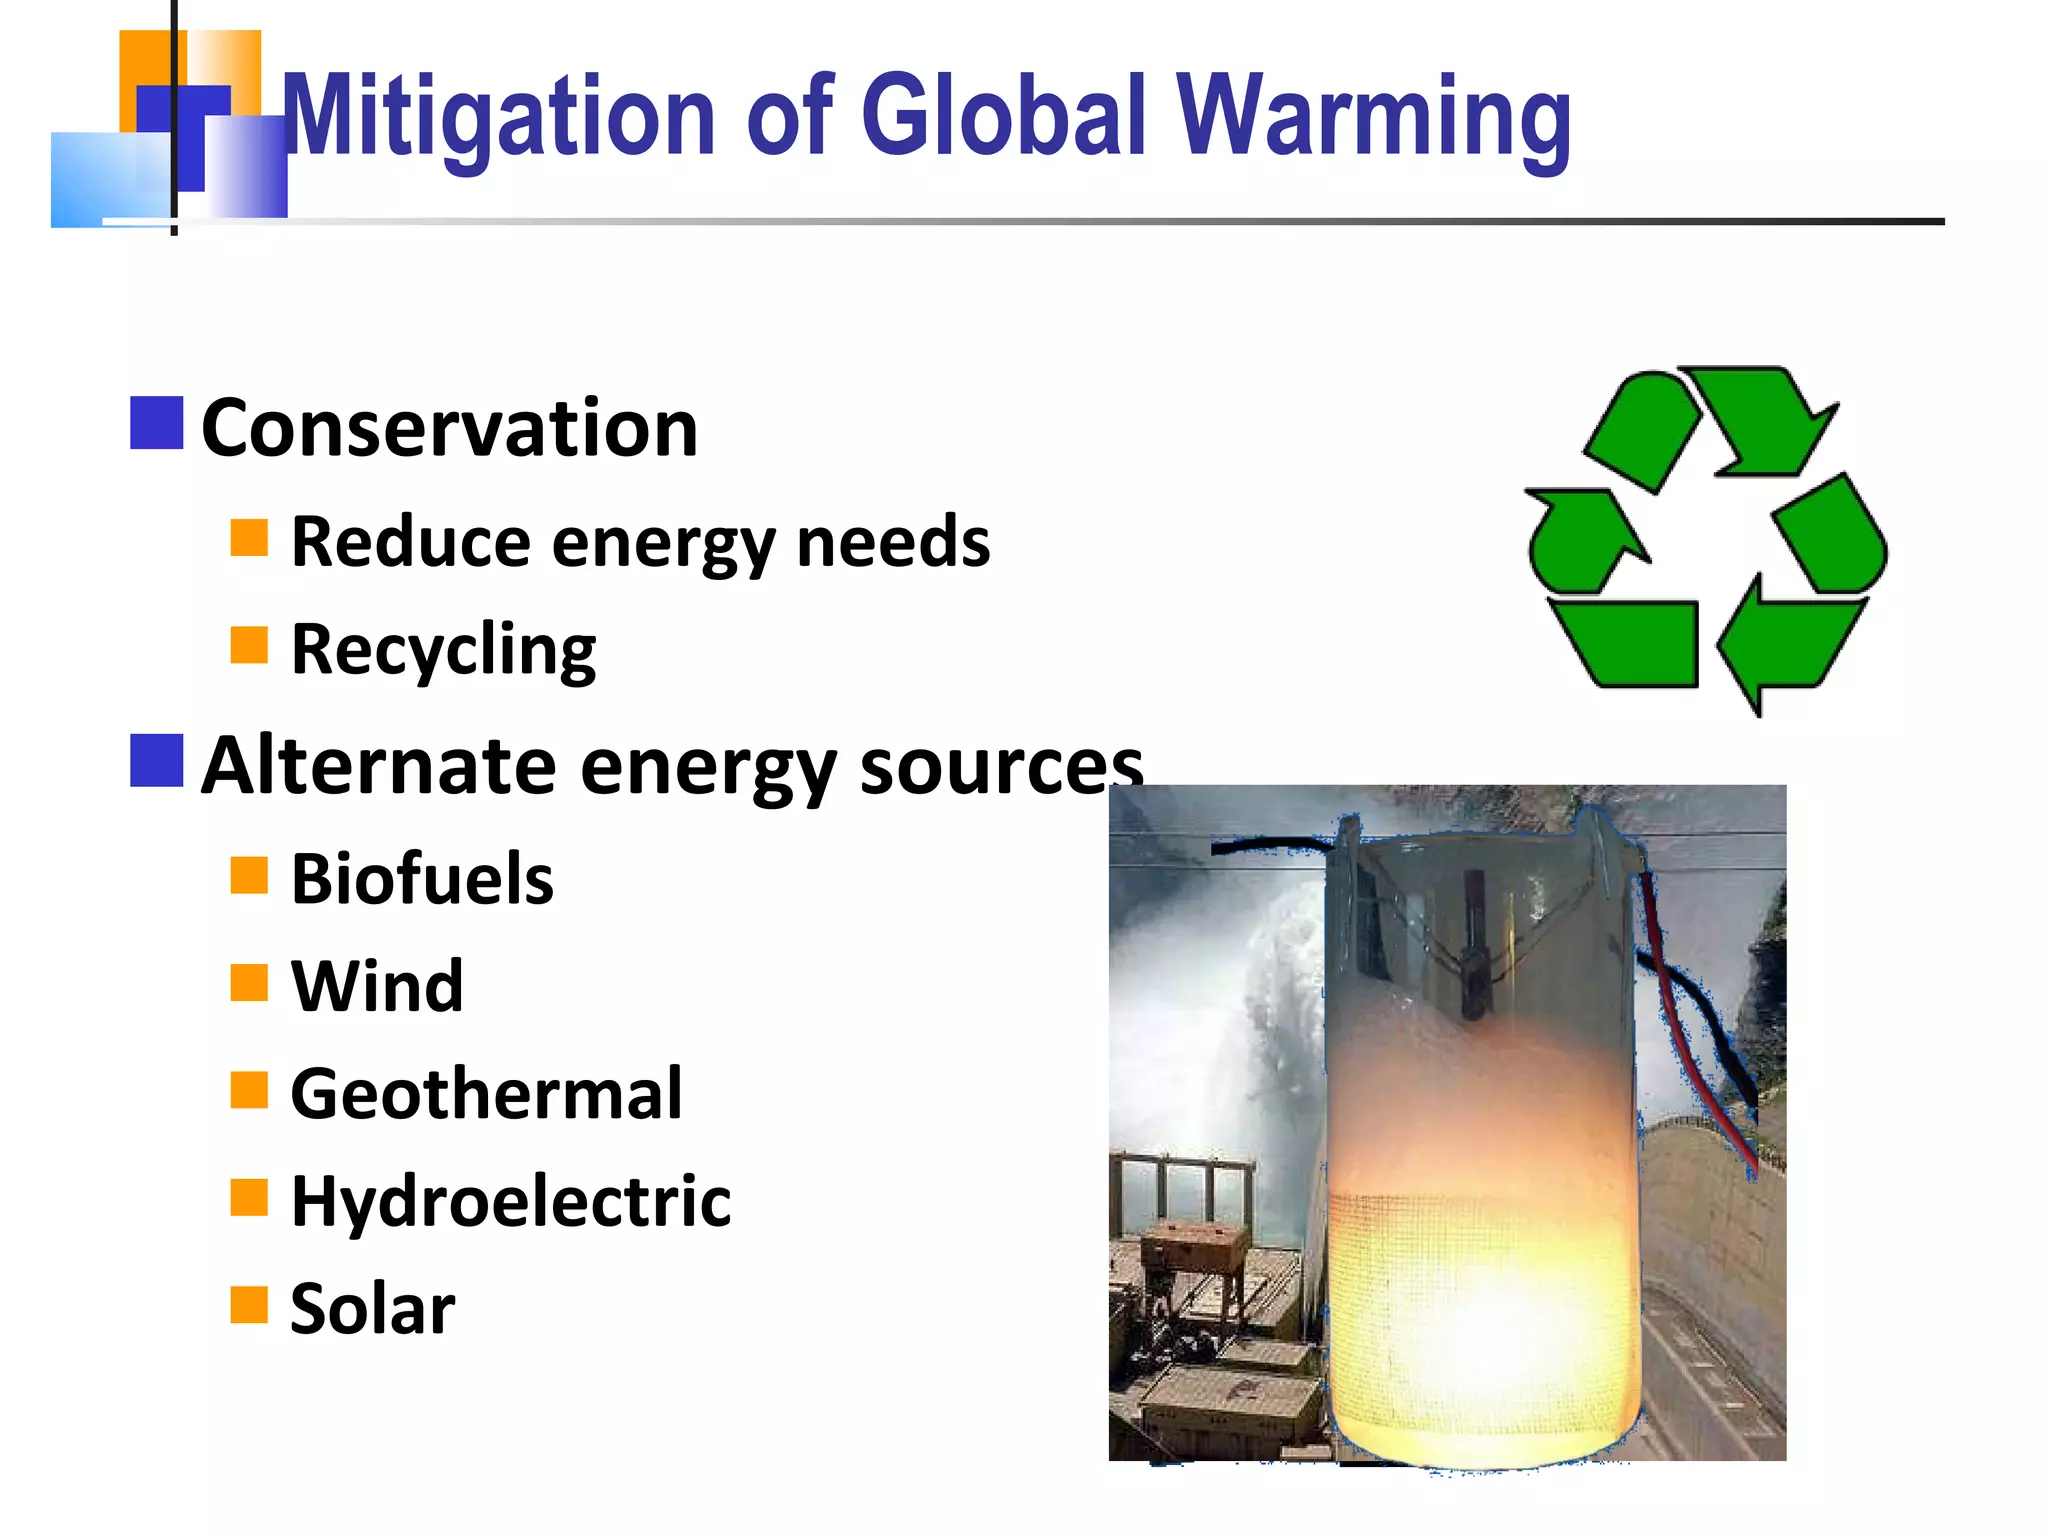
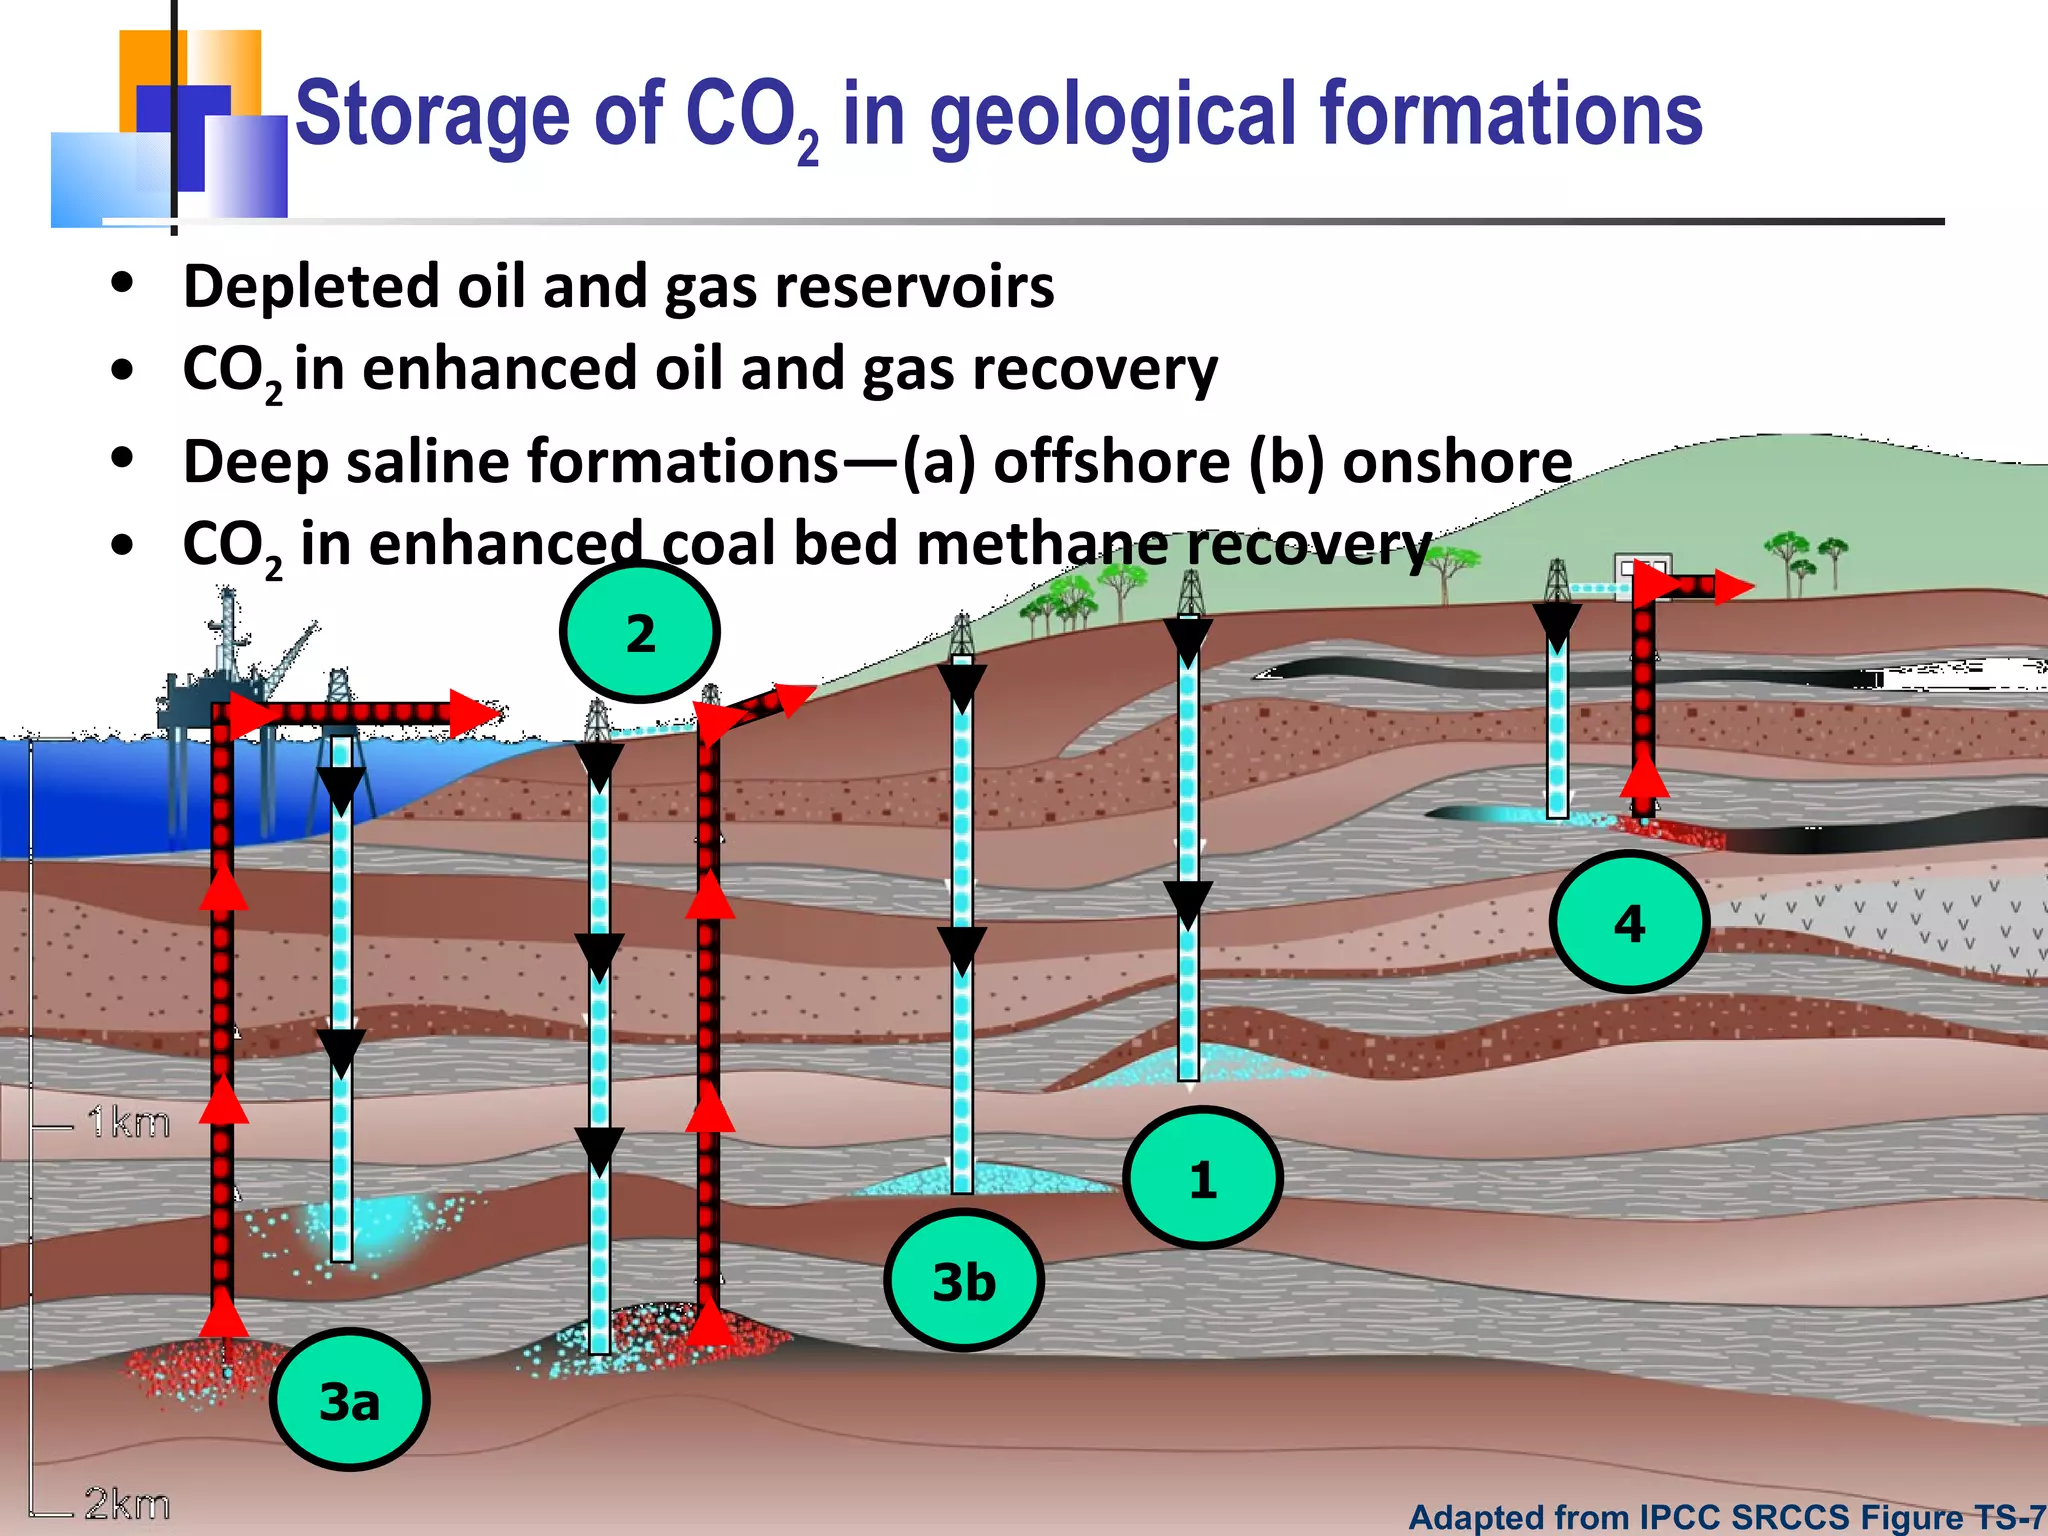
Presentation of Dr. Tolentino Moya, Professor, Institute of Environmental Science and Meteorology, University of the Philippines Diliman, during the UP Manila Conference on Global Climate Change, held October 22-23, 2009 at the Pearl Garden Hotel, Manila.
Plenary 2 - Social Impacts of Global Climate Changerbulalakaw
Presentation of Prof. Natividad Lacdan,
College of Arts and Sciences, University of the Philippines Manila, during the UP Manila Conference on Global Climate Change, held October 22-23, 2009 at the Pearl Garden Hotel, Manila.
Climate change, its impact on agriculture and mitigation strategiesVasu Dev Meena
According to IPCC (2007) “Climate change refers to a statistically significant variation in either the mean state of the climate or in its Variability, persisting for an extended period (typically decades or longer)”.
Climate change has adverse impacts on agriculture, hydropower, forest management and biodiversity.
In the long run, the climatic change could affect agriculture in several ways such as quantity and quality of crops in terms of productivity, growth rates, photosynthesis and transpiration rates, moisture availability etc.
Climate change directly affect food production across the globe.
Sustainability - What's wrong with a little climate change? Anders Lindgren
You may have heard about the dangers of “global warming and climate change”. It’s like old news. It hardly get you concerned. Well, there are some recent findings. Our Earth is getting warmer, wetter, wilder and more crowded than ever. It's scaring the hell out of scientists.
Global climate change is a change in the long-term weather patterns that characterize the regions of the world. The term "weather" refers to the short-term (daily) changes in temperature, wind, and/or precipitation of a region. In the long
run, the climatic change could affect agriculture in several ways such as quantity and quality of crops in terms of productivity, growth rates, photosynthesis and transpiration rates, moisture availability etc. Climate change is likely to directly impact food production across the globe. Increase in the mean seasonal
temperature can reduce the duration of many crops and hence reduce the yield. In areas where temperatures are already close to the physiological maxima for crops, warming will impact yields more immediately (IPCC, 2007). Drivers of climate
change through alterations in atmospheric composition can also influence food production directly by its impacts on plant physiology. The consequences of agriculture’s contribution to climate change, and of climate change’s negative impact on agriculture, are severe which is projected to have a great impact on food production and may threaten the food security and hence, require special agricultural measures to combat with.
CONTENTS:
1).INTRODUCTION
2).CLIMATE CHANGE
3).ENERGY EMERGENCY
4).WASTED WATER
5).PLASTIC PLIGHT
6).BIODIVERSITY IN A BIND
In this PPT we talk about various factors which would help us in making this world a better place to live and sustain.
Presentation delivered by Dr. Graham Farquhar (The Australian National University, Australia) at Borlaug Summit on Wheat for Food Security. March 25 - 28, 2014, Ciudad Obregon, Mexico.
http://www.borlaug100.org
Climate change effects and their implications on agriculture in uganda 12 oct...Dr. Joshua Zake
This paper was presented at National Climate Change Dialogue organized by PELUM-Uganda, 19th October 2012, Hotel Africana, Kampala Uganda. The theme of the dialogue was, 'National Climate Change Policy and its responsiveness to Small Holder Farmers.'
Agriculture and fisheries are highly dependent on specific climate conditions. Trying to understand the overall effect of climate change on our food supply can be difficult. Increases in temperature and carbon dioxide (CO2) can be beneficial for some crops in some places. But to realize these benefits, nutrient levels, soil moisture, water availability, and other conditions must also be met. Changes in the frequency and severity of droughts and floods could pose challenges for farmers and ranchers. Meanwhile, warmer water temperatures are likely to cause the habitat ranges of many fish and shellfish species to shift, which could disrupt ecosystems. Overall, climate change could make it more difficult to grow crops, raise animals, and catch fish in the same ways and same places as we have done in the past. The effects of climate change also need to be considered along with other evolving factors that affect agricultural production, such as changes in farming practices and technology.
American Journal of Multidisciplinary Research and Development is indexed, refereed and peer-reviewed journal, which is designed to publish research articles.
Climate change effect on agricultural sectorAtif Nawaz
Climate change effect badly all kinds of species from last decade. and its going to very keen issue.
its a responsibility of all humanity to care about all issues regarding to climate change.
Presented by Kofi Bimpong, with inputs from Boubacar Maneh, Sander Zwart, Koichi Futakuchi and Takashi Kumashiro at the CCAFS Workshop on Developing Climate-Smart Crops for a 2030 World, ILRI, Addis Ababa, Ethiopia, 6-8 December 2011.
Impact of climatic change on agricultureShashi Singh
Climate change and agriculture are interrelated processes, both of which take place on a global scale. Climate change affects agriculture in a number of ways, including through changes in average temperatures, rainfall, and climate extremes (e.g., heat waves); changes in pests and diseases; changes in atmospheric carbon dioxide and ground-level ozone concentrations; changes in the nutritional quality of some foods; and changes in sea level.
For Climate Change Workshop by British Computer Society on 17-Sep-08.
Physics & Chemistry of Climate Change,
Effects and Costs of Climate Change,
Geographical Information and use of it,
Some International Meetings and Local Authority Measures,
Climate Change Bill 2008,
Carbon trading / offsetting,
Reducing Carbon Emissions – Websites & Actions.
Public lecture to the Australian Academy of Science in the wonderful Shine Dome in Canberra on 4 November 2009. A big picture look at the policy and science integration challenges across water, energy, carbon, food and health against a background of climate chaos and a looming oil crunch.
Global Warming is one of the biggest global problem.It is affecting us and the environment day by day.
The Presesentation consists of the causes of global warming, the effects and then finally will tell you the solutions of it so that we can save the earth and the environment.
Similar to Plenary 1 - The Science of Climate Change (20)
Shopping List of Issues and Concerns on Climate Changerbulalakaw
Listing of issues and concerns on developing action programs regarding climate change, from four sectors: academe, national government agencies, local government units, and NGO/PO/Civil Societies
Plenary 4 - Local and International Policy on Climate Changerbulalakaw
Presentation of Prof. Francis Ross de Guzman, College of Arts and Sciences, University of the Philippines Manila, during the UP Manila Conference on Global Climate Change, held October 22-23, 2009 at the Pearl Garden Hotel, Manila.
Presentation of Dr. Lydia Leonardo, College of Public Health, UP Manila, on "Impacts of Climate Change to Health," during the UP Manila Conference on Global Climate Change, held October 22-23, 2009 at the Pearl Garden Hotel, Manila.
Presentation of Dr. Helen Mendoza, Philippine Network for Climaet Change, on "Advocacy" during the UP Manila Conference on Global Climate Change, October 22-23, 2009, Pearl Garden Hotel, Manila.
Presentation of Atty. Fermin Nestor Gadrinab, Supreme Court, on "Green Courts" during the UP Manila Conference on Global Climate Change, October 22-23, 2009, Pearl Garden Hotel, Manila.
Presentation of Dr. Raymond Tan, DLSU, on "Sustainable Consumption and Sustainable Production" during the UP Manila Conference on Global Climate Change, October 22-23, 2009, Pearl Garden Hotel, Manila.
Presentation of Dr. Tonie Balangue, President and Executive Director
Resources, Environmental and Economic Center for Studies, Inc., on "Green Accounting" during the UP Manila Conference on Global Climate Change, October 22-23, 2009, Pearl Garden Hotel, Manila.
Read| The latest issue of The Challenger is here! We are thrilled to announce that our school paper has qualified for the NATIONAL SCHOOLS PRESS CONFERENCE (NSPC) 2024. Thank you for your unwavering support and trust. Dive into the stories that made us stand out!
Operation “Blue Star” is the only event in the history of Independent India where the state went into war with its own people. Even after about 40 years it is not clear if it was culmination of states anger over people of the region, a political game of power or start of dictatorial chapter in the democratic setup.
The people of Punjab felt alienated from main stream due to denial of their just demands during a long democratic struggle since independence. As it happen all over the word, it led to militant struggle with great loss of lives of military, police and civilian personnel. Killing of Indira Gandhi and massacre of innocent Sikhs in Delhi and other India cities was also associated with this movement.
How to Make a Field invisible in Odoo 17Celine George
It is possible to hide or invisible some fields in odoo. Commonly using “invisible” attribute in the field definition to invisible the fields. This slide will show how to make a field invisible in odoo 17.
How to Create Map Views in the Odoo 17 ERPCeline George
The map views are useful for providing a geographical representation of data. They allow users to visualize and analyze the data in a more intuitive manner.
This is a presentation by Dada Robert in a Your Skill Boost masterclass organised by the Excellence Foundation for South Sudan (EFSS) on Saturday, the 25th and Sunday, the 26th of May 2024.
He discussed the concept of quality improvement, emphasizing its applicability to various aspects of life, including personal, project, and program improvements. He defined quality as doing the right thing at the right time in the right way to achieve the best possible results and discussed the concept of the "gap" between what we know and what we do, and how this gap represents the areas we need to improve. He explained the scientific approach to quality improvement, which involves systematic performance analysis, testing and learning, and implementing change ideas. He also highlighted the importance of client focus and a team approach to quality improvement.
The Art Pastor's Guide to Sabbath | Steve ThomasonSteve Thomason
What is the purpose of the Sabbath Law in the Torah. It is interesting to compare how the context of the law shifts from Exodus to Deuteronomy. Who gets to rest, and why?
Instructions for Submissions thorugh G- Classroom.pptxJheel Barad
This presentation provides a briefing on how to upload submissions and documents in Google Classroom. It was prepared as part of an orientation for new Sainik School in-service teacher trainees. As a training officer, my goal is to ensure that you are comfortable and proficient with this essential tool for managing assignments and fostering student engagement.
We all have good and bad thoughts from time to time and situation to situation. We are bombarded daily with spiraling thoughts(both negative and positive) creating all-consuming feel , making us difficult to manage with associated suffering. Good thoughts are like our Mob Signal (Positive thought) amidst noise(negative thought) in the atmosphere. Negative thoughts like noise outweigh positive thoughts. These thoughts often create unwanted confusion, trouble, stress and frustration in our mind as well as chaos in our physical world. Negative thoughts are also known as “distorted thinking”.
Model Attribute Check Company Auto PropertyCeline George
In Odoo, the multi-company feature allows you to manage multiple companies within a single Odoo database instance. Each company can have its own configurations while still sharing common resources such as products, customers, and suppliers.
2024.06.01 Introducing a competency framework for languag learning materials ...Sandy Millin
http://sandymillin.wordpress.com/iateflwebinar2024
Published classroom materials form the basis of syllabuses, drive teacher professional development, and have a potentially huge influence on learners, teachers and education systems. All teachers also create their own materials, whether a few sentences on a blackboard, a highly-structured fully-realised online course, or anything in between. Despite this, the knowledge and skills needed to create effective language learning materials are rarely part of teacher training, and are mostly learnt by trial and error.
Knowledge and skills frameworks, generally called competency frameworks, for ELT teachers, trainers and managers have existed for a few years now. However, until I created one for my MA dissertation, there wasn’t one drawing together what we need to know and do to be able to effectively produce language learning materials.
This webinar will introduce you to my framework, highlighting the key competencies I identified from my research. It will also show how anybody involved in language teaching (any language, not just English!), teacher training, managing schools or developing language learning materials can benefit from using the framework.
2024.06.01 Introducing a competency framework for languag learning materials ...
Plenary 1 - The Science of Climate Change
1. Living with Global Warming Tolentino B. Moya, Ph D Institute of Environmental Science and Meteorology College of Science, University of the Philippines Diliman, Quezon City
38. Vulnerability information systems El Ni ñ o - La Ni ñ a Vulnerability Map Support for Greenhouse Gas Inventory www.sc.chula.ac.th/courseware/2303105/BBAPart4_2n. ppt
40. Global warming impacts Agriculture: Changes in crop yields Irrigation demands, Productivity Forests: Change in Ecologies, Geographic range of species, and Health and productivity Coastal Areas: Erosion and flooding Inundation Change in wetlands Water Resources: Changes in water supply and water quality Competition/Trans-border Issues Human Health: Weather related mortality Infectious disease Air quality - respiratory illness Industry and Energy: Changes in Energy demand Product demand & Supply
41.
42. Thermal impacts -0.6 -0.4 -0.2 0.0 0.2 0.4 0.6 0.8 1.0 1920 1960 2000 Year Temperature Change (°C) 1920 1960 2000 Year Northern vs. Southern Latitude Land vs. Ocean Northern Hemisphere Southern Hemisphere Land Ocean
52. Cost to stabilize CO 2 concentrations 450 550 650 750 1800 1600 1400 1200 1000 800 600 400 200 0 Carbon Dioxide (ppm) Cost (Trillons U.S. Dollars)
53.
54.
55.
56.
57.
58.
59.
60. … A sustainable future … A sustainable future The best way to predict the future is to invent it. Alan Kay (Inventor of OS for Apple Computers) Maraming Salamat Po Magandang Araw
Editor's Notes
There’s no issue that’s as hotly contested and debated in science, politics, and on the street as global warming. But, all scientists, researchers, academicians, skeptics, deniers, people on the street all agree that the Earth, our very own Planet is warming… The global average surface temperature has indeed increased, on the one hand, as a consequence anthropogenic emissions acc to global warming believers and champions. On the other hand, g lobal warming skeptics emphasized research indicating that a significant part of the 20 th -century temperature change is due to solar activity influence. Specifically, an increase of 1 o C in a period of 100 To 200 years would be considered global warming. Over the course of a single century, even 0.4 o C Would be considered significant. FAQ 3.1, Figure 1. (Top) Annual global mean observed temperatures 1 (black dots) along with simple fits to the data. The left hand axis shows anomalies relative to the 1961 to 1990 average and the right hand axis shows the estimated actual temperature (°C). Linear trend fits to the last 25 (yellow), 50 (orange), 100 (purple) and 150 years (red) are shown, and correspond to 1981 to 2005, 1956 to 2005, 1906 to 2005, and 1856 to 2005, respectively. Note that for shorter recent periods, the slope is greater, Indicating accelerated warming. The blue curve is a smoothed depiction to capture the decadal variations. To give an idea of whether the fluctuations are meaningful, decadal 5% to 95% (light grey) error ranges about that line are given (accordingly, annual values do exceed those limits). Results from climate models driven by estimated radiative forcings for the 20th century (Chapter 9) suggest that there was little change prior to about 1915, and that a substantial fraction of the early 20th-century change was contributed by naturally occurring influences including solar radiation changes, volcanism and natural variability. From about 1940 to 1970 the increasing industrialisation following World War II increased pollution in the Northern Hemisphere, contributing to cooling, and increases in carbon dioxide and other greenhouse gases dominate the observed warming after the mid-1970s. 1 From the HadCRUT3 data set.
However, given the increasing concentration of GHGs in the atmosphere, earth’s surface temperature is predicted to rise up to 7 o C. For instance, these figures show the variation in CO 2 and temperature during both the 400,000 years. The rise and fall in temperature correlates very well with the increase and decrease of CO 2 concentration in the atmosphere. Despite the high correlation, GHG skeptics emphasized that temperature increase/decrease trail or lag behind the recorded increase/decrease in CO 2 concentration. they found an opportunity to jump onto climate scientists’ claim that what the Earth is going through now is GHG-INDUCED GLOBAL WARMING; some even calling them global warming swindler My own analysis is that this temperature behavior inhere from the TIME LAG characteristic of a dynamic system, like the climate system Increased GHG concentration in the atmosphere, via increased temperature, could disrupt and the climate system and bring about surprises. Climate scientists and researchers input these measured data (temperature and CO2 concentrations) as forcings into climate models first to find out whether they can pospdict historical temperature. Good model performance, allowed them to predict future climate scenarios.
The impacts of global change are not likely to be distributed evenly throughout the world. For instance, the following graph of the world shows that estimates of temperature and precipitation changes very in different parts of the world. Some areas (primarily in the northern latitudes) will experience increased precipitation, whereas other areas will experience decreased precipitation.
Figure TS.18. Annual averages of the global mean sea level based on reconstructed sea level fields since 1870 (red), tide gauge measurements since 1950 (blue) and satellite a ltimetry since 1992 (black). Units are in mm relative to the average for 1961 to 1990. Error bars are 90% confidence intervals. {Figure 5.13} Present rate is 1.8 ± 0.3 mm/yr (7.4 in/century) Accelerating at a rate of 0.013 ± 0.006 mm/yr 2 If acceleration continues, could result in 12 in/century sea level rise Scenarios claiming 1 meter or more rise are unrealistic Thermal expansion of oceans Mountain glaciers melting Melting of Greenland and Antarctic ice sheets All Greenland = 7m All Antarctica = 60-70m Just WAIS = 5-6m
FAQ 5.1, Figure 1. Time series of global mean sea level (deviation from the 1980-1999 mean) in the past and as projected for the future. For the period before 1870, global measurements of sea level are not available. The grey shading shows the uncertainty in the estimated long-term rate of sea level change (Section 6.4.3). The red line is a reconstruction of global mean sea level from tide gauges (Section 5.5.2.1), and the red shading denotes the range of variations from a smooth curve. The green line shows global mean sea level observed from satellite altimetry. The blue shading represents the range of model projections for the SRES A1B scenario for the 21st century, relative to the 1980 to 1999 mean, and has been calculated independently from the observations. Beyond 2100, the projections are increasingly dependent on the emissions scenario (see Chapter 10 for a discussion of sea level rise projections for other scenarios considered in this report). Over many centuries or millennia, sea level could rise by several metres (Section 10.7.4).
El Nino and La Nina are extreme phases of naturally occuring climate cycle referred to as the El Nino Southern Oscillation (ENSO). Both terms refer to large-scale changes in sea-surface temperature across the eastern tropical Pacific. Usually, sea-surface readings off South America's west coast range from 60-70 deg F (16-21 deg C), while they exceed 80 deg F (27 deg C) in the "warm pool" located in the central and western Pacific. This warm pool expands to cover the tropics during El Nino, but during La Nina, the easterly trade winds strengthen and the cold upwelling along the equator and the West coast of South America intensifies. Sea-surface temperatures along the equator can fall as much as 7 deg F (-14 dg C) below normal. El Nino and La Nina conditions recur every few years and can persist for as long as two years. (source: http://www.noaa.gov) Sources: - Base Map with Administrative Boundaries (UTM Projection), NAMRIA - Field Information Manual on El Nino July 1997, BSWM - 1998 Philippine Statistical Yearbook, NSO - El Nino and La Nina Definition, NOAA Methodology: Degree of Vulnerability of El Nino and La Nina based on PAGASA's Climate Map, slope, flooding and elevation. Note to Users: This map is version 1.0 and is under development. The Manila Observatory would appreciate feedback on the veracity of spatial data. Manila Observatory Support for Greenhouse Gas Inventory Philippine Climate Change Program Development, 1999
If we examine global warming from the perspective of the two hemispheres, we find that temperatures in the northern hemisphere have increased much more than temperatures in the southern hemisphere. So, since two thirds of the earth’s land mass is in the northern hemisphere, we would expect global warming to have its largest impact there. In a similar fashion, temperatures over land masses have increased much more than temperatures over the oceans. This is because the oceans tend to moderate temperature changes.
Figure 5.1. Time series of global annual ocean heat content (10 22 J) for the 0 to 700 m layer. The black curve is updated from Levitus et al. (2005a), with the shading representing the 90% confidence interval. The red and green curves are updates of the analyses by Ishii et al. (2006) and Willis et al. (2004, over 0 to 750 m) respectively, with the error bars denoting the 90% confidence interval. The black and red curves denote the deviation from the 1961 to 1990 average and the shorter green curve denotes the deviation from the average of the black curve for the period 1993 to 2003. Figure 3.8. Annual anomalies (°C) of global average SST (blue curve, begins 1850), NMAT (green curve, begins 1856) and land-surface air temperature (red curve, begins 1850) to 2005, relative to their 1961 to 1990 means (Brohan et al., 2006; Rayner et al., 2006). The smooth curves show decadal variations (see Appendix 3.A). Inset shows the smoothed differences between the land-surface air temperature and SST anomalies (i.e., red minus blue).
Figure 20.13 Natural capital degradation : possible effects of global warming on the geographic range of beech trees based on ecological evidence and computer models. According to one projection, if CO 2 emissions doubled between 1990 and 2050, beech trees (now common throughout the eastern United States) would survive only in a greatly reduced range in northern Maine and southeastern Canada. Similarly, native sugar maples would likely disappear in the northeastern United States. QUESTION: What difference does it make if the range of beech trees changes? (Data from Margaret B. Davis and Catherine Zabinski, University of Minnesota)
Global warming will affect peoples throughout the world. For example, Fewer deaths will result from cold weather, but more deaths will result from heat waves Initially, decreased thermohaline circulation will result in cooler temperatures in North Atlantic. The CO2 fertilization effect will increase crop yields by up to 30% Precipitation changes will result in droughts and famine in some areas and expanded arable land in Canada, Soviet Union
There are winners and losers in the global warming game…
Depending upon the scenario, the cost to stabilize carbon dioxide concentrations will be expensive (from 200 times the U.S. annual budget) to very expensive (up to 900 times the U.S. annual budget).
Methods of mitigating global warming include Conservation Reduce energy needs, such as electrical usage, petroleum usage, reduced packaging Recycling, which uses less energy to produce products compared to Another way to reduce carbon emissions is to use alternate energy sources, such as Nuclear Wind Geothermal Hydroelectric Solar Fusion?
Another promising way to reduce global warming is to store carbon dioxide underground. Carbon dioxide can be pumped into depleted oil and gas reservoirs. In addition, carbon dioxide can be pumped into existing oil and gas deposits to enhance recovery. Another method is to pump carbon dioxide into deep saline formations both offshore and onshore. Carbon dioxide can also be used to enhance methane recovery from coal beds.
In conclusion, Global warming is happening Most of the warming is probably the result of human activities There will be positive but mostly negative repercussions from global warming The costs to mitigate global warming will be high – better spent elsewhere?