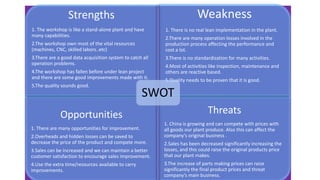
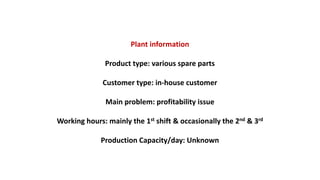
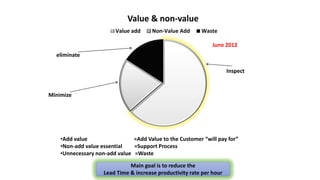
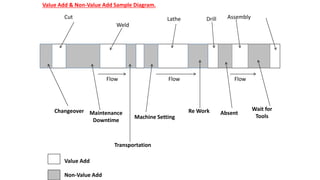
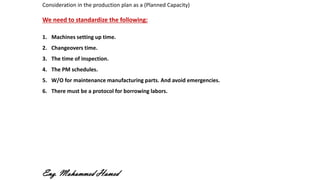
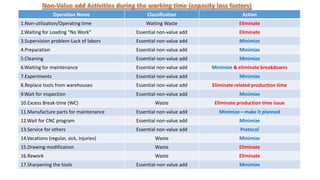
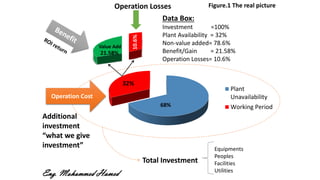
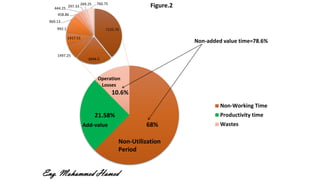
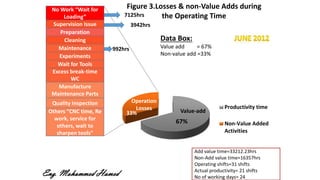
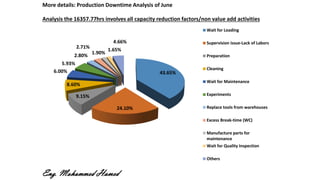
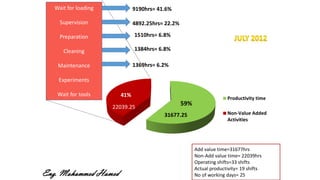
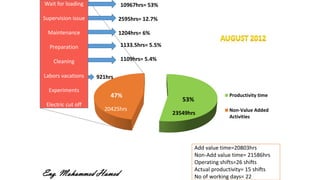
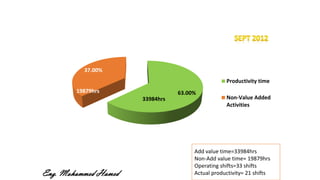
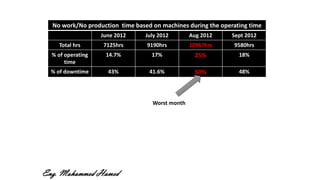
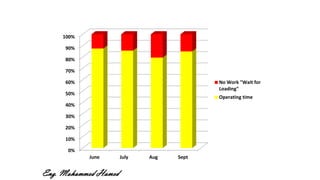
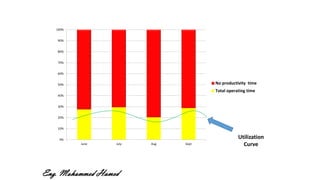
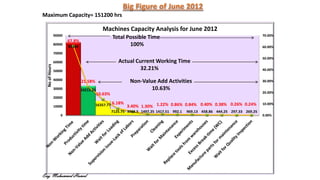
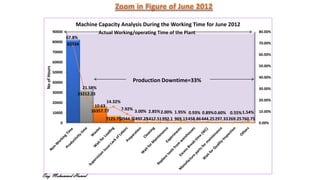
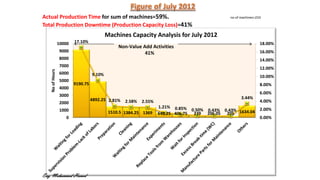
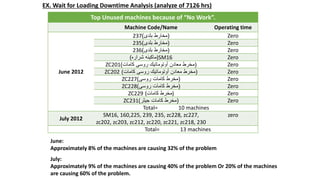
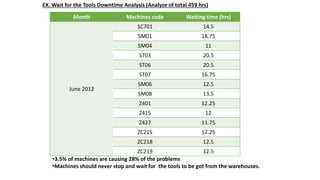
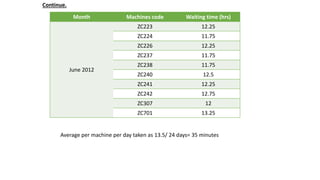
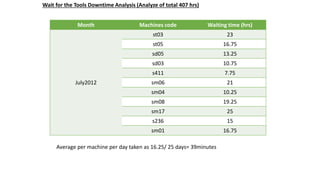
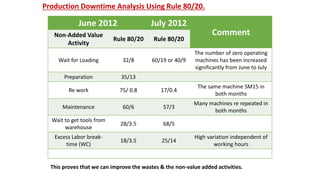
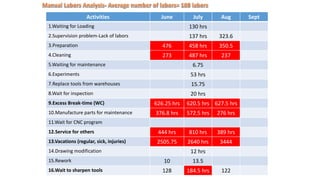
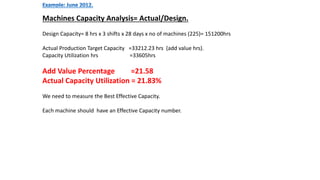
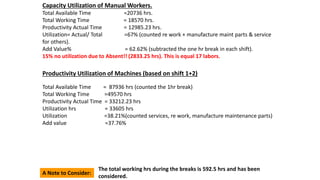
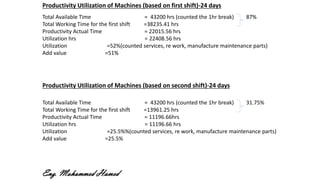
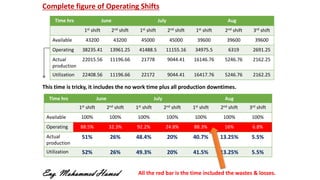
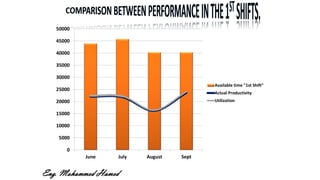
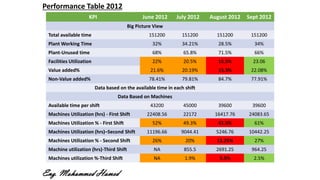
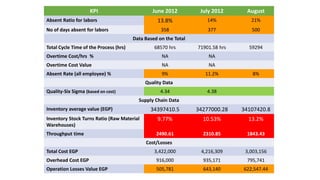
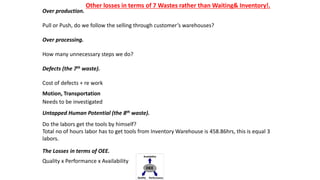
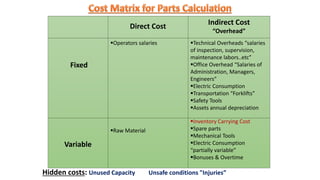
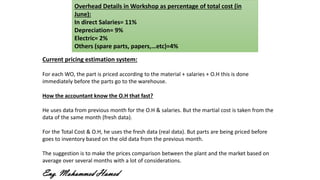
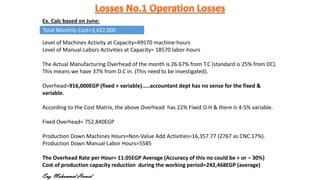
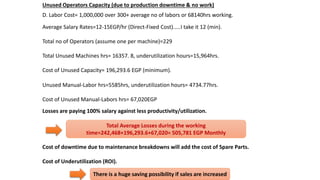
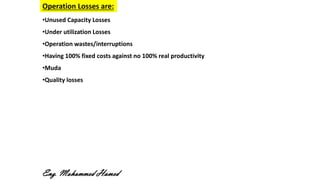
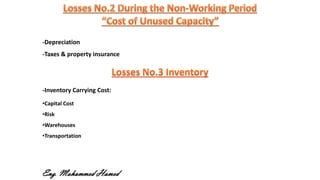
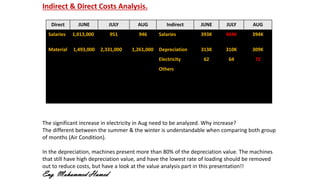
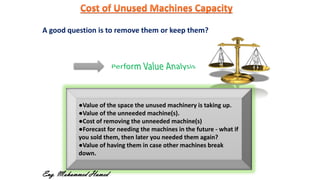
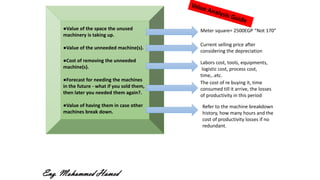
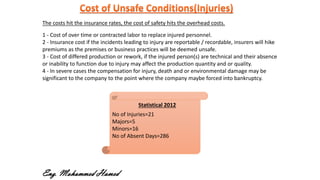
Hidden
Losses
Eng. Mohammed Hamed
Industrial Engineering Consultant
Email: mhamed206@yahoo.com
: m.h.ahmed@ess.aucegypt.edu
Tel: +201001309903
Real Case Study!
Strengths
1. The workshop is like a stand-alone plant and have
many capabilities.
2.The workshop own most of the vital resources
(machines, CNC, skilled labors..etc)
3.There are a good data acquisition system to catch all
operation problems.
4.The workshop has fallen before under lean project
and there are some good improvements made with it.
5.The quality sounds good.
Weakness
1. There is no real lean implementation in the plant.
2.There are many operation losses involved in the
production process affecting the performance and
cost a lot.
3.There is no standardization for many activities.
4.Most of activities like inspection, maintenance and
others are reactive based.
5.Quality needs to be proven that it is good.
Opportunities
1. There are many opportunities for improvement.
2.Overheads and hidden losses can be saved to
decrease the price of the product and compete more.
3.Sales can be increased and we can maintain a better
customer satisfaction to encourage sales improvement.
4.Use the extra time/resources available to carry
improvements.
Threats
1. China is growing and can compete with prices with
all goods our plant produce. Also this can affect the
company’s original business .
2.Sales has been decreased significantly increasing the
losses, and this could raise the original products price
that our plant makes.
3.The increase of parts making prices can raise
significantly the final product prices and threat
company’s main business.
SWOT
Plant information
Product type: various spare parts
Customer type: in-house customer
Main problem: profitability issue
Working hours: mainly the 1st shift & occasionally the 2nd & 3rd
Production Capacity/day: Unknown
Value & non-value
Value add Non-Value Add Waste
Inspect
Minimize
eliminate
•Add value =Add Value to the Customer “will pay for”
•Non-add value essential =Support Process
•Unnecessary non-add value =Waste
Main goal is to reduce the
Lead Time & increase productivity rate per hour
June 2012
Value Add & Non-Value Add Sample Diagram.
Cut
Weld
Changeover Maintenance
Downtime
Machine Setting
Re Work Absent
Wait for
Tools
Transportation
Value Add
Non-Value Add
Lathe Drill
Flow Flow Flow
Assembly
Consideration in the production plan as a (Planned Capacity)
We need to standardize the following:
1. Machines setting up time.
2. Changeovers time.
3. The time of inspection.
4. The PM schedules.
5. W/O for maintenance manufacturing parts. And avoid emergencies.
6. There must be a protocol for borrowing labors.
Eng. Mohammed Hamed
Operation Name Classification Action
1.Non-utilization/Operating time Waiting Waste Eliminate
2.Waiting for Loading “No Work” Essential non-value add Eliminate
3.Supervision problem-Lack of labors Essential non-value add Minimize
4.Preparation Essential non-value add Minimize
5.Cleaning Essential non-value add Minimize
6.Waiting for maintenance Essential non-value add Minimize & eliminate breakdowns
7.Experiments Essential non-value add Minimize
8.Replace tools from warehouses Essential non-value add Eliminate related production time
9.Wait for inspection Essential non-value add Minimize
10.Excess Break-time (WC) Waste Eliminate production time issue
11.Manufacture parts for maintenance Essential non-value add Minimize—make it planned
12.Wait for CNC program Essential non-value add Minimize
13.Service for others Essential non-value add Protocol
14.Vacations (regular, sick, injuries) Waste Minimize
15.Drawing modification Waste Eliminate
16.Rework Waste Eliminate
17.Sharpening the tools Essential-non value add Minimize
Operation Name Classification Action
18.Electric cut-off Waste Eliminate
From 1-18 are non-value add activities for the customer.
All are utilization problem except 11, 13 & 16. Remember that no.13 is in his contract.
For Manufacturing of maintenance parts no(10). Did they compared the prices to the market?
Eng. Mohammed Hamed
Operation Name Non-Value Added Classification
1.Waiting for Loading No Work/Unused Capacity/Waiting Waste
2.Supervision problem-Lack of labors Management issue/Waiting Waste Causing loss of capacity
3.Preparation Waiting Waste
4.Cleaning PM Routines/Waiting Waste-Should has an optimum amount
5.Waiting for maintenance Downtime/Waiting Waste/Capacity Reduction
6.Experiments Waiting Waste
7.Replace tools from warehouses Waiting Waste/Capacity Loss
8.Wait for inspection Waiting Waste/Capacity Loss
9.Excess Break-time (WC) Waiting Waste/Capacity Loss
10.Manufacture parts for maintenance Unplanned/Emergency Issue Cause Production Target
Capacity Loss
11.Wait for CNC program Waiting Waste/Capacity Loss
12.Service for others Should have a Protocol
13.Vacations (regular, sick, injuries) Management issue/Waiting Waste/Capacity Loss
14.Drawing modification Waiting Waste/Capacity Loss
15.Rework Defect Waste/Capacity Loss
16.Wait to sharpen tools Waiting Waste/Capacity Loss
2 to 9, 11 to 14, and 16 are availability problems.
Eng. Mohammed Hamed
Minor stops/issues return to big waste and losses
(see my lean mapping presentation).
The big picture view is the real picture and always
present the financial problem.
Detailed picture focus on the operations.
Plant
Unavailability
Working Period
32%
Operation Cost
Total Investment
Additional
investment
“what we give
investment”
68%
Value Add
Operation Losses
10.6%
Data Box:
Investment =100%
Plant Availability = 32%
Non-value added= 78.6%
Benefit/Gain = 21.58%
Operation Losses= 10.6%
21.58%
Figure.1 The real picture
Equipments
Peoples
Facilities
Utilities
Eng. Mohammed Hamed
68%
21.58%
10.6%
Non-Working Time
Productivity time
Wastes
Non-Utilization
Period
Operation
Losses
7125.75
3944.5
1497.25
1417.51
992.1
969.13
458.86
444.25 297.33
269.25 760.75
Add-value
Non-added value time=78.6%
Figure.2
Eng. Mohammed Hamed
Productivity time
Non-Value Added
Activities
67%
33%
No Work “Wait for
Loading”
Supervision Issue
Preparation
Cleaning
Operation
Losses Value-add
Figure 3.Losses & non-Value Adds during
the Operating Time
Data Box:
Value add = 67%
Non-value add =33%
Maintenance
Experiments
Wait for Tools
Excess break-time
WC
Manufacture
Maintenance Parts
Quality Inspection
Others “CNC time, Re
work, service for
others, wait to
sharpen tools”
992hrs
7125hrs
Add value time=33212.23hrs
Non-Add value time=16357hrs
Operating shifts=31 shifts
Actual productivity= 21 shifts
No of working days= 24
3942hrs
Eng. Mohammed Hamed
43.65%
24.10%
9.15%
8.60%
6.00%
5.93%
2.80%
2.71%
1.90%
1.65%
4.66%
Wait for Loading
Supervision issue-Lack of Labors
Preparation
Cleaning
Wait for Maintenance
Experiments
Replace tools from warehouses
Excess Break-time (WC)
Manufacture parts for
maintenance
Wait for Quality Inspection
Others
More details: Production Downtime Analysis of June
Analysis the 16357.77hrs involves all capacity reduction factors/non value add activities
Eng. Mohammed Hamed
Productivity time
Non-Value Added
Activities
41%
59%
Wait for loading
Supervision
Preparation
Cleaning
Maintenance
Experiments
Wait for tools
9190hrs= 41.6%
4892.25hrs= 22.2%
1369hrs= 6.2%
31677.25
22039.25
Add value time=31677hrs
Non-Add value time= 22039hrs
Operating shifts=33 shifts
Actual productivity= 19 shifts
No of working days= 25Eng. Mohammed Hamed
1510hrs= 6.8%
1384hrs= 6.8%
Productivity time
Non-Value Added
Activities
53%
47%
Wait for loading
Supervision issue
Maintenance
Preparation
Cleaning
Labors vacations
Experiments
Electric cut off
10967hrs= 53%
2595hrs= 12.7%
1204hrs= 6%
921hrs
23549hrs
20425hrs
Add value time=20803hrs
Non-Add value time= 21586hrs
Operating shifts=26 shifts
Actual productivity= 15 shifts
No of working days= 22Eng. Mohammed Hamed
1133.5hrs= 5.5%
1109hrs= 5.4%
63.00%
37.00%
Productivity time
Non-Value Added
Activities
19879hrs
33984hrs
Add value time=33984hrs
Non-Add value time= 19879hrs
Operating shifts=33 shifts
Actual productivity= 21 shiftsEng. Mohammed Hamed
No work/No production time based on machines during the operating time
June 2012 July 2012 Aug 2012 Sept 2012
Total hrs 7125hrs 9190hrs 10967hrs 9580hrs
% of operating
time
14.7% 17% 25% 18%
% of downtime 43% 41.6% 50% 48%
Worst month
Eng. Mohammed Hamed
0%
10%
20%
30%
40%
50%
60%
70%
80%
90%
100%
June July Aug Sept
No Work "Wait for
Loading"
Operating time
Eng. Mohammed Hamed
0%
10%
20%
30%
40%
50%
60%
70%
80%
90%
100%
June July Aug Sept
No productivity time
Total operating time
Utilization
Curve
Eng. Mohammed Hamed
0
10000
20000
30000
40000
50000
60000
June July Aug Sept
Operating time
Productivity curve
Utilization Curve
Eng. Mohammed Hamed
0
20000
40000
60000
80000
100000
120000
140000
160000
180000
June July Aug Sept
Total Available time
Productivity curve
Utilization Curve
Eng. Mohammed Hamed
82334
33212.23
16357.77
7125.75 3944.5 1497.25 1417.51 992.1 969.13 458.86 444.25 297.33 269.25
67.8%
21.58%
10.63%
6.18%
3.40% 1.30% 1.22% 0.86% 0.84% 0.40% 0.38% 0.26% 0.24%
0.00%
10.00%
20.00%
30.00%
40.00%
50.00%
60.00%
70.00%
0
10000
20000
30000
40000
50000
60000
70000
80000
90000
NoofHours
Machines Capacity Analysis for June 2012
Actual Current Working Time
32.21%
Maximum Capacity= 151200 hrs
Total Possible Time
100%
Non-Value Add Activities
10.63%
Eng. Mohammed Hamed
82334
33212.23
16357.77
7125.753944.51497.251417.51992.1 969.13458.86444.25297.33269.25760.75
67.8%
21.58%
10.63
14.32%
7.92% 3.00% 2.85%2.00% 1.95% 0.93% 0.89%0.60% 0.55%1.54%
0.00%
10.00%
20.00%
30.00%
40.00%
50.00%
60.00%
70.00%
80.00%
0
10000
20000
30000
40000
50000
60000
70000
80000
90000
NoofHours
Machine Capacity Analysis During the Working Time for June 2012
Actual Working/operating Time of the Plant
Production Downtime=33%
Eng. Mohammed Hamed
Actual Production Time for sum of machines=59%.
Total Production Downtime (Production Capacity Loss)=41%
9190.75
4892.25
1510.5 1384.25 1369 649.25 406.75 239 206.05 205 1634.04
17.10%
9.10%
2.81% 2.58% 2.55%
1.21% 0.85% 0.50% 0.43% 0.43%
3.44%
0.00%
2.00%
4.00%
6.00%
8.00%
10.00%
12.00%
14.00%
16.00%
18.00%
0
1000
2000
3000
4000
5000
6000
7000
8000
9000
10000
NoofHours
Machines Capacity Analysis for July 2012
Non-Value Add Activities
41%
no of machines=233
Eng. Mohammed Hamed
Maintenance Downtime Analysis
0
50
100
150
200
0%
5%
10%
15%
20%
SM11 5351 S436 ZT03 S222 ZC236 5365 ST03 KG106 S411 ZM02 ZT02 S338 S344
TOP Machines with Maintenance Downtime
6% of machines present 60% of the problem
60% of
downtime
problem
40% of
downtime
problem
Over 200 MachinesOnly 14 machines
Eng. Mohammed Hamed
100%
Machines
Stuff
100%
downtime
60%
downtime
issue
Opportunities
for
Improvement
Opportunities
for
Improvement
Example for the Top Down to Maintenance Machines.
Month Machine Code/Name No of days/hrs down!
June 2012
SM11 The whole month
S436 9 days continuous/69hrs
S351 14 days continuous/95hrs
S365 4 days continuous/23hrs
zt03 6 days/48hrs
S226 4 days/ 31.25hrs
July 2012
SM11 The whole month
S436 18 days continuous
5351 10 days continuous
5365 20 days continuous/147 hrs
736 7 days/49 hours
S231 5 days/ 31 hours
733 6 days/ 35 hrs
Operate=55 hrs
Operate=33hrs
Operate=168hrs
Too much maintenance downtime for those machines. Really abnormal. Why?
If they are waiting for spare parts, so where is the stock? Are they not needed for production so
they left down and recorded as down for maintenance?
Comment:
EX. Wait for Loading Downtime Analysis (analyze of 7126 hrs)
Top Unused machines because of “No Work”.
Machine Code/Name Operating time
June 2012
(‫بلدى‬ ‫مخارط‬)237 Zero
(‫بلدى‬ ‫مخارط‬)235 Zero
(‫بلدى‬ ‫مخارط‬)236 Zero
‫شراره‬ ‫ماكينه‬) )SM16 Zero
(‫كامات‬ ‫روسى‬ ‫أوتوماتيك‬ ‫معادن‬ ‫مخرط‬)ZC201 Zero
(‫كامات‬ ‫روسى‬ ‫أوتوماتيك‬ ‫معادن‬ ‫مخرط‬)ZC202 Zero
(‫روسى‬ ‫كامات‬ ‫مخرط‬)ZC227 Zero
(‫روسى‬ ‫كامات‬ ‫مخرط‬)ZC228 Zero
)‫كامات‬ ‫مخرط‬(ZC229 Zero
(‫جيثر‬ ‫كامات‬ ‫مخرط‬)ZC231 Zero
Total= 10 machines
July 2012
SM16, 160,225, 239, 235, zc228, zc227,
zc202, zc203, zc212, zc220, zc221, zc218, 230
zero
Total= 13 machines
June:
Approximately 8% of the machines are causing 32% of the problem
July:
Approximately 9% of the machines are causing 40% of the problem Or 20% of the machines
are causing 60% of the problem.
EX. Wait for the Tools Downtime Analysis (Analyze of total 459 hrs)
Month Machines code Waiting time (hrs)
June 2012
SC701 14.5
SM01 18.75
SM04 11
ST03 20.5
ST06 20.5
ST07 16.75
SM06 12.5
SM08 13.5
Z401 12.25
Z415 12
Z427 11.75
ZC215 12.25
ZC218 12.5
ZC219 12.5
•3.5% of machines are causing 28% of the problems
•Machines should never stop and wait for the tools to be got from the warehouses.
Continue.
Month Machines code Waiting time (hrs)
June 2012
ZC223 12.25
ZC224 11.75
ZC226 12.25
ZC237 11.75
ZC238 11.75
ZC240 12.5
ZC241 12.25
ZC242 12.75
ZC307 12
ZC701 13.25
Average per machine per day taken as 13.5/ 24 days= 35 minutes
Wait for the Tools Downtime Analysis (Analyze of total 407 hrs)
Month Machines code Waiting time (hrs)
July2012
st03 23
st05 16.75
sd05 13.25
sd03 10.75
s411 7.75
sm06 21
sm04 10.25
sm08 19.25
sm17 25
s236 15
sm01 16.75
Average per machine per day taken as 16.25/ 25 days= 39minutes
EX. Preparation Analysis---according to rule 80/20 (analyze of 1497hrs)
Month Machines code Waiting time (hrs)
June 2012
S234 23.25
S235 17
S419 24.75
SM06 33.75
SM08 18.5
ST06 26.5
Z427 19.75
ZM11 19
ZM12 21.5
ZM13 12.75
ZT03 14
Z228 13
Z230 15.5
Z425 13.5
Average per machine per day= 20/24 days= 50 minutes
EX. Cleaning– Analysis according to Rule 80/20 (analyze of 1417 hrs)
Month Machines code Waiting time (hrs)
June 2012
S204 12.5
S419 14.25
S431 11.75
SM04 12
SM06 12.5
SM08 13.5
ST04 11.75
ST09 12.5
Z402 12.25
Z415 12
ZC206 11.75
ZC207 11.75
ZC215 12.25
ZC218 12.5
Average per machine per day= 12/ 24 days= 30 minutes
Production Downtime Analysis Using Rule 80/20.
June 2012 July 2012
CommentNon-Added Value
Activity
Rule 80/20 Rule 80/20
Wait for Loading 32/8 60/19 or 40/9
The number of zero operating
machines has been increased
significantly from June to July
Preparation 35/13
Re work 75/ 0.8 17/0.4
The same machine SM15 in
both months
Maintenance 60/6 57/3
Many machines re repeated in
both months
Wait to get tools from
warehouse
28/3.5 68/5
Excess Labor break-
time (WC)
18/3.5 25/14
High variation independent of
working hours
This proves that we can improve the wastes & the non-value added activities.
Activities June July Aug Sept
1.Waiting for Loading 130 hrs
2.Supervision problem-Lack of labors 137 hrs 323.6
3.Preparation 476 458 hrs 350.5
4.Cleaning 273 487 hrs 237
5.Waiting for maintenance 6.75
6.Experiments 53 hrs
7.Replace tools from warehouses 15.75
8.Wait for inspection 20 hrs
9.Excess Break-time (WC) 626.25 hrs 620.5 hrs 627.5 hrs
10.Manufacture parts for maintenance 376.8 hrs 572.5 hrs 276 hrs
11.Wait for CNC program
12.Service for others 444 hrs 810 hrs 389 hrs
13.Vacations (regular, sick, injuries) 2505.75 2640 hrs 3444
14.Drawing modification 12 hrs
15.Rework 10 13.5
16.Wait to sharpen tools 128 184.5 hrs 122
Comparison between service for others time between Machines & Manual Labors.
June July Aug
Machines (hrs) 127.35 108 21.75
Labors (hrs) 444 810 389
Measure June July August
No of days absent 358 377 500
Absent percentage 13.8% 14% 21%
Productivity hours 12896 12000 9548
Average no of days
absent in month
3.5 3.5 4.6
0
100
200
300
400
500
600
0
2000
4000
6000
8000
10000
12000
14000
June July Aug
Productivity hous
No of absent days
No of
labors/machines
June July Aug
Labors (hrs) 108 626 620 627.5
Machines (hrs) 225 442.5 206 444.25
This is an indication that something needs to be fixed.
Each employee is spending around 50% extra of his original break-time.
0
100
200
300
400
500
600
700
June July Aug
Labors- WC time
Mahcines- WC time
Machines Capacity Analysis= Actual/Design.
Design Capacity= 8 hrs x 3 shifts x 28 days x no of machines (225)= 151200hrs
Actual Production Target Capacity =33212.23 hrs (add value hrs).
Capacity Utilization hrs =33605hrs
Add Value Percentage =21.58
Actual Capacity Utilization = 21.83%
We need to measure the Best Effective Capacity.
Each machine should have an Effective Capacity number.
Capacity Utilization of Manual Workers.
Total Available Time =20736 hrs.
Total Working Time = 18570 hrs.
Productivity Actual Time = 12985.23 hrs.
Utilization= Actual/ Total =67% (counted re work + manufacture maint parts & service
for others).
Add Value% = 62.62% (subtracted the one hr break in each shift).
15% no utilization due to Absent!! (2833.25 hrs). This is equal 17 labors.
A Note to Consider:
The total working hrs during the breaks is 592.5 hrs and has been
considered.
Total Available Time = 87936 hrs (counted the 1hr break)
Total Working Time =49570 hrs
Productivity Actual Time = 33212.23 hrs
Utilization hrs = 33605 hrs
Utilization =38.21%(counted services, re work, manufacture maintenance parts)
Add value =37.76%
Productivity Utilization of Machines (based on shift 1+2)
Productivity Utilization of Machines (based on first shift)-24 days
Total Available Time = 43200 hrs (counted the 1hr break) 87%
Total Working Time for the first shift =38235.41 hrs
Productivity Actual Time = 22015.56 hrs
Utilization hrs = 22408.56 hrs
Utilization =52%(counted services, re work, manufacture maintenance parts)
Add value =51%
Productivity Utilization of Machines (based on second shift)-24 days
Total Available Time = 43200 hrs (counted the 1hr break) 31.75%
Total Working Time for the first shift =13961.25 hrs
Productivity Actual Time = 11196.66hrs
Utilization hrs = 11196.66 hrs
Utilization =25.5%%(counted services, re work, manufacture maintenance parts)
Add value =25.5%
Eng. Mohammed Hamed
Time hrs June July Aug
1st shift 2nd shift 1st shift 2nd shift 1st shift 2nd shift 3rd shift
Available 43200 43200 45000 45000 39600 39600 39600
Operating 38235.41 13961.25 41488.5 11155.16 34975.5 6319 2691.25
Actual
production
22015.56 11196.66 21778 9044.41 16146.76 5246.76 2162.25
Utilization 22408.56 11196.66 22172 9044.41 16417.76 5246.76 2162.25
This time is tricky, it includes the no work time plus all production downtimes.
Time hrs June July Aug
1st shift 2nd shift 1st shift 2nd shift 1st shift 2nd shift 3rd shift
Available 100% 100% 100% 100% 100% 100% 100%
Operating 88.5% 32.3% 92.2% 24.8% 88.3% 16% 6.8%
Actual
production
51% 26% 48.4% 20% 40.7% 13.25% 5.5%
Utilization 52% 26% 49.3% 20% 41.5% 13.25% 5.5%
Complete figure of Operating Shifts
Eng. Mohammed Hamed All the red bar is the time included the wastes & losses.
0
5000
10000
15000
20000
25000
30000
35000
40000
45000
50000
June July August Sept
Available time "1st Shift"
Actual Productivity
Utilization
Eng. Mohammed Hamed
0
5000
10000
15000
20000
25000
30000
35000
40000
45000
50000
June July August Sept
Available time 2nd shift
Actual Productivity
Utilization
Eng. Mohammed Hamed
0
5000
10000
15000
20000
25000
30000
35000
40000
45000
50000
June July August Sept
Available time 3rd shift
Utilization
Eng. Mohammed Hamed
KPI June 2012 July 2012 August 2012 Sept 2012
Big Picture View
Total available time 151200 151200 151200 151200
Plant Working Time 32% 34.21% 28.5% 34%
Plant-Unused time 68% 65.8% 71.5% 66%
Facilities Utilization 22% 20.5% 15.5% 23.06
Value added% 21.6% 20.19% 15.3% 22.08%
Non-Value added% 78.41% 79.81% 84.7% 77.91%
Data based on the available time in each shift
Data Based on Machines
Available time per shift 43200 45000 39600 39600
Machines Utilization (hrs) - First Shift 22408.56 22172 16417.76 24083.65
Machines Utilization % - First Shift 52% 49.3% 41.5% 61%
Machines Utilization (hrs)–Second Shift 11196.66 9044.41 5246.76 10442.25
Machines Utilization % - Second Shift 26% 20% 13.25% 27%
Machine utilization (hrs)-Third Shift NA 855.5 2691.25 964.25
Machines utilization %-Third Shift NA 1.9% 5.5% 2.5%
Performance Table 2012
Eng. Mohammed Hamed
KPI June 2012 July 2012 August Sept
Data based on the operating time/working time-Machines
Total Cycle Time 49750 52650.83 43852 53863
Actual Production Capacity hrs 33212.23 31064 23545 33984
Value added % 67% 59% 53% 63.63%
Utilization hrs 33605.23 31457 23690 34241.5
Utilization % 67.55% 59.75% 54%
Production Downtime-Capacity Loss 16357.75 21586.84 20303 19879
Non-value added % 33% 41% 47% 36.37%
No Work/No Production % 14.17% 17.1% 25% 18%
Data Based on Manual Labors
Total Available time 20736 21600 17776
Total Cycle Time/Operating time 18570 18199 15442
Value added hrs 12985.23 12,000 9548
Labors added value time% 62.6% 55% 53.71%
Non value add hrs 5584.77 6205.6 5894
Labors non-added value % 33% 36.8% 38.16%
Labors utilization hrs 13835 13387 10191.72
Labors utilization% 66% 62% 57.33%
KPI June 2012 July 2012 August
Absent Ratio for labors 13.8% 14% 21%
No of days absent for labors 358 377 500
Data Based on the Total
Total Cycle Time of the Process (hrs) 68570 hrs 71901.58 hrs 59294
Overtime Cost/hrs % NA NA
Overtime Cost Value NA NA
Absent Rate (all employee) % 9% 11.2% 8%
Quality Data
Quality-Six Sigma (based on cost) 4.34 4.38
Supply Chain Data
Inventory average value (EGP) 34397410.5 34277000.28 34107420.8
Inventory Stock Turns Ratio (Raw Material
Warehouses)
9.77% 10.53% 13.2%
Throughput time 2490.61 2310.85 1843.43
Cost/Losses
Total Cost EGP 3,422,000 4,216,309 3,003,156
Overhead Cost EGP 916,000 935,171 795,741
Operation Losses Value EGP 505,781 643,140 622,547.44
ITO%= Sell through/ Average Inventory value. Optimum = (12:1)= 600%---minimum=200%
Current situation: from JAN TO AUG (8 months)
Inventory (the 2nd Waste).
Eng. Mohammed Hamed
•Losses here are the inventory carrying cost for long period.
•The calculation above is based on the frozen value. Neither the procurement nor the finished
goods inventories.
•Green=OK but still not perfect.
•Red=BAD
Warehouse
no
103 108 109 110 129 131 153
Average value
(EGP)
535,158.6
25
22,523,833.4
5
7,924,122 10,595,727.9 9,816,508.2 2,045,100.6 1,231,920.
6
Sell (EGP) 99,629.48 841,593.9 1,499,816.
309
1,207,232.28 2,406,277.7
15
2,427,021.7
04
1,156,790.
856
Turnover % 18.6% 3.75% 18.93% 11.4% 24.5% 118.67% 93.9%
Throughput
time (days)
1308.25 6488.88 1285.43 2134.5 993.2 205.05 259.141
103, 108, 129, 153 Raw Material Warehouses.
109 Finished Product Warehouse.
110= Accessories Warehouse.
131= Finished product for magazines before assembly.
Excess inventory is a big waste, do we have this problem? What is the turnover ratio?.
Slow Turnover INCREASE the Carrying Cost
Carrying cost is 25-55%, if we took it 25%, then we have 13.3 Million pounds annual cost.
This could raise the price of the part significantly if applied as an Overhead to the parts cost.
If the plant average total cost monthly=3 million (monthly), then it could be increased to 4
million, dividing the 1 million to how many parts the plant has produced, and imagine the
increase in the unit/price.
The question: why we bought a 4yrs stock of raw materials?
Money in the bank is taxed as profit. Perhaps buying the material was a way to reduce tax
liability and increase the asset value of the company?
Was there a drop in prices? Even if it was a bargain, as a risk management, never buy more
than 1 yr inventory stock. Cash flow & other considerations must be taken into account.
Eng. Mohammed Hamed
Over production.
Pull or Push, do we follow the selling through customer’s warehouses?
Over processing.
How many unnecessary steps we do?
Defects (the 7th waste).
Cost of defects + re work
Do the labors get the tools by himself?
Total no of hours labor has to get tools from Inventory Warehouse is 458.86hrs, this is equal 3
labors.
The Losses in terms of OEE.
Untapped Human Potential (the 8th waste).
Quality x Performance x Availability
Other losses in terms of 7 Wastes rather than Waiting& Inventory!.
Motion, Transportation
Needs to be investigated
Visible Cost
Hidden Cost
Eng. Mohammed Hamed
Fixed
Variable
Direct Cost
Indirect Cost
“Overhead”
Operators salaries
Raw Material
Inventory Carrying Cost
Spare parts
Mechanical Tools
Electric Consumption
“partially variable”
Bonuses & Overtime
Hidden costs: Unused Capacity Unsafe conditions "Injuries”
Technical Overheads “salaries
of inspection, supervision,
maintenance labors..etc”
Office Overhead “Salaries of
Administration, Managers,
Engineers”
Electric Consumption
Transportation “Forklifts”
Safety Tools
Assets annual depreciation
Overhead Details in Workshop as percentage of total cost (in
June):
In direct Salaries= 11%
Depreciation= 9%
Electric= 2%
Others (spare parts, papers,…etc)=4%
Current pricing estimation system:
For each WO, the part is priced according to the material + salaries + O.H this is done
immediately before the parts go to the warehouse.
How the accountant know the O.H that fast?
He uses data from previous month for the O.H & salaries. But the martial cost is taken from the
data of the same month (fresh data).
For the Total Cost & O.H, he uses the fresh data (real data). But parts are being priced before
goes to inventory based on the old data from the previous month.
The suggestion is to make the prices comparison between the plant and the market based on
average over several months with a lot of considerations.
Eng. Mohammed Hamed
Ex. Calc based on June:
Level of Machines Activity at Capacity=49570 machine-hours
Level of Manual-Labors Activities at Capacity= 18570 labor-hours
The Actual Manufacturing Overhead of the month is 26.67% from T.C (standard is 25% from DC).
This means we have 37% from D.C in. (This need to be investigated).
Overhead=916,000EGP (fixed + variable).....accountant dept has no sense for the fixed &
variable.
According to the Cost Matrix, the above Overhead has 22% Fixed O.H & there is 4-5% variable.
Fixed Overhead= 752,840EGP
Production Down Machines Hours=Non-Value Add Activities=16,357.77 (2767 as CNC.17%).
Production Down Manual-Labor Hours=5585
The Overhead Rate per Hour= 11.05EGP Average (Accuracy of this no could be + or – 30%)
Cost of production capacity reduction during the working period=242,468EGP (average)
Total Monthly Cost=3,422,000
Eng. Mohammed Hamed
Unused Operators Capacity (due to production downtime & no work)
Average Salary Rates=12-15EGP/hr (Direct-Fixed Cost).....I take it 12 (min).
Total no of Operators (assume one per machine)=229
Total Unused Machines hrs= 16357. 8, underutilization hours=15,964hrs.
Cost of Unused Capacity= 196,293.6 EGP (minimum).
Total Average Losses during the working
time=242,468+196,293.6+67,020= 505,781 EGP Monthly
Cost of downtime due to maintenance breakdowns will add the cost of Spare Parts.
Cost of Underutilization (ROI).
Unused Manual-Labor hrs=5585hrs, underutilization hours= 4734.77hrs.
Cost of Unused Manual-Labors hrs= 67,020EGP
Losses are paying 100% salary against less productivity/utilization.
There is a huge saving possibility if sales are increased
D. Labor Cost= 1,000,000 over 300+ average no of labors or 68140hrs working.
•Unused Capacity Losses
•Under utilization Losses
•Operation wastes/interruptions
•Having 100% fixed costs against no 100% real productivity
•Muda
•Quality losses
Operation Losses are:
Eng. Mohammed Hamed
-Depreciation
-Taxes & property insurance
-Inventory Carrying Cost:
•Capital Cost
•Risk
•Warehouses
•Transportation
Eng. Mohammed Hamed
Indirect & Direct Costs Analysis.
Direct JUNE JULY AUG Indirect JUNE JULY AUG
Salaries 1,013,000 951 946 Salaries 393K 484K 394K
Material 1,493,000 2,331,000 1,261,000 Depreciation 313K 310K 309K
Electricity 62 64 72
Others
The significant increase in electricity in Aug need to be analyzed. Why increase?
The different between the summer & the winter is understandable when comparing both group
of months (Air Condition).
In the depreciation, machines present more than 80% of the depreciation value. The machines
that still have high depreciation value, and have the lowest rate of loading should be removed
out to reduce costs, but have a look at the value analysis part in this presentation!!
Eng. Mohammed Hamed
A good question is to remove them or keep them?
●Value of the space the unused machinery is taking up.
●Value of the unneeded machine(s).
●Cost of removing the unneeded machine(s)
●Forecast for needing the machines in the future - what if
you sold them, then later you needed them again?
●Value of having them in case other machines break
down.
Eng. Mohammed Hamed
●Value of the space the unused
machinery is taking up.
●Value of the unneeded machine(s).
●Cost of removing the unneeded
machine(s).
●Forecast for needing the machines
in the future - what if you sold them,
then later you needed them again?.
●Value of having them in case other
machines break down.
Meter square= 2500EGP “Not 170”
Current selling price after
considering the depreciation
Labors cost, tools, equipments,
logistic cost, process cost,
time,..etc.
Refer to the machine breakdown
history, how many hours and the
cost of productivity losses if no
redundant.
The cost of re buying it, time
consumed till it arrive, the losses
of productivity in this period
Eng. Mohammed Hamed
1 - Cost of over time or contracted labor to replace injured personnel.
2 - Insurance cost if the incidents leading to injury are reportable / recordable, insurers will hike
premiums as the premises or business practices will be deemed unsafe.
3 - Cost of differed production or rework, if the injured person(s) are technical and their absence
or inability to function due to injury may affect the production quantity and or quality.
4 - In severe cases the compensation for injury, death and or environmental damage may be
significant to the company to the point where the company maybe forced into bankruptcy.
The costs hit the insurance rates, the cost of safety hits the overhead costs.
No of Injuries=21
Majors=5
Minors=16
No of Absent Days=286
Statistical 2012
Eng. Mohammed Hamed
Eng. Mohammed Hamed
•If the plant could produce more, the price per part or per work order will be decreased.
•If the plant don’t need the more product or no more orders to process, then the plant is paying
for the overheads and the other fixed costs then distributing them on the product cost, this will
raise the product cost and prevent the plant from achieving lower prices and making
competition, thus result in decreasing the plant order (customers will find the market is
cheaper).
•Unused machines have much lower cost than unused operators capacity. The losses is the ROI
& the depreciation (market value of equipments should be considered).
•Effect of unplanned WOs, if for the same parts and increase in quantity, the price will be high
because the there will be a double processing somewhere. Matter of fact is that we have 24% of
the unplanned WOs are topping ones.
•Increase production demand, how? find more product to produce at the customer order., never
go for push!.
Considerable points:
The goal is to find more product to produce by increasing the
sales (pull as customer need) at minimum cost or reduce price per
current units.
Eng. Mohammed Hamed
Benefit from paying yourself to make parts:
•Protection of secret processes should be considered as a value add of paying to yourself.
Perhaps the real profitability is the difference between what you would
need to pay someone else to make the part as opposed to what you can
make it for
If we considered in the parts cost the high inventory stock value the plant is currently holding,
then this will raise significantly the price of the parts, will this affect the plant competition for
prices comparison to the market?.
In most companies increasing productivity means increasing sales, this can be done through
selling to out-house customers, but we have to treat them differently from the in-house
customers.
There is an opportunity of productivity improvement & reduction of lead time, but we have
to fulfill the free remain time with production by increasing the sales.
Beer in mind the real profitability of the workshop is for the main selling
product, so making the product cheaper at the central workshop will
lower the main product cost/price
Unless you are cheaper than the external market, this will not be considered as Lean. The
main goal is to make the main company’s product at the best possible price.
Why refusing some parts to make because of high prices compared to the market while I would
have accepted these orders to at lest cover my expenses and reduce the losses over the
previous months.
Accepting customers orders till a rate of 25% different price than the market is acceptable in the
current period to cover the plant expenses & overheads.
14%, 17%, and 25% no work could be fulfilled.
Fixed salaries could be at least covered.
Overheads could be at least covered
Consuming the inventory freeze stock, reduce the 13 million losses.
Reducing prices of the other parts I make if overheads & fixed costs are distributed on as many
parts as I can.
There is an opportunity to increase sales if the plant is open to make parts
for the market but we have to deal with the customers differently and with
a better way rather than the in-house customers.
Eng. Mohammed Hamed
Quality
Cost
Defect
Parts
Re Work
Parts
Eng. Mohammed Hamed
Ex. Losses in June 2012 due to Defect Cost.
Sigma Calculation .
Data:
Opportunities: 3,422,000EGP
Defects : 7,600EGP
Results:
DPMO :2221
Defects % :0.22%
Yield :99.78%
Process Sigma:4.34
If we assume the cost of defects is double this number=15200EGP
The process Sigma then is: 4.12 (Acceptable).
We need to be sure that those
are the only defects
Eng. Mohammed Hamed
Correspond to Defects Quantity.
Sigma Calculation .
Data:
Opportunities: 1669438
Defects : 7833
Results:
DPMO :4692
Defects % :0.47%
Yield :99.53%
Process Sigma:4.1
Eng. Mohammed Hamed
Note: This is just for illustration. Sigma quantity based calculation should be on a group of
similar/identical items.
AACE International Authority of Cost Management.
Lectures from the American University in Cairo.
Toyota Way book “Author Jeff K Liker”.
Toyota KATA book “Author Mike Rother”
Strategic Lean Mapping book “Author Steven Borris”
OEE Can Be Your Key: : Change Formula for Equipment Availability to Improve
Performance”, Institute of Industrial Engineers IIE Magazine, Volume 48, issue no.8,
August 2013, USA. By Author “Mohammed Hamed Ahmed”
Eng. Mohammed Hamed
The American University in Cairo
Email: mhamed206@yahoo.com
: m.h.ahmed@ess.aucegypt.edu
Tel: +201001309903

Plant Productivity Measurement, Analysis & Improvement: Business Case

  • 1.
    Hidden Losses Eng. Mohammed Hamed IndustrialEngineering Consultant Email: mhamed206@yahoo.com : m.h.ahmed@ess.aucegypt.edu Tel: +201001309903 Real Case Study!
  • 4.
    Strengths 1. The workshopis like a stand-alone plant and have many capabilities. 2.The workshop own most of the vital resources (machines, CNC, skilled labors..etc) 3.There are a good data acquisition system to catch all operation problems. 4.The workshop has fallen before under lean project and there are some good improvements made with it. 5.The quality sounds good. Weakness 1. There is no real lean implementation in the plant. 2.There are many operation losses involved in the production process affecting the performance and cost a lot. 3.There is no standardization for many activities. 4.Most of activities like inspection, maintenance and others are reactive based. 5.Quality needs to be proven that it is good. Opportunities 1. There are many opportunities for improvement. 2.Overheads and hidden losses can be saved to decrease the price of the product and compete more. 3.Sales can be increased and we can maintain a better customer satisfaction to encourage sales improvement. 4.Use the extra time/resources available to carry improvements. Threats 1. China is growing and can compete with prices with all goods our plant produce. Also this can affect the company’s original business . 2.Sales has been decreased significantly increasing the losses, and this could raise the original products price that our plant makes. 3.The increase of parts making prices can raise significantly the final product prices and threat company’s main business. SWOT
  • 5.
    Plant information Product type:various spare parts Customer type: in-house customer Main problem: profitability issue Working hours: mainly the 1st shift & occasionally the 2nd & 3rd Production Capacity/day: Unknown
  • 6.
    Value & non-value Valueadd Non-Value Add Waste Inspect Minimize eliminate •Add value =Add Value to the Customer “will pay for” •Non-add value essential =Support Process •Unnecessary non-add value =Waste Main goal is to reduce the Lead Time & increase productivity rate per hour June 2012
  • 7.
    Value Add &Non-Value Add Sample Diagram. Cut Weld Changeover Maintenance Downtime Machine Setting Re Work Absent Wait for Tools Transportation Value Add Non-Value Add Lathe Drill Flow Flow Flow Assembly
  • 8.
    Consideration in theproduction plan as a (Planned Capacity) We need to standardize the following: 1. Machines setting up time. 2. Changeovers time. 3. The time of inspection. 4. The PM schedules. 5. W/O for maintenance manufacturing parts. And avoid emergencies. 6. There must be a protocol for borrowing labors. Eng. Mohammed Hamed
  • 10.
    Operation Name ClassificationAction 1.Non-utilization/Operating time Waiting Waste Eliminate 2.Waiting for Loading “No Work” Essential non-value add Eliminate 3.Supervision problem-Lack of labors Essential non-value add Minimize 4.Preparation Essential non-value add Minimize 5.Cleaning Essential non-value add Minimize 6.Waiting for maintenance Essential non-value add Minimize & eliminate breakdowns 7.Experiments Essential non-value add Minimize 8.Replace tools from warehouses Essential non-value add Eliminate related production time 9.Wait for inspection Essential non-value add Minimize 10.Excess Break-time (WC) Waste Eliminate production time issue 11.Manufacture parts for maintenance Essential non-value add Minimize—make it planned 12.Wait for CNC program Essential non-value add Minimize 13.Service for others Essential non-value add Protocol 14.Vacations (regular, sick, injuries) Waste Minimize 15.Drawing modification Waste Eliminate 16.Rework Waste Eliminate 17.Sharpening the tools Essential-non value add Minimize
  • 11.
    Operation Name ClassificationAction 18.Electric cut-off Waste Eliminate From 1-18 are non-value add activities for the customer. All are utilization problem except 11, 13 & 16. Remember that no.13 is in his contract. For Manufacturing of maintenance parts no(10). Did they compared the prices to the market? Eng. Mohammed Hamed
  • 12.
    Operation Name Non-ValueAdded Classification 1.Waiting for Loading No Work/Unused Capacity/Waiting Waste 2.Supervision problem-Lack of labors Management issue/Waiting Waste Causing loss of capacity 3.Preparation Waiting Waste 4.Cleaning PM Routines/Waiting Waste-Should has an optimum amount 5.Waiting for maintenance Downtime/Waiting Waste/Capacity Reduction 6.Experiments Waiting Waste 7.Replace tools from warehouses Waiting Waste/Capacity Loss 8.Wait for inspection Waiting Waste/Capacity Loss 9.Excess Break-time (WC) Waiting Waste/Capacity Loss 10.Manufacture parts for maintenance Unplanned/Emergency Issue Cause Production Target Capacity Loss 11.Wait for CNC program Waiting Waste/Capacity Loss 12.Service for others Should have a Protocol 13.Vacations (regular, sick, injuries) Management issue/Waiting Waste/Capacity Loss 14.Drawing modification Waiting Waste/Capacity Loss 15.Rework Defect Waste/Capacity Loss 16.Wait to sharpen tools Waiting Waste/Capacity Loss 2 to 9, 11 to 14, and 16 are availability problems.
  • 13.
  • 14.
    Minor stops/issues returnto big waste and losses (see my lean mapping presentation). The big picture view is the real picture and always present the financial problem. Detailed picture focus on the operations.
  • 15.
    Plant Unavailability Working Period 32% Operation Cost TotalInvestment Additional investment “what we give investment” 68% Value Add Operation Losses 10.6% Data Box: Investment =100% Plant Availability = 32% Non-value added= 78.6% Benefit/Gain = 21.58% Operation Losses= 10.6% 21.58% Figure.1 The real picture Equipments Peoples Facilities Utilities Eng. Mohammed Hamed
  • 16.
  • 17.
    Productivity time Non-Value Added Activities 67% 33% NoWork “Wait for Loading” Supervision Issue Preparation Cleaning Operation Losses Value-add Figure 3.Losses & non-Value Adds during the Operating Time Data Box: Value add = 67% Non-value add =33% Maintenance Experiments Wait for Tools Excess break-time WC Manufacture Maintenance Parts Quality Inspection Others “CNC time, Re work, service for others, wait to sharpen tools” 992hrs 7125hrs Add value time=33212.23hrs Non-Add value time=16357hrs Operating shifts=31 shifts Actual productivity= 21 shifts No of working days= 24 3942hrs Eng. Mohammed Hamed
  • 18.
    43.65% 24.10% 9.15% 8.60% 6.00% 5.93% 2.80% 2.71% 1.90% 1.65% 4.66% Wait for Loading Supervisionissue-Lack of Labors Preparation Cleaning Wait for Maintenance Experiments Replace tools from warehouses Excess Break-time (WC) Manufacture parts for maintenance Wait for Quality Inspection Others More details: Production Downtime Analysis of June Analysis the 16357.77hrs involves all capacity reduction factors/non value add activities Eng. Mohammed Hamed
  • 19.
    Productivity time Non-Value Added Activities 41% 59% Waitfor loading Supervision Preparation Cleaning Maintenance Experiments Wait for tools 9190hrs= 41.6% 4892.25hrs= 22.2% 1369hrs= 6.2% 31677.25 22039.25 Add value time=31677hrs Non-Add value time= 22039hrs Operating shifts=33 shifts Actual productivity= 19 shifts No of working days= 25Eng. Mohammed Hamed 1510hrs= 6.8% 1384hrs= 6.8%
  • 20.
    Productivity time Non-Value Added Activities 53% 47% Waitfor loading Supervision issue Maintenance Preparation Cleaning Labors vacations Experiments Electric cut off 10967hrs= 53% 2595hrs= 12.7% 1204hrs= 6% 921hrs 23549hrs 20425hrs Add value time=20803hrs Non-Add value time= 21586hrs Operating shifts=26 shifts Actual productivity= 15 shifts No of working days= 22Eng. Mohammed Hamed 1133.5hrs= 5.5% 1109hrs= 5.4%
  • 21.
    63.00% 37.00% Productivity time Non-Value Added Activities 19879hrs 33984hrs Addvalue time=33984hrs Non-Add value time= 19879hrs Operating shifts=33 shifts Actual productivity= 21 shiftsEng. Mohammed Hamed
  • 22.
    No work/No productiontime based on machines during the operating time June 2012 July 2012 Aug 2012 Sept 2012 Total hrs 7125hrs 9190hrs 10967hrs 9580hrs % of operating time 14.7% 17% 25% 18% % of downtime 43% 41.6% 50% 48% Worst month Eng. Mohammed Hamed
  • 23.
    0% 10% 20% 30% 40% 50% 60% 70% 80% 90% 100% June July AugSept No Work "Wait for Loading" Operating time Eng. Mohammed Hamed
  • 24.
    0% 10% 20% 30% 40% 50% 60% 70% 80% 90% 100% June July AugSept No productivity time Total operating time Utilization Curve Eng. Mohammed Hamed
  • 25.
    0 10000 20000 30000 40000 50000 60000 June July AugSept Operating time Productivity curve Utilization Curve Eng. Mohammed Hamed
  • 26.
    0 20000 40000 60000 80000 100000 120000 140000 160000 180000 June July AugSept Total Available time Productivity curve Utilization Curve Eng. Mohammed Hamed
  • 28.
    82334 33212.23 16357.77 7125.75 3944.5 1497.251417.51 992.1 969.13 458.86 444.25 297.33 269.25 67.8% 21.58% 10.63% 6.18% 3.40% 1.30% 1.22% 0.86% 0.84% 0.40% 0.38% 0.26% 0.24% 0.00% 10.00% 20.00% 30.00% 40.00% 50.00% 60.00% 70.00% 0 10000 20000 30000 40000 50000 60000 70000 80000 90000 NoofHours Machines Capacity Analysis for June 2012 Actual Current Working Time 32.21% Maximum Capacity= 151200 hrs Total Possible Time 100% Non-Value Add Activities 10.63% Eng. Mohammed Hamed
  • 29.
    82334 33212.23 16357.77 7125.753944.51497.251417.51992.1 969.13458.86444.25297.33269.25760.75 67.8% 21.58% 10.63 14.32% 7.92% 3.00%2.85%2.00% 1.95% 0.93% 0.89%0.60% 0.55%1.54% 0.00% 10.00% 20.00% 30.00% 40.00% 50.00% 60.00% 70.00% 80.00% 0 10000 20000 30000 40000 50000 60000 70000 80000 90000 NoofHours Machine Capacity Analysis During the Working Time for June 2012 Actual Working/operating Time of the Plant Production Downtime=33% Eng. Mohammed Hamed
  • 30.
    Actual Production Timefor sum of machines=59%. Total Production Downtime (Production Capacity Loss)=41% 9190.75 4892.25 1510.5 1384.25 1369 649.25 406.75 239 206.05 205 1634.04 17.10% 9.10% 2.81% 2.58% 2.55% 1.21% 0.85% 0.50% 0.43% 0.43% 3.44% 0.00% 2.00% 4.00% 6.00% 8.00% 10.00% 12.00% 14.00% 16.00% 18.00% 0 1000 2000 3000 4000 5000 6000 7000 8000 9000 10000 NoofHours Machines Capacity Analysis for July 2012 Non-Value Add Activities 41% no of machines=233 Eng. Mohammed Hamed
  • 31.
    Maintenance Downtime Analysis 0 50 100 150 200 0% 5% 10% 15% 20% SM115351 S436 ZT03 S222 ZC236 5365 ST03 KG106 S411 ZM02 ZT02 S338 S344 TOP Machines with Maintenance Downtime 6% of machines present 60% of the problem 60% of downtime problem 40% of downtime problem Over 200 MachinesOnly 14 machines Eng. Mohammed Hamed
  • 32.
  • 33.
    Example for theTop Down to Maintenance Machines. Month Machine Code/Name No of days/hrs down! June 2012 SM11 The whole month S436 9 days continuous/69hrs S351 14 days continuous/95hrs S365 4 days continuous/23hrs zt03 6 days/48hrs S226 4 days/ 31.25hrs July 2012 SM11 The whole month S436 18 days continuous 5351 10 days continuous 5365 20 days continuous/147 hrs 736 7 days/49 hours S231 5 days/ 31 hours 733 6 days/ 35 hrs Operate=55 hrs Operate=33hrs Operate=168hrs Too much maintenance downtime for those machines. Really abnormal. Why? If they are waiting for spare parts, so where is the stock? Are they not needed for production so they left down and recorded as down for maintenance? Comment:
  • 34.
    EX. Wait forLoading Downtime Analysis (analyze of 7126 hrs) Top Unused machines because of “No Work”. Machine Code/Name Operating time June 2012 (‫بلدى‬ ‫مخارط‬)237 Zero (‫بلدى‬ ‫مخارط‬)235 Zero (‫بلدى‬ ‫مخارط‬)236 Zero ‫شراره‬ ‫ماكينه‬) )SM16 Zero (‫كامات‬ ‫روسى‬ ‫أوتوماتيك‬ ‫معادن‬ ‫مخرط‬)ZC201 Zero (‫كامات‬ ‫روسى‬ ‫أوتوماتيك‬ ‫معادن‬ ‫مخرط‬)ZC202 Zero (‫روسى‬ ‫كامات‬ ‫مخرط‬)ZC227 Zero (‫روسى‬ ‫كامات‬ ‫مخرط‬)ZC228 Zero )‫كامات‬ ‫مخرط‬(ZC229 Zero (‫جيثر‬ ‫كامات‬ ‫مخرط‬)ZC231 Zero Total= 10 machines July 2012 SM16, 160,225, 239, 235, zc228, zc227, zc202, zc203, zc212, zc220, zc221, zc218, 230 zero Total= 13 machines June: Approximately 8% of the machines are causing 32% of the problem July: Approximately 9% of the machines are causing 40% of the problem Or 20% of the machines are causing 60% of the problem.
  • 35.
    EX. Wait forthe Tools Downtime Analysis (Analyze of total 459 hrs) Month Machines code Waiting time (hrs) June 2012 SC701 14.5 SM01 18.75 SM04 11 ST03 20.5 ST06 20.5 ST07 16.75 SM06 12.5 SM08 13.5 Z401 12.25 Z415 12 Z427 11.75 ZC215 12.25 ZC218 12.5 ZC219 12.5 •3.5% of machines are causing 28% of the problems •Machines should never stop and wait for the tools to be got from the warehouses.
  • 36.
    Continue. Month Machines codeWaiting time (hrs) June 2012 ZC223 12.25 ZC224 11.75 ZC226 12.25 ZC237 11.75 ZC238 11.75 ZC240 12.5 ZC241 12.25 ZC242 12.75 ZC307 12 ZC701 13.25 Average per machine per day taken as 13.5/ 24 days= 35 minutes
  • 37.
    Wait for theTools Downtime Analysis (Analyze of total 407 hrs) Month Machines code Waiting time (hrs) July2012 st03 23 st05 16.75 sd05 13.25 sd03 10.75 s411 7.75 sm06 21 sm04 10.25 sm08 19.25 sm17 25 s236 15 sm01 16.75 Average per machine per day taken as 16.25/ 25 days= 39minutes
  • 38.
    EX. Preparation Analysis---accordingto rule 80/20 (analyze of 1497hrs) Month Machines code Waiting time (hrs) June 2012 S234 23.25 S235 17 S419 24.75 SM06 33.75 SM08 18.5 ST06 26.5 Z427 19.75 ZM11 19 ZM12 21.5 ZM13 12.75 ZT03 14 Z228 13 Z230 15.5 Z425 13.5 Average per machine per day= 20/24 days= 50 minutes
  • 39.
    EX. Cleaning– Analysisaccording to Rule 80/20 (analyze of 1417 hrs) Month Machines code Waiting time (hrs) June 2012 S204 12.5 S419 14.25 S431 11.75 SM04 12 SM06 12.5 SM08 13.5 ST04 11.75 ST09 12.5 Z402 12.25 Z415 12 ZC206 11.75 ZC207 11.75 ZC215 12.25 ZC218 12.5 Average per machine per day= 12/ 24 days= 30 minutes
  • 40.
    Production Downtime AnalysisUsing Rule 80/20. June 2012 July 2012 CommentNon-Added Value Activity Rule 80/20 Rule 80/20 Wait for Loading 32/8 60/19 or 40/9 The number of zero operating machines has been increased significantly from June to July Preparation 35/13 Re work 75/ 0.8 17/0.4 The same machine SM15 in both months Maintenance 60/6 57/3 Many machines re repeated in both months Wait to get tools from warehouse 28/3.5 68/5 Excess Labor break- time (WC) 18/3.5 25/14 High variation independent of working hours This proves that we can improve the wastes & the non-value added activities.
  • 41.
    Activities June JulyAug Sept 1.Waiting for Loading 130 hrs 2.Supervision problem-Lack of labors 137 hrs 323.6 3.Preparation 476 458 hrs 350.5 4.Cleaning 273 487 hrs 237 5.Waiting for maintenance 6.75 6.Experiments 53 hrs 7.Replace tools from warehouses 15.75 8.Wait for inspection 20 hrs 9.Excess Break-time (WC) 626.25 hrs 620.5 hrs 627.5 hrs 10.Manufacture parts for maintenance 376.8 hrs 572.5 hrs 276 hrs 11.Wait for CNC program 12.Service for others 444 hrs 810 hrs 389 hrs 13.Vacations (regular, sick, injuries) 2505.75 2640 hrs 3444 14.Drawing modification 12 hrs 15.Rework 10 13.5 16.Wait to sharpen tools 128 184.5 hrs 122
  • 42.
    Comparison between servicefor others time between Machines & Manual Labors. June July Aug Machines (hrs) 127.35 108 21.75 Labors (hrs) 444 810 389
  • 43.
    Measure June JulyAugust No of days absent 358 377 500 Absent percentage 13.8% 14% 21% Productivity hours 12896 12000 9548 Average no of days absent in month 3.5 3.5 4.6 0 100 200 300 400 500 600 0 2000 4000 6000 8000 10000 12000 14000 June July Aug Productivity hous No of absent days
  • 44.
    No of labors/machines June JulyAug Labors (hrs) 108 626 620 627.5 Machines (hrs) 225 442.5 206 444.25 This is an indication that something needs to be fixed. Each employee is spending around 50% extra of his original break-time. 0 100 200 300 400 500 600 700 June July Aug Labors- WC time Mahcines- WC time
  • 46.
    Machines Capacity Analysis=Actual/Design. Design Capacity= 8 hrs x 3 shifts x 28 days x no of machines (225)= 151200hrs Actual Production Target Capacity =33212.23 hrs (add value hrs). Capacity Utilization hrs =33605hrs Add Value Percentage =21.58 Actual Capacity Utilization = 21.83% We need to measure the Best Effective Capacity. Each machine should have an Effective Capacity number.
  • 47.
    Capacity Utilization ofManual Workers. Total Available Time =20736 hrs. Total Working Time = 18570 hrs. Productivity Actual Time = 12985.23 hrs. Utilization= Actual/ Total =67% (counted re work + manufacture maint parts & service for others). Add Value% = 62.62% (subtracted the one hr break in each shift). 15% no utilization due to Absent!! (2833.25 hrs). This is equal 17 labors. A Note to Consider: The total working hrs during the breaks is 592.5 hrs and has been considered. Total Available Time = 87936 hrs (counted the 1hr break) Total Working Time =49570 hrs Productivity Actual Time = 33212.23 hrs Utilization hrs = 33605 hrs Utilization =38.21%(counted services, re work, manufacture maintenance parts) Add value =37.76% Productivity Utilization of Machines (based on shift 1+2)
  • 48.
    Productivity Utilization ofMachines (based on first shift)-24 days Total Available Time = 43200 hrs (counted the 1hr break) 87% Total Working Time for the first shift =38235.41 hrs Productivity Actual Time = 22015.56 hrs Utilization hrs = 22408.56 hrs Utilization =52%(counted services, re work, manufacture maintenance parts) Add value =51% Productivity Utilization of Machines (based on second shift)-24 days Total Available Time = 43200 hrs (counted the 1hr break) 31.75% Total Working Time for the first shift =13961.25 hrs Productivity Actual Time = 11196.66hrs Utilization hrs = 11196.66 hrs Utilization =25.5%%(counted services, re work, manufacture maintenance parts) Add value =25.5% Eng. Mohammed Hamed
  • 49.
    Time hrs JuneJuly Aug 1st shift 2nd shift 1st shift 2nd shift 1st shift 2nd shift 3rd shift Available 43200 43200 45000 45000 39600 39600 39600 Operating 38235.41 13961.25 41488.5 11155.16 34975.5 6319 2691.25 Actual production 22015.56 11196.66 21778 9044.41 16146.76 5246.76 2162.25 Utilization 22408.56 11196.66 22172 9044.41 16417.76 5246.76 2162.25 This time is tricky, it includes the no work time plus all production downtimes. Time hrs June July Aug 1st shift 2nd shift 1st shift 2nd shift 1st shift 2nd shift 3rd shift Available 100% 100% 100% 100% 100% 100% 100% Operating 88.5% 32.3% 92.2% 24.8% 88.3% 16% 6.8% Actual production 51% 26% 48.4% 20% 40.7% 13.25% 5.5% Utilization 52% 26% 49.3% 20% 41.5% 13.25% 5.5% Complete figure of Operating Shifts Eng. Mohammed Hamed All the red bar is the time included the wastes & losses.
  • 50.
    0 5000 10000 15000 20000 25000 30000 35000 40000 45000 50000 June July AugustSept Available time "1st Shift" Actual Productivity Utilization Eng. Mohammed Hamed
  • 51.
    0 5000 10000 15000 20000 25000 30000 35000 40000 45000 50000 June July AugustSept Available time 2nd shift Actual Productivity Utilization Eng. Mohammed Hamed
  • 52.
    0 5000 10000 15000 20000 25000 30000 35000 40000 45000 50000 June July AugustSept Available time 3rd shift Utilization Eng. Mohammed Hamed
  • 54.
    KPI June 2012July 2012 August 2012 Sept 2012 Big Picture View Total available time 151200 151200 151200 151200 Plant Working Time 32% 34.21% 28.5% 34% Plant-Unused time 68% 65.8% 71.5% 66% Facilities Utilization 22% 20.5% 15.5% 23.06 Value added% 21.6% 20.19% 15.3% 22.08% Non-Value added% 78.41% 79.81% 84.7% 77.91% Data based on the available time in each shift Data Based on Machines Available time per shift 43200 45000 39600 39600 Machines Utilization (hrs) - First Shift 22408.56 22172 16417.76 24083.65 Machines Utilization % - First Shift 52% 49.3% 41.5% 61% Machines Utilization (hrs)–Second Shift 11196.66 9044.41 5246.76 10442.25 Machines Utilization % - Second Shift 26% 20% 13.25% 27% Machine utilization (hrs)-Third Shift NA 855.5 2691.25 964.25 Machines utilization %-Third Shift NA 1.9% 5.5% 2.5% Performance Table 2012 Eng. Mohammed Hamed
  • 55.
    KPI June 2012July 2012 August Sept Data based on the operating time/working time-Machines Total Cycle Time 49750 52650.83 43852 53863 Actual Production Capacity hrs 33212.23 31064 23545 33984 Value added % 67% 59% 53% 63.63% Utilization hrs 33605.23 31457 23690 34241.5 Utilization % 67.55% 59.75% 54% Production Downtime-Capacity Loss 16357.75 21586.84 20303 19879 Non-value added % 33% 41% 47% 36.37% No Work/No Production % 14.17% 17.1% 25% 18% Data Based on Manual Labors Total Available time 20736 21600 17776 Total Cycle Time/Operating time 18570 18199 15442 Value added hrs 12985.23 12,000 9548 Labors added value time% 62.6% 55% 53.71% Non value add hrs 5584.77 6205.6 5894 Labors non-added value % 33% 36.8% 38.16% Labors utilization hrs 13835 13387 10191.72 Labors utilization% 66% 62% 57.33%
  • 56.
    KPI June 2012July 2012 August Absent Ratio for labors 13.8% 14% 21% No of days absent for labors 358 377 500 Data Based on the Total Total Cycle Time of the Process (hrs) 68570 hrs 71901.58 hrs 59294 Overtime Cost/hrs % NA NA Overtime Cost Value NA NA Absent Rate (all employee) % 9% 11.2% 8% Quality Data Quality-Six Sigma (based on cost) 4.34 4.38 Supply Chain Data Inventory average value (EGP) 34397410.5 34277000.28 34107420.8 Inventory Stock Turns Ratio (Raw Material Warehouses) 9.77% 10.53% 13.2% Throughput time 2490.61 2310.85 1843.43 Cost/Losses Total Cost EGP 3,422,000 4,216,309 3,003,156 Overhead Cost EGP 916,000 935,171 795,741 Operation Losses Value EGP 505,781 643,140 622,547.44
  • 58.
    ITO%= Sell through/Average Inventory value. Optimum = (12:1)= 600%---minimum=200% Current situation: from JAN TO AUG (8 months) Inventory (the 2nd Waste). Eng. Mohammed Hamed •Losses here are the inventory carrying cost for long period. •The calculation above is based on the frozen value. Neither the procurement nor the finished goods inventories. •Green=OK but still not perfect. •Red=BAD Warehouse no 103 108 109 110 129 131 153 Average value (EGP) 535,158.6 25 22,523,833.4 5 7,924,122 10,595,727.9 9,816,508.2 2,045,100.6 1,231,920. 6 Sell (EGP) 99,629.48 841,593.9 1,499,816. 309 1,207,232.28 2,406,277.7 15 2,427,021.7 04 1,156,790. 856 Turnover % 18.6% 3.75% 18.93% 11.4% 24.5% 118.67% 93.9% Throughput time (days) 1308.25 6488.88 1285.43 2134.5 993.2 205.05 259.141 103, 108, 129, 153 Raw Material Warehouses. 109 Finished Product Warehouse. 110= Accessories Warehouse. 131= Finished product for magazines before assembly. Excess inventory is a big waste, do we have this problem? What is the turnover ratio?.
  • 59.
    Slow Turnover INCREASEthe Carrying Cost Carrying cost is 25-55%, if we took it 25%, then we have 13.3 Million pounds annual cost. This could raise the price of the part significantly if applied as an Overhead to the parts cost. If the plant average total cost monthly=3 million (monthly), then it could be increased to 4 million, dividing the 1 million to how many parts the plant has produced, and imagine the increase in the unit/price. The question: why we bought a 4yrs stock of raw materials? Money in the bank is taxed as profit. Perhaps buying the material was a way to reduce tax liability and increase the asset value of the company? Was there a drop in prices? Even if it was a bargain, as a risk management, never buy more than 1 yr inventory stock. Cash flow & other considerations must be taken into account. Eng. Mohammed Hamed
  • 60.
    Over production. Pull orPush, do we follow the selling through customer’s warehouses? Over processing. How many unnecessary steps we do? Defects (the 7th waste). Cost of defects + re work Do the labors get the tools by himself? Total no of hours labor has to get tools from Inventory Warehouse is 458.86hrs, this is equal 3 labors. The Losses in terms of OEE. Untapped Human Potential (the 8th waste). Quality x Performance x Availability Other losses in terms of 7 Wastes rather than Waiting& Inventory!. Motion, Transportation Needs to be investigated
  • 61.
  • 62.
    Fixed Variable Direct Cost Indirect Cost “Overhead” Operatorssalaries Raw Material Inventory Carrying Cost Spare parts Mechanical Tools Electric Consumption “partially variable” Bonuses & Overtime Hidden costs: Unused Capacity Unsafe conditions "Injuries” Technical Overheads “salaries of inspection, supervision, maintenance labors..etc” Office Overhead “Salaries of Administration, Managers, Engineers” Electric Consumption Transportation “Forklifts” Safety Tools Assets annual depreciation
  • 63.
    Overhead Details inWorkshop as percentage of total cost (in June): In direct Salaries= 11% Depreciation= 9% Electric= 2% Others (spare parts, papers,…etc)=4% Current pricing estimation system: For each WO, the part is priced according to the material + salaries + O.H this is done immediately before the parts go to the warehouse. How the accountant know the O.H that fast? He uses data from previous month for the O.H & salaries. But the martial cost is taken from the data of the same month (fresh data). For the Total Cost & O.H, he uses the fresh data (real data). But parts are being priced before goes to inventory based on the old data from the previous month. The suggestion is to make the prices comparison between the plant and the market based on average over several months with a lot of considerations. Eng. Mohammed Hamed
  • 64.
    Ex. Calc basedon June: Level of Machines Activity at Capacity=49570 machine-hours Level of Manual-Labors Activities at Capacity= 18570 labor-hours The Actual Manufacturing Overhead of the month is 26.67% from T.C (standard is 25% from DC). This means we have 37% from D.C in. (This need to be investigated). Overhead=916,000EGP (fixed + variable).....accountant dept has no sense for the fixed & variable. According to the Cost Matrix, the above Overhead has 22% Fixed O.H & there is 4-5% variable. Fixed Overhead= 752,840EGP Production Down Machines Hours=Non-Value Add Activities=16,357.77 (2767 as CNC.17%). Production Down Manual-Labor Hours=5585 The Overhead Rate per Hour= 11.05EGP Average (Accuracy of this no could be + or – 30%) Cost of production capacity reduction during the working period=242,468EGP (average) Total Monthly Cost=3,422,000 Eng. Mohammed Hamed
  • 65.
    Unused Operators Capacity(due to production downtime & no work) Average Salary Rates=12-15EGP/hr (Direct-Fixed Cost).....I take it 12 (min). Total no of Operators (assume one per machine)=229 Total Unused Machines hrs= 16357. 8, underutilization hours=15,964hrs. Cost of Unused Capacity= 196,293.6 EGP (minimum). Total Average Losses during the working time=242,468+196,293.6+67,020= 505,781 EGP Monthly Cost of downtime due to maintenance breakdowns will add the cost of Spare Parts. Cost of Underutilization (ROI). Unused Manual-Labor hrs=5585hrs, underutilization hours= 4734.77hrs. Cost of Unused Manual-Labors hrs= 67,020EGP Losses are paying 100% salary against less productivity/utilization. There is a huge saving possibility if sales are increased D. Labor Cost= 1,000,000 over 300+ average no of labors or 68140hrs working.
  • 66.
    •Unused Capacity Losses •Underutilization Losses •Operation wastes/interruptions •Having 100% fixed costs against no 100% real productivity •Muda •Quality losses Operation Losses are: Eng. Mohammed Hamed
  • 67.
    -Depreciation -Taxes & propertyinsurance -Inventory Carrying Cost: •Capital Cost •Risk •Warehouses •Transportation Eng. Mohammed Hamed
  • 68.
    Indirect & DirectCosts Analysis. Direct JUNE JULY AUG Indirect JUNE JULY AUG Salaries 1,013,000 951 946 Salaries 393K 484K 394K Material 1,493,000 2,331,000 1,261,000 Depreciation 313K 310K 309K Electricity 62 64 72 Others The significant increase in electricity in Aug need to be analyzed. Why increase? The different between the summer & the winter is understandable when comparing both group of months (Air Condition). In the depreciation, machines present more than 80% of the depreciation value. The machines that still have high depreciation value, and have the lowest rate of loading should be removed out to reduce costs, but have a look at the value analysis part in this presentation!! Eng. Mohammed Hamed
  • 70.
    A good questionis to remove them or keep them? ●Value of the space the unused machinery is taking up. ●Value of the unneeded machine(s). ●Cost of removing the unneeded machine(s) ●Forecast for needing the machines in the future - what if you sold them, then later you needed them again? ●Value of having them in case other machines break down. Eng. Mohammed Hamed
  • 71.
    ●Value of thespace the unused machinery is taking up. ●Value of the unneeded machine(s). ●Cost of removing the unneeded machine(s). ●Forecast for needing the machines in the future - what if you sold them, then later you needed them again?. ●Value of having them in case other machines break down. Meter square= 2500EGP “Not 170” Current selling price after considering the depreciation Labors cost, tools, equipments, logistic cost, process cost, time,..etc. Refer to the machine breakdown history, how many hours and the cost of productivity losses if no redundant. The cost of re buying it, time consumed till it arrive, the losses of productivity in this period Eng. Mohammed Hamed
  • 72.
    1 - Costof over time or contracted labor to replace injured personnel. 2 - Insurance cost if the incidents leading to injury are reportable / recordable, insurers will hike premiums as the premises or business practices will be deemed unsafe. 3 - Cost of differed production or rework, if the injured person(s) are technical and their absence or inability to function due to injury may affect the production quantity and or quality. 4 - In severe cases the compensation for injury, death and or environmental damage may be significant to the company to the point where the company maybe forced into bankruptcy. The costs hit the insurance rates, the cost of safety hits the overhead costs. No of Injuries=21 Majors=5 Minors=16 No of Absent Days=286 Statistical 2012 Eng. Mohammed Hamed
  • 73.
  • 74.
    •If the plantcould produce more, the price per part or per work order will be decreased. •If the plant don’t need the more product or no more orders to process, then the plant is paying for the overheads and the other fixed costs then distributing them on the product cost, this will raise the product cost and prevent the plant from achieving lower prices and making competition, thus result in decreasing the plant order (customers will find the market is cheaper). •Unused machines have much lower cost than unused operators capacity. The losses is the ROI & the depreciation (market value of equipments should be considered). •Effect of unplanned WOs, if for the same parts and increase in quantity, the price will be high because the there will be a double processing somewhere. Matter of fact is that we have 24% of the unplanned WOs are topping ones. •Increase production demand, how? find more product to produce at the customer order., never go for push!. Considerable points: The goal is to find more product to produce by increasing the sales (pull as customer need) at minimum cost or reduce price per current units. Eng. Mohammed Hamed
  • 75.
    Benefit from payingyourself to make parts: •Protection of secret processes should be considered as a value add of paying to yourself. Perhaps the real profitability is the difference between what you would need to pay someone else to make the part as opposed to what you can make it for If we considered in the parts cost the high inventory stock value the plant is currently holding, then this will raise significantly the price of the parts, will this affect the plant competition for prices comparison to the market?. In most companies increasing productivity means increasing sales, this can be done through selling to out-house customers, but we have to treat them differently from the in-house customers. There is an opportunity of productivity improvement & reduction of lead time, but we have to fulfill the free remain time with production by increasing the sales. Beer in mind the real profitability of the workshop is for the main selling product, so making the product cheaper at the central workshop will lower the main product cost/price Unless you are cheaper than the external market, this will not be considered as Lean. The main goal is to make the main company’s product at the best possible price.
  • 76.
    Why refusing someparts to make because of high prices compared to the market while I would have accepted these orders to at lest cover my expenses and reduce the losses over the previous months. Accepting customers orders till a rate of 25% different price than the market is acceptable in the current period to cover the plant expenses & overheads. 14%, 17%, and 25% no work could be fulfilled. Fixed salaries could be at least covered. Overheads could be at least covered Consuming the inventory freeze stock, reduce the 13 million losses. Reducing prices of the other parts I make if overheads & fixed costs are distributed on as many parts as I can. There is an opportunity to increase sales if the plant is open to make parts for the market but we have to deal with the customers differently and with a better way rather than the in-house customers. Eng. Mohammed Hamed
  • 78.
  • 79.
    Ex. Losses inJune 2012 due to Defect Cost. Sigma Calculation . Data: Opportunities: 3,422,000EGP Defects : 7,600EGP Results: DPMO :2221 Defects % :0.22% Yield :99.78% Process Sigma:4.34 If we assume the cost of defects is double this number=15200EGP The process Sigma then is: 4.12 (Acceptable). We need to be sure that those are the only defects Eng. Mohammed Hamed
  • 80.
    Correspond to DefectsQuantity. Sigma Calculation . Data: Opportunities: 1669438 Defects : 7833 Results: DPMO :4692 Defects % :0.47% Yield :99.53% Process Sigma:4.1 Eng. Mohammed Hamed Note: This is just for illustration. Sigma quantity based calculation should be on a group of similar/identical items.
  • 81.
    AACE International Authorityof Cost Management. Lectures from the American University in Cairo. Toyota Way book “Author Jeff K Liker”. Toyota KATA book “Author Mike Rother” Strategic Lean Mapping book “Author Steven Borris” OEE Can Be Your Key: : Change Formula for Equipment Availability to Improve Performance”, Institute of Industrial Engineers IIE Magazine, Volume 48, issue no.8, August 2013, USA. By Author “Mohammed Hamed Ahmed” Eng. Mohammed Hamed The American University in Cairo Email: mhamed206@yahoo.com : m.h.ahmed@ess.aucegypt.edu Tel: +201001309903