SlideShare a Scribd company logo
1 of 17
Bar
Comparing things
like income?
Line
Get some lengthy
data like oil prices?
Area
Want to show contents
of e.g. exports?
Map
Need to show a
country comparison?
More
Choose yours!
Data Visualization 101
One dimension Two dimensions Three+ dimensions
Bar
LineAreaPie Picto
Scatterplot
Bubble
Comparison Tendency/Relations
Comparison/
Relationships
Categories
Value=length
Most often the best choice. Good
to show differences in values that
don’t add up to 100%.
Poor choice for showing time-
series data, as the line charts
have a smoother representation.
Bar
Comparing things
like income?
100°=28%
50°=14%
55° = 15%
55°=
15%
100° =
28%
3,6° = 1%
Good for showing contrast when
two or three components of
something differ greatly in size.
Bad choice if you have more than
three variables or if their values
are similar in size.
Pie
Need to show a
country comparison?
1 icon = x
7x 4x
6x
16x
Works well with 2-3 groups of
people compared and when
differences are significant.
A line chart is a better option
with more than three groups and
when differences are small.
Picto
Need to show a
country comparison?
Time
Value
Line
Get some lengthy
data like oil prices?
Best choice for time-series data
and highlighting trends, with not
more than three sets per chart.
May be visually misleading when
attempting to show data that is
not based on time-series.
Line
Get some lengthy
data like oil prices?
Time
Value+value
Good to show how a certain
variable grows/drops relative to
others over a period of time.
Careful when choosing between
basic and stacked layouts, as
they give different impressions.
Area
Want to show contents
of e.g. exports?
Variable1
Variable 2 None
Weak
Strong
Good to find out how much one
variable depends on other e.g.
how strongly does it correlate.
Careful when choosing variables
that don’t correlate, as result can
be meaningless.
Scatter
Detect what is more
profitable
Variable1
Variable 2
Volume
More 1
More 2
Less 1
More 2
More 1
Less 2
Less 1
Less 2
The best to understand social,
economical, medical, and other
scientific relationships.
Make sure your audience can
read the chart.
Bubble
Compare values and
show relationships
#InfogramStory
Create a chart now

More Related Content

Viewers also liked

Amy Balliett, Killer Infographics: Harnessing the Power of Visual Communication
Amy Balliett, Killer Infographics: Harnessing the Power of Visual CommunicationAmy Balliett, Killer Infographics: Harnessing the Power of Visual Communication
Amy Balliett, Killer Infographics: Harnessing the Power of Visual CommunicationSeattle Interactive Conference
 
The Future of Infographics
The Future of InfographicsThe Future of Infographics
The Future of InfographicsColumn Five
 
Types of graphs
Types of graphsTypes of graphs
Types of graphsAriel Piol
 
All About Infographics in 99 Seconds
All About Infographics in 99 SecondsAll About Infographics in 99 Seconds
All About Infographics in 99 SecondsAyman Sadiq
 
Why are Infographics Important
Why are Infographics ImportantWhy are Infographics Important
Why are Infographics ImportantRobin Richards
 
Types of graphs
Types of graphsTypes of graphs
Types of graphsbweldon
 
Introduction to graph class 8
Introduction to graph class 8Introduction to graph class 8
Introduction to graph class 8Monika Rana
 
Its all about Infographics
Its all about InfographicsIts all about Infographics
Its all about InfographicsAditya Krishna
 
Infographics Key Data KPI presentation slides
Infographics Key Data KPI presentation slidesInfographics Key Data KPI presentation slides
Infographics Key Data KPI presentation slidesPeter Zvirinsky
 
24 Awesome Infographic Ideas to Inspire Your Next Beautiful Creation
24 Awesome Infographic Ideas to Inspire Your Next Beautiful Creation24 Awesome Infographic Ideas to Inspire Your Next Beautiful Creation
24 Awesome Infographic Ideas to Inspire Your Next Beautiful CreationPiktochart
 
Show Don't Tell - Creating Visually Useful Infographics For Your Audience
Show Don't Tell - Creating Visually Useful Infographics For Your AudienceShow Don't Tell - Creating Visually Useful Infographics For Your Audience
Show Don't Tell - Creating Visually Useful Infographics For Your AudienceStrataBlue
 

Viewers also liked (13)

Types of Chart
Types of ChartTypes of Chart
Types of Chart
 
Amy Balliett, Killer Infographics: Harnessing the Power of Visual Communication
Amy Balliett, Killer Infographics: Harnessing the Power of Visual CommunicationAmy Balliett, Killer Infographics: Harnessing the Power of Visual Communication
Amy Balliett, Killer Infographics: Harnessing the Power of Visual Communication
 
Infographics design
Infographics designInfographics design
Infographics design
 
The Future of Infographics
The Future of InfographicsThe Future of Infographics
The Future of Infographics
 
Types of graphs
Types of graphsTypes of graphs
Types of graphs
 
All About Infographics in 99 Seconds
All About Infographics in 99 SecondsAll About Infographics in 99 Seconds
All About Infographics in 99 Seconds
 
Why are Infographics Important
Why are Infographics ImportantWhy are Infographics Important
Why are Infographics Important
 
Types of graphs
Types of graphsTypes of graphs
Types of graphs
 
Introduction to graph class 8
Introduction to graph class 8Introduction to graph class 8
Introduction to graph class 8
 
Its all about Infographics
Its all about InfographicsIts all about Infographics
Its all about Infographics
 
Infographics Key Data KPI presentation slides
Infographics Key Data KPI presentation slidesInfographics Key Data KPI presentation slides
Infographics Key Data KPI presentation slides
 
24 Awesome Infographic Ideas to Inspire Your Next Beautiful Creation
24 Awesome Infographic Ideas to Inspire Your Next Beautiful Creation24 Awesome Infographic Ideas to Inspire Your Next Beautiful Creation
24 Awesome Infographic Ideas to Inspire Your Next Beautiful Creation
 
Show Don't Tell - Creating Visually Useful Infographics For Your Audience
Show Don't Tell - Creating Visually Useful Infographics For Your AudienceShow Don't Tell - Creating Visually Useful Infographics For Your Audience
Show Don't Tell - Creating Visually Useful Infographics For Your Audience
 

Recently uploaded

Salient features of Environment protection Act 1986.pptx
Salient features of Environment protection Act 1986.pptxSalient features of Environment protection Act 1986.pptx
Salient features of Environment protection Act 1986.pptxakshayaramakrishnan21
 
2024_Student Session 2_ Set Plan Preparation.pptx
2024_Student Session 2_ Set Plan Preparation.pptx2024_Student Session 2_ Set Plan Preparation.pptx
2024_Student Session 2_ Set Plan Preparation.pptxmansk2
 
Neurulation and the formation of the neural tube
Neurulation and the formation of the neural tubeNeurulation and the formation of the neural tube
Neurulation and the formation of the neural tubeSaadHumayun7
 
Advances in production technology of Grapes.pdf
Advances in production technology of Grapes.pdfAdvances in production technology of Grapes.pdf
Advances in production technology of Grapes.pdfDr. M. Kumaresan Hort.
 
Students, digital devices and success - Andreas Schleicher - 27 May 2024..pptx
Students, digital devices and success - Andreas Schleicher - 27 May 2024..pptxStudents, digital devices and success - Andreas Schleicher - 27 May 2024..pptx
Students, digital devices and success - Andreas Schleicher - 27 May 2024..pptxEduSkills OECD
 
Basic_QTL_Marker-assisted_Selection_Sourabh.ppt
Basic_QTL_Marker-assisted_Selection_Sourabh.pptBasic_QTL_Marker-assisted_Selection_Sourabh.ppt
Basic_QTL_Marker-assisted_Selection_Sourabh.pptSourabh Kumar
 
Open Educational Resources Primer PowerPoint
Open Educational Resources Primer PowerPointOpen Educational Resources Primer PowerPoint
Open Educational Resources Primer PowerPointELaRue0
 
Dementia (Alzheimer & vasular dementia).
Dementia (Alzheimer & vasular dementia).Dementia (Alzheimer & vasular dementia).
Dementia (Alzheimer & vasular dementia).Mohamed Rizk Khodair
 
slides CapTechTalks Webinar May 2024 Alexander Perry.pptx
slides CapTechTalks Webinar May 2024 Alexander Perry.pptxslides CapTechTalks Webinar May 2024 Alexander Perry.pptx
slides CapTechTalks Webinar May 2024 Alexander Perry.pptxCapitolTechU
 
50 ĐỀ LUYỆN THI IOE LỚP 9 - NĂM HỌC 2022-2023 (CÓ LINK HÌNH, FILE AUDIO VÀ ĐÁ...
50 ĐỀ LUYỆN THI IOE LỚP 9 - NĂM HỌC 2022-2023 (CÓ LINK HÌNH, FILE AUDIO VÀ ĐÁ...50 ĐỀ LUYỆN THI IOE LỚP 9 - NĂM HỌC 2022-2023 (CÓ LINK HÌNH, FILE AUDIO VÀ ĐÁ...
50 ĐỀ LUYỆN THI IOE LỚP 9 - NĂM HỌC 2022-2023 (CÓ LINK HÌNH, FILE AUDIO VÀ ĐÁ...Nguyen Thanh Tu Collection
 
Pragya Champions Chalice 2024 Prelims & Finals Q/A set, General Quiz
Pragya Champions Chalice 2024 Prelims & Finals Q/A set, General QuizPragya Champions Chalice 2024 Prelims & Finals Q/A set, General Quiz
Pragya Champions Chalice 2024 Prelims & Finals Q/A set, General QuizPragya - UEM Kolkata Quiz Club
 
Benefits and Challenges of Using Open Educational Resources
Benefits and Challenges of Using Open Educational ResourcesBenefits and Challenges of Using Open Educational Resources
Benefits and Challenges of Using Open Educational Resourcesdimpy50
 
size separation d pharm 1st year pharmaceutics
size separation d pharm 1st year pharmaceuticssize separation d pharm 1st year pharmaceutics
size separation d pharm 1st year pharmaceuticspragatimahajan3
 
Basic phrases for greeting and assisting costumers
Basic phrases for greeting and assisting costumersBasic phrases for greeting and assisting costumers
Basic phrases for greeting and assisting costumersPedroFerreira53928
 
[GDSC YCCE] Build with AI Online Presentation
[GDSC YCCE] Build with AI Online Presentation[GDSC YCCE] Build with AI Online Presentation
[GDSC YCCE] Build with AI Online PresentationGDSCYCCE
 
The basics of sentences session 4pptx.pptx
The basics of sentences session 4pptx.pptxThe basics of sentences session 4pptx.pptx
The basics of sentences session 4pptx.pptxheathfieldcps1
 
How to Manage Notification Preferences in the Odoo 17
How to Manage Notification Preferences in the Odoo 17How to Manage Notification Preferences in the Odoo 17
How to Manage Notification Preferences in the Odoo 17Celine George
 
IATP How-to Foreign Travel May 2024.pdff
IATP How-to Foreign Travel May 2024.pdffIATP How-to Foreign Travel May 2024.pdff
IATP How-to Foreign Travel May 2024.pdff17thcssbs2
 
UNIT – IV_PCI Complaints: Complaints and evaluation of complaints, Handling o...
UNIT – IV_PCI Complaints: Complaints and evaluation of complaints, Handling o...UNIT – IV_PCI Complaints: Complaints and evaluation of complaints, Handling o...
UNIT – IV_PCI Complaints: Complaints and evaluation of complaints, Handling o...Sayali Powar
 

Recently uploaded (20)

“O BEIJO” EM ARTE .
“O BEIJO” EM ARTE                       .“O BEIJO” EM ARTE                       .
“O BEIJO” EM ARTE .
 
Salient features of Environment protection Act 1986.pptx
Salient features of Environment protection Act 1986.pptxSalient features of Environment protection Act 1986.pptx
Salient features of Environment protection Act 1986.pptx
 
2024_Student Session 2_ Set Plan Preparation.pptx
2024_Student Session 2_ Set Plan Preparation.pptx2024_Student Session 2_ Set Plan Preparation.pptx
2024_Student Session 2_ Set Plan Preparation.pptx
 
Neurulation and the formation of the neural tube
Neurulation and the formation of the neural tubeNeurulation and the formation of the neural tube
Neurulation and the formation of the neural tube
 
Advances in production technology of Grapes.pdf
Advances in production technology of Grapes.pdfAdvances in production technology of Grapes.pdf
Advances in production technology of Grapes.pdf
 
Students, digital devices and success - Andreas Schleicher - 27 May 2024..pptx
Students, digital devices and success - Andreas Schleicher - 27 May 2024..pptxStudents, digital devices and success - Andreas Schleicher - 27 May 2024..pptx
Students, digital devices and success - Andreas Schleicher - 27 May 2024..pptx
 
Basic_QTL_Marker-assisted_Selection_Sourabh.ppt
Basic_QTL_Marker-assisted_Selection_Sourabh.pptBasic_QTL_Marker-assisted_Selection_Sourabh.ppt
Basic_QTL_Marker-assisted_Selection_Sourabh.ppt
 
Open Educational Resources Primer PowerPoint
Open Educational Resources Primer PowerPointOpen Educational Resources Primer PowerPoint
Open Educational Resources Primer PowerPoint
 
Dementia (Alzheimer & vasular dementia).
Dementia (Alzheimer & vasular dementia).Dementia (Alzheimer & vasular dementia).
Dementia (Alzheimer & vasular dementia).
 
slides CapTechTalks Webinar May 2024 Alexander Perry.pptx
slides CapTechTalks Webinar May 2024 Alexander Perry.pptxslides CapTechTalks Webinar May 2024 Alexander Perry.pptx
slides CapTechTalks Webinar May 2024 Alexander Perry.pptx
 
50 ĐỀ LUYỆN THI IOE LỚP 9 - NĂM HỌC 2022-2023 (CÓ LINK HÌNH, FILE AUDIO VÀ ĐÁ...
50 ĐỀ LUYỆN THI IOE LỚP 9 - NĂM HỌC 2022-2023 (CÓ LINK HÌNH, FILE AUDIO VÀ ĐÁ...50 ĐỀ LUYỆN THI IOE LỚP 9 - NĂM HỌC 2022-2023 (CÓ LINK HÌNH, FILE AUDIO VÀ ĐÁ...
50 ĐỀ LUYỆN THI IOE LỚP 9 - NĂM HỌC 2022-2023 (CÓ LINK HÌNH, FILE AUDIO VÀ ĐÁ...
 
Pragya Champions Chalice 2024 Prelims & Finals Q/A set, General Quiz
Pragya Champions Chalice 2024 Prelims & Finals Q/A set, General QuizPragya Champions Chalice 2024 Prelims & Finals Q/A set, General Quiz
Pragya Champions Chalice 2024 Prelims & Finals Q/A set, General Quiz
 
Benefits and Challenges of Using Open Educational Resources
Benefits and Challenges of Using Open Educational ResourcesBenefits and Challenges of Using Open Educational Resources
Benefits and Challenges of Using Open Educational Resources
 
size separation d pharm 1st year pharmaceutics
size separation d pharm 1st year pharmaceuticssize separation d pharm 1st year pharmaceutics
size separation d pharm 1st year pharmaceutics
 
Basic phrases for greeting and assisting costumers
Basic phrases for greeting and assisting costumersBasic phrases for greeting and assisting costumers
Basic phrases for greeting and assisting costumers
 
[GDSC YCCE] Build with AI Online Presentation
[GDSC YCCE] Build with AI Online Presentation[GDSC YCCE] Build with AI Online Presentation
[GDSC YCCE] Build with AI Online Presentation
 
The basics of sentences session 4pptx.pptx
The basics of sentences session 4pptx.pptxThe basics of sentences session 4pptx.pptx
The basics of sentences session 4pptx.pptx
 
How to Manage Notification Preferences in the Odoo 17
How to Manage Notification Preferences in the Odoo 17How to Manage Notification Preferences in the Odoo 17
How to Manage Notification Preferences in the Odoo 17
 
IATP How-to Foreign Travel May 2024.pdff
IATP How-to Foreign Travel May 2024.pdffIATP How-to Foreign Travel May 2024.pdff
IATP How-to Foreign Travel May 2024.pdff
 
UNIT – IV_PCI Complaints: Complaints and evaluation of complaints, Handling o...
UNIT – IV_PCI Complaints: Complaints and evaluation of complaints, Handling o...UNIT – IV_PCI Complaints: Complaints and evaluation of complaints, Handling o...
UNIT – IV_PCI Complaints: Complaints and evaluation of complaints, Handling o...
 

How to choose the right chart type or graph for your data

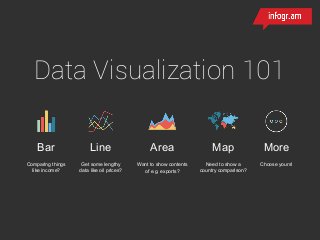
  • 1. Bar Comparing things like income? Line Get some lengthy data like oil prices? Area Want to show contents of e.g. exports? Map Need to show a country comparison? More Choose yours! Data Visualization 101
  • 2. One dimension Two dimensions Three+ dimensions Bar LineAreaPie Picto Scatterplot Bubble Comparison Tendency/Relations Comparison/ Relationships
  • 4. Most often the best choice. Good to show differences in values that don’t add up to 100%. Poor choice for showing time- series data, as the line charts have a smoother representation. Bar Comparing things like income?
  • 6. Good for showing contrast when two or three components of something differ greatly in size. Bad choice if you have more than three variables or if their values are similar in size. Pie Need to show a country comparison?
  • 7. 1 icon = x 7x 4x 6x 16x
  • 8. Works well with 2-3 groups of people compared and when differences are significant. A line chart is a better option with more than three groups and when differences are small. Picto Need to show a country comparison?
  • 10. Line Get some lengthy data like oil prices? Best choice for time-series data and highlighting trends, with not more than three sets per chart. May be visually misleading when attempting to show data that is not based on time-series. Line Get some lengthy data like oil prices?
  • 12. Good to show how a certain variable grows/drops relative to others over a period of time. Careful when choosing between basic and stacked layouts, as they give different impressions. Area Want to show contents of e.g. exports?
  • 14. Good to find out how much one variable depends on other e.g. how strongly does it correlate. Careful when choosing variables that don’t correlate, as result can be meaningless. Scatter Detect what is more profitable
  • 15. Variable1 Variable 2 Volume More 1 More 2 Less 1 More 2 More 1 Less 2 Less 1 Less 2
  • 16. The best to understand social, economical, medical, and other scientific relationships. Make sure your audience can read the chart. Bubble Compare values and show relationships