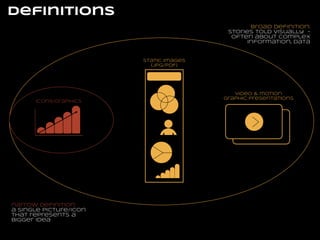
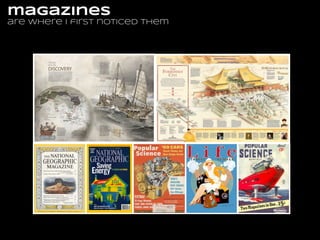
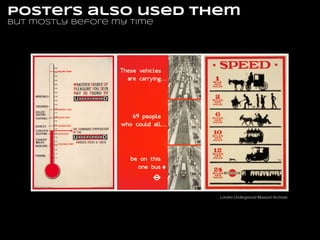
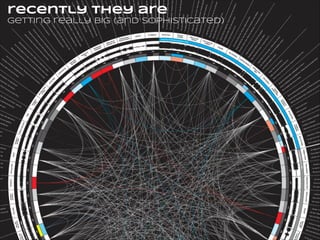
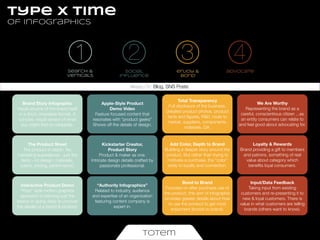
infographic
marketing basics

1

2

3
totem

4
in the future all advertising
on social media will be native,
in-stream ads. the right rail
and banners will disappear
altogether.
jan rezab
infographics
marketing basics

what

totem
infographics
are...

data

1,000 words in a

visualizations

picture

advertising in form of

the art of

a story

ideas
design & data
a perfect balance

graphic shortcuts

143

to make information easier
definitions
broad definition:
stories told visually often about complex
information, data

static images
(Jpg/PDF)

icons/graphics

narrow definition:
a single picture/icon
that represents a
bigger idea

video & motion
graphic presentations
magazines
are where i first noticed them
magazines
are where i first noticed them
posters also used them
but mostly before my time

London Underground Museum Archives
recently they are
getting really big (and sophisticated)
replacing “push”
advertising formats online

“banner ad”

“infographic”

2005

2007

2009

2011

2013

Search Volume Google
Trends, Nov 12, 2013
infographics
marketing basics

why

totem
two reasons
infographics are hot marketing tools

the volume of
information and data on
the web has exploded

consumers are more well
informed than ever,
demanding brands to be “real”

1

2
getting information off the
internet is like taking a drink
from a fire hydrant.
mitch kapor
search

social

...has lead to an
explosion in the volume
of information
available. filtering
through search results
is hard work.

...has created need for
bite sized information
which can be shared
easily within limited
time (and space)
constraint.

mobile will create more pressure
for short, sharp information bites.
in a world of
search & social clutter

great visuals
standout
visuals
are processed

60000
,

times faster
than text
we respond to visuals
its in our nature

1/2

of the brain is
active in visual
processing

90

%

of information
transmitted to the brain
is VISUAL
transparency & truth

...are expected from brands by a very,
very well informed audience online of
people who have access to just about
any information they want (and have
motivation) to find.
infographics
marketing basics

when

totem
path to purchase
typical journey
acquisition

high

awareness

low

neutral

interest
level

totem

engagement (Loyalty)
path to purchase
social support
acquisition

high

awareness

low

neutral

interest
level

totem

engagement (Loyalty)
path to purchase
social support
acquisition

engagement (Loyalty)

high

awareness

low

neutral

interest
level

1

2

3

4

Search &
verticals

social
influence

enjoy &
bond

advocate

totem
type x time
of infographics

1

2

3

4

Search &
verticals

social
influence

enjoy &
bond

advocate

Always On: Blog, SNS Posts
Brand Story Infographic
Visual resume of the brand itself
in a short, shareable format. A
concise, visual version of what
you might find on wikipedia.

Apple-Style Product
Demo Video
Feature focused content that
resonates with “product geeks”
Shows off the details of design.

Total Transparency
Full disclosure of the business.
Detailed product photos, product
facts and figures, R&D, route to
market, suppliers, components,
materials, QA.

We Are Worthy
Representing the brand as a
careful, conscientious citizen ...as
an entity consumers can relate to
and feel good about advocating for.

The Product Sheet
The product in-depth. No
marketing superlatives - just the
facts - on design, materials,
colors, pricing, performance.

Kickstarter Creator,
Product Story
Product & maker as one.
Intricate design details crafted by
passionate professional.

Add Color, Depth to Brand
Building a deeper story around the
product. But rather than trying to
motivate a purchase, the “color”
adds to loyalty and connection.

Loyalty & Rewards
Brand providing a gift to members
and patrons, something of real
value about category which
benefits loyal consumers.

Interactive Product Demo
“Prezi” style motion graphics
approach to learning just the
basics or going deep to uncover
the details of a brand & product.

“Authority Infographics”
Related to industry, audience
and expertise of an organization
featuring content company is
expert in.

Bond to Brand
Focused on after purchase use of
the product, this sort of infographic
provides greater details about how
to use the product to get most
enjoyment (bonds to brand).

Input/Data Feedback
Taking input from existing
customers and re-presenting it to
new & loyal customers. There is
value in what customers are telling
brands (others want to know).

totem
Search &
verticals

1

Brand Story Infographic
Visual resume of the brand itself
in a short, shareable format. A
concise, visual version of what
you might find on wikipedia.

Coca-Cola Corporate Timeline
Simple, clean summary of the company
and its history.

!

Link: www.behance.net/gallery/
Infographic-Coca-Cola/8129829
Search &
verticals

1

The Product Sheet
The product in-depth. No
marketing superlatives - just the
facts - on design, materials,
colors, pricing, performance.

Suggested
Retail Price

189.00

$

www.burton.com
Concept for Burton
Presented to demonstrate the concept of
“product sheet,” this shows detailed
images and features/benefits, without
marketing speak. Price and link-to-buy are
the only additional “marketing” info.

!

Link: www.behance.net/gallery/
Mountainboard-shoes/12054525
Search &
verticals

1

Interactive Product Demo
“Prezi” style motion graphics
approach to learning just the
basics or going deep to uncover
the details of a brand & product.

Cutco Knives
Created in “Prezi”, this company profile
features detailed info on the company and
how to use their products, how they are
constructed - using both still and video
contents.

!

Link: prezi.com/wef1k0djv1ku/cutco-theworlds-finest-cutlery/
social
influence

2

Apple-Style Product
Demo Video
Feature focused content that
resonates with “product geeks”
Shows off the details of design.

Apple - MacBook Pro
A detailed view of the new MacBook pro
from the inside out, showing details of
engineering and design normally left to
technical manuals, this video has geek
appeal and shows the dedication of team
behind the product.

!

Link: apple.com
social
influence

2

Kickstarter Creator,
Product Story
Product & maker as one.
Intricate design details crafted by
passionate professional.

Able Brew - Kickstarter Video
Produced for its fundraising and pre-sales
effort on Kickstarter, this video is a great
example of the documentary style videos
used by passionate creators. Big brands
should take note!

!

Link: ablebrewing.com
social
influence

2

“Authority Infographics”
Related to industry, audience
and expertise of an organization
featuring content company is
expert in.

11 Brilliant Home
Improvement Investments
By not only focusing on painting, Orlando
Painters does a nice job “soft selling”
painting as an investment in home value.

!

Link: orlandopainters.net
social
influence

2

“Authority Infographics”
Related to industry, audience
and expertise of an organization
featuring content company is
expert in.

Internet and Craigslist History
Created by a Craigslist auto marketing
firm, this infographic is dedicated to
wooing car dealers, providing background
on efforts in serving their need at each
stage of Internet growth.

!

Link: dealers.myautosearch.com
social
influence

2

“Authority Infographics”
Related to industry, audience
and expertise of an organization
featuring content company is
expert in.

A Beginner’s Guide to Wine
A compact and clear introduction to wine
by “wineinvestment.com” ...its the sort of
infographic that someone learning about
wine would want to keep as a reference
source.

!

Link: wineinvestment.com
enjoy &
bond

3

Total Transparency
Full disclosure of the business.
Detailed product photos, product
facts and figures, R&D, route to
market, suppliers, components,
materials, QA.

Everlane
Online retailer Everlane are leading the way
with infographic marketing, providing what
they call “radical transparency” about all
aspects of their business - costs of
production, logistics, details on each of the
suppliers, material selection, design...

!

Link: everlane.com
enjoy &
bond

3

Add Color, Depth to Product
Building a deeper story around the
product. But rather than trying to
motivate a purchase, the “color”
adds to loyalty and connection.

Pocket Size Coke - 375ml
History of the coke formulation and the
packaging to introduce a new size of
bottle. Celebrating a rare event (introducing
a new bottle) makes for an interesting
story.

!

Link: coca-cola.co.uk/about-us/new-375ml-coke.html
enjoy &
bond

3

Add Color, Depth to Brand
Building a deeper story around the
product. But rather than trying to
motivate a purchase, the “color”
adds to loyalty and connection.

Running a Successful Coffee Shop
Nice way for a merchant to provide a bit of
color to what they do and share a
background story with customers. Allows
patrons to take a peak behind the curtains
to see how it all works.

!

Link: javadetour.com/running-asuccessful-coffee-shop/
enjoy &
bond

3

Bond to Brand
Focused on after purchase use of
the product, this sort of infographic
provides greater details about how
to use the product to get most
enjoyment (bonds to brand).

iPhone Photography - History
Apple has an incredible ecosystem and so
both app developers and fans regularly
create content in support of the platform.
Every piece of content is an endorsement
for the iPhone and keeps user interest in
the product high.

!

Link: funnyfacescamera.com
advocate

4

We Are Worthy
Representing the brand as a
careful, conscientious citizen ...as
an entity consumers can relate to
and feel good about advocating for.

Coming Together - Coca-Cola
Infographic to visually demonstrate Coke’s
efforts at corporate responsibility, is an
accessible way to rebuff some of the
negative PR they get for selling a product
linked to weight problems.

!

Link: comingtogether.com
advocate

4

Loyalty & Rewards
Brand providing a gift to members
and patrons, something of real
value about category which
benefits loyal consumers.

Six Ways to Save on Beef
A beef marketing board provides
information to consumers to help them buy
more effectively ...and getting good value.
Its a “PSA” for beef.

!

Link: beefitswhatsfordinner.com
advocate

4

Input/Data Feedback
Taking input from existing
customers and re-presenting it to
new & loyal customers. There is
value in what customers are telling
brands (others want to know).

PriceGrabber - Power of Ratings
Using survey data they collected,
PriceGrabber constructed this infographic
to provide insight on the importance of
customer reviews and comments to the
final purchase decision.

!

Link: pricegrabber.com
advocate

4

Input/Data Feedback
Taking input from existing
customers and re-presenting it to
new & loyal customers. There is
value in what customers are telling
brands (others want to know).

United States of Yelp
Great use of data by Yelp to demonstrate
the strength of their platform. This is a
good example of providing value back to
its participants while promoting itself.

!

Link: yelp.com
infographics
marketing basics

how

totem
its about more than
just snappy visuals.
!

Gotta have a
compelling, useful
story.
the content

1

2

3

4

who’s the target
audience

think like
an editor

develop a brand
personality

get the
basics right

!

Have a clear profile of who
you are going to be talking
to.

!
!

What questions do they
want answers for?

!
!
What do they care about?
!
!
What jobs do they need
done?

!
!

How can you help them
look good, be smarter, be
better at what they do?

!

Tell a good story. Make it
compelling.

!
!

Have a content plan ...plan
for more than just one
“story telling unit”

!
!

Have a focused idea and
stick to it.

!
!

Be creative, surprising and
provocative - capture
attention.

!
!
Get a scoop.
!
!

Be original, be first to
uncover a new idea.

!

!

Be clear on who you are as
a brand, what you stand
for.

Review to see that you
have made one point
crystal clear.

Use your infographic to
reveal your brand
personality ...or as a way to
develop your ID.

Get good data and fact
check it.

!
!
!
!

Let the brand personality
speak for itself. Dont just
“slap” the brand, logo all
over the infographic.

!

!
!
!
!

Format for sharing
(dimensions, file type and
format).

!
!

Make sure its shareable on
the networks that matter for
you (Facebook, Twitter,
Pinterest, mobile, email)

!
!
social media sharing

1. publish to
your blog

!

And then spread the message
by Twitter, Facebook and other
relevant social networks based
on your priority and ranking of
each.

2. schedule a
rollout of
tweets

3. move to
facebook,
Google

Each tweet can highlight
one specific fact from your
infographic in small,
compelling bits. Link back to
infographic.

Adapt process from Twitter,
with mix of visual and text.
Look to build around each
bit of information and tie-in
to related contents.
Add value!

!

!

4. go visual

!

Push the infographic
and pieces of it to
visual networks
(Pinterest, Tumbler
and Flickr).
list on directories
top five

1
2
3
4
5

infographr.tumblr.com

infographicsbin.tumblr.com

next five
6. infosthetics.com

iheartinfographics.tumblr.com

fastcompany.com/tag/infographic

visual.ly

!
7.
!
8.
!
9.
!

coolinfographics.com
theinfographics.blogspot.co.uk
dailyinfographic.com

10. infographicsshowcase.com
enroll media support

1
2

Write a press release to accompany your infographic. This is a good test in making
sure you have created something which is “remarkable” in that it forces you to answer
the question of whether or not it is newsworthy.

3

Find people on Twitter who have an interest in and authority over the area. Pass your
information on to them by direct message. Together with the graphics, make sure you
pass on a sense of “first view” privilege and rights to spread it.

!
!

Enlist the support of bloggers and media to help spread your story (infographic). Send
them an email with press release and graphics - giving clear permission to republish.

!
!
whats
Next?
where is this
headed?
infographics
part of a bigger movement

the infographic “movement” represents a
broader trend of more dialogue between
brands and audiences.
!
while infographics as a unit of story
telling may soon peak and loose impact,
the move to story telling is a much
longer term trend.
story-telling
in advertising is back
Its not just
infographics...
marketers are
responding with
more depth,
detail in ads

1958 Ad for Rolls-Royce by Ogilvy

March 2012 Newsweek Mad Men Issue
are we headed
further back to the future?

Sao Paulo ad agency Moma Propaganda created a wondeful series of retro future ads for Facebook,
YouTube and Skype as part of the “Everything Ages Fast” ad campaign for Maximidia Seminars.
totem
media

Thank you
图
腾
email

chris@totemmedia.net
infographics in

china

bonus
its still very early days for infographics
in china. while they are popular with
media and inspired individuals, they are
not yet being used fully by brands for
marketing.
!
push marketing is still relatively more
important in china for building into lower
tier markets …
!
but for premium brands in top tier
markets, infographics should take
off in 2014.
china infographics playbook

1. publish to
your blog
(or site)

!

And then spread the message
by Weibo, WeChat and other
relevant social networks based
on your priority and ranking of
each.

2. schedule
a rollout
of ‘posts’

3. move to
other sns

Each ‘post’ can highlight
one specific fact from your
infographic in small,
compelling bits. Link back to
infographic (blog).

Adapt process from Weibo/
WeChat …on Renren,
Douban, Tumblr… Look to
build around each bit of
information and tie-in to
related contents.

!

!

4. go
vertical

!

Push the infographic
and pieces of it to
specialised industry,
category verticals.
list on directories
top five in china

1
2
3
4
5

dooyea.com

douban.com/group/infographics

huaban.com

itongji.cn/infographics

kcis.cn/category/infographic
type x time
of infographics

1

2 from 4
3
cases

Search &
verticals

china
social
influence

enjoy &
bond

advocate

Brand Story Infographic
Visual resume of the brand itself
in a short, shareable format. A
concise, visual version of what
you might find on wikipedia.

Apple-Style Product
Demo Video
Feature focused content that
resonates with “product geeks”
Shows off the details of design.

Total Transparency
Full disclosure of the business.
Detailed product photos, product
facts and figures, R&D, route to
market, suppliers, components,
materials, QA.

We Are Worthy
Representing the brand as a
careful, conscientious citizen ...as
an entity consumers can relate to
and feel good about advocating for.

The Product Sheet
The product in-depth. No
marketing superlatives - just the
facts - on design, materials,
colors, pricing, performance.

Kickstarter Creator,
Product Story
Product & maker as one.
Intricate design details crafted by
passionate professional.

Add Color, Depth to Brand
Building a deeper story around the
product. But rather than trying to
motivate a purchase, the “color”
adds to loyalty and connection.

Loyalty & Rewards
Brand providing a gift to members
and patrons, something of real
value about category which
benefits loyal consumers.

Interactive Product Demo
“Prezi” style motion graphics
approach to learning just the
basics or going deep to uncover
the details of a brand & product.

“Authority Infographics”
Related to industry, audience
and expertise of an organization
featuring content company is
expert in.

Bond to Brand
Focused on after purchase use of
the product, this sort of infographic
provides greater details about how
to use the product to get most
enjoyment (bonds to brand).

Input/Data Feedback
Taking input from existing
customers and re-presenting it to
new & loyal customers. There is
value in what customers are telling
brands (others want to know).

totem
Search &
verticals

1

Brand Story Infographic
Visual resume of the brand itself
in a short, shareable format. A
concise, visual version of what
you might find on wikipedia.

Elements of the Unilever Brand
Detailed breakdown of the visual
elements of the Unilever brand. It serves
to tell a story of what the company does
and where its from.

!

Link: http://weibo.com/1258811194/
AgLrYtWPi?mod=weibotime
social
influence

2

Apple-Style Product
Demo Video
Feature focused content that
resonates with “product geeks”
Shows off the details of design.

Nokia Lumia 920
A video showcase of the “making of
Lumia” from the inside out. Clearly a page
out of Apple’s marketing playbook.

!

Link: v.youku.com/v_show/
id_XNDk4NzlxMTM.html
social
influence

2

“Authority Infographics”
Related to industry, audience
and expertise of an organization
featuring content company is
expert in.

Beginners Guide to Sushi
A visual guide put together by a seafood
restaurant to educate first-time sushi
eaters. Adapted from “Blu on the Avenue”
restaurant.

!

Link: weibo.com/1258811194/
AlVRnoL9B?mod=weibotime
enjoy &
bond

3

Add Color, Depth to Product
Building a deeper story around the
product. But rather than trying to
motivate a purchase, the “color”
adds to loyalty and connection.

Evolution of Nokia from 1984
Nokia put this infographic together to
showcase how their mobile phones have
evolved over the last three decades.

!

Link: http://huaban.com/pins/88937137/
enjoy &
bond

3

Add Color, Depth to Product
Building a deeper story around the
product. But rather than trying to
motivate a purchase, the “color”
adds to loyalty and connection.

Google’s M&A History
On a higher level the relationships between
Google’s subsidiaries and departments are
mapped out, allowing users to get an idea
of how the whole ecosystem works
together.

!

Link: huaban.com/pins/29616310/
enjoy &
bond

3

Bond to Brand
Focused on after purchase use of
the product, this sort of infographic
provides greater details about how
to use the product to get most
enjoyment (bonds to brand).

What is WeChat
A line-up of all the different functions and
tools available in Tencent’s WeChat app.

!
!
!

Link: http://www.niubiseo.cn/a/
201303/10373.html
advocate

4

Input/Data Feedback
Taking input from existing
customers and re-presenting it to
new & loyal customers. There is
value in what customers are telling
brands (others want to know).

What do Travellers Want?
Survey results showing what services and
details customers are looking for while
staying at hotels.

!
!

Link: http://huaban.com/pins/123754110/
advocate

4

Input/Data Feedback
Taking input from existing
customers and re-presenting it to
new & loyal customers. There is
value in what customers are telling
brands (others want to know).

Pod Inn & WeChat Study
Using survey data, Pod Inn utilized this
infographic to show the reasons and
convenience behind booking on WeChat.

!

Link: http://huaban.com/pins/74850639/
图
腾
email

chris@totemmedia.net

Infographics Intro

  • 1.
  • 2.
    in the futureall advertising on social media will be native, in-stream ads. the right rail and banners will disappear altogether. jan rezab
  • 3.
  • 4.
    infographics are... data 1,000 words ina visualizations picture advertising in form of the art of a story ideas
  • 5.
    design & data aperfect balance graphic shortcuts 143 to make information easier
  • 6.
    definitions broad definition: stories toldvisually often about complex information, data static images (Jpg/PDF) icons/graphics narrow definition: a single picture/icon that represents a bigger idea video & motion graphic presentations
  • 7.
    magazines are where ifirst noticed them
  • 8.
    magazines are where ifirst noticed them
  • 9.
    posters also usedthem but mostly before my time London Underground Museum Archives
  • 10.
    recently they are gettingreally big (and sophisticated)
  • 11.
    replacing “push” advertising formatsonline “banner ad” “infographic” 2005 2007 2009 2011 2013 Search Volume Google Trends, Nov 12, 2013
  • 12.
  • 13.
    two reasons infographics arehot marketing tools the volume of information and data on the web has exploded consumers are more well informed than ever, demanding brands to be “real” 1 2
  • 14.
    getting information offthe internet is like taking a drink from a fire hydrant. mitch kapor
  • 15.
    search social ...has lead toan explosion in the volume of information available. filtering through search results is hard work. ...has created need for bite sized information which can be shared easily within limited time (and space) constraint. mobile will create more pressure for short, sharp information bites.
  • 16.
    in a worldof search & social clutter great visuals standout
  • 17.
  • 18.
    we respond tovisuals its in our nature 1/2 of the brain is active in visual processing 90 % of information transmitted to the brain is VISUAL
  • 19.
    transparency & truth ...areexpected from brands by a very, very well informed audience online of people who have access to just about any information they want (and have motivation) to find.
  • 20.
  • 21.
    path to purchase typicaljourney acquisition high awareness low neutral interest level totem engagement (Loyalty)
  • 22.
    path to purchase socialsupport acquisition high awareness low neutral interest level totem engagement (Loyalty)
  • 23.
    path to purchase socialsupport acquisition engagement (Loyalty) high awareness low neutral interest level 1 2 3 4 Search & verticals social influence enjoy & bond advocate totem
  • 24.
    type x time ofinfographics 1 2 3 4 Search & verticals social influence enjoy & bond advocate Always On: Blog, SNS Posts Brand Story Infographic Visual resume of the brand itself in a short, shareable format. A concise, visual version of what you might find on wikipedia. Apple-Style Product Demo Video Feature focused content that resonates with “product geeks” Shows off the details of design. Total Transparency Full disclosure of the business. Detailed product photos, product facts and figures, R&D, route to market, suppliers, components, materials, QA. We Are Worthy Representing the brand as a careful, conscientious citizen ...as an entity consumers can relate to and feel good about advocating for. The Product Sheet The product in-depth. No marketing superlatives - just the facts - on design, materials, colors, pricing, performance. Kickstarter Creator, Product Story Product & maker as one. Intricate design details crafted by passionate professional. Add Color, Depth to Brand Building a deeper story around the product. But rather than trying to motivate a purchase, the “color” adds to loyalty and connection. Loyalty & Rewards Brand providing a gift to members and patrons, something of real value about category which benefits loyal consumers. Interactive Product Demo “Prezi” style motion graphics approach to learning just the basics or going deep to uncover the details of a brand & product. “Authority Infographics” Related to industry, audience and expertise of an organization featuring content company is expert in. Bond to Brand Focused on after purchase use of the product, this sort of infographic provides greater details about how to use the product to get most enjoyment (bonds to brand). Input/Data Feedback Taking input from existing customers and re-presenting it to new & loyal customers. There is value in what customers are telling brands (others want to know). totem
  • 25.
    Search & verticals 1 Brand StoryInfographic Visual resume of the brand itself in a short, shareable format. A concise, visual version of what you might find on wikipedia. Coca-Cola Corporate Timeline Simple, clean summary of the company and its history. ! Link: www.behance.net/gallery/ Infographic-Coca-Cola/8129829
  • 26.
    Search & verticals 1 The ProductSheet The product in-depth. No marketing superlatives - just the facts - on design, materials, colors, pricing, performance. Suggested Retail Price 189.00 $ www.burton.com Concept for Burton Presented to demonstrate the concept of “product sheet,” this shows detailed images and features/benefits, without marketing speak. Price and link-to-buy are the only additional “marketing” info. ! Link: www.behance.net/gallery/ Mountainboard-shoes/12054525
  • 27.
    Search & verticals 1 Interactive ProductDemo “Prezi” style motion graphics approach to learning just the basics or going deep to uncover the details of a brand & product. Cutco Knives Created in “Prezi”, this company profile features detailed info on the company and how to use their products, how they are constructed - using both still and video contents. ! Link: prezi.com/wef1k0djv1ku/cutco-theworlds-finest-cutlery/
  • 28.
    social influence 2 Apple-Style Product Demo Video Featurefocused content that resonates with “product geeks” Shows off the details of design. Apple - MacBook Pro A detailed view of the new MacBook pro from the inside out, showing details of engineering and design normally left to technical manuals, this video has geek appeal and shows the dedication of team behind the product. ! Link: apple.com
  • 29.
    social influence 2 Kickstarter Creator, Product Story Product& maker as one. Intricate design details crafted by passionate professional. Able Brew - Kickstarter Video Produced for its fundraising and pre-sales effort on Kickstarter, this video is a great example of the documentary style videos used by passionate creators. Big brands should take note! ! Link: ablebrewing.com
  • 30.
    social influence 2 “Authority Infographics” Related toindustry, audience and expertise of an organization featuring content company is expert in. 11 Brilliant Home Improvement Investments By not only focusing on painting, Orlando Painters does a nice job “soft selling” painting as an investment in home value. ! Link: orlandopainters.net
  • 31.
    social influence 2 “Authority Infographics” Related toindustry, audience and expertise of an organization featuring content company is expert in. Internet and Craigslist History Created by a Craigslist auto marketing firm, this infographic is dedicated to wooing car dealers, providing background on efforts in serving their need at each stage of Internet growth. ! Link: dealers.myautosearch.com
  • 32.
    social influence 2 “Authority Infographics” Related toindustry, audience and expertise of an organization featuring content company is expert in. A Beginner’s Guide to Wine A compact and clear introduction to wine by “wineinvestment.com” ...its the sort of infographic that someone learning about wine would want to keep as a reference source. ! Link: wineinvestment.com
  • 33.
    enjoy & bond 3 Total Transparency Fulldisclosure of the business. Detailed product photos, product facts and figures, R&D, route to market, suppliers, components, materials, QA. Everlane Online retailer Everlane are leading the way with infographic marketing, providing what they call “radical transparency” about all aspects of their business - costs of production, logistics, details on each of the suppliers, material selection, design... ! Link: everlane.com
  • 34.
    enjoy & bond 3 Add Color,Depth to Product Building a deeper story around the product. But rather than trying to motivate a purchase, the “color” adds to loyalty and connection. Pocket Size Coke - 375ml History of the coke formulation and the packaging to introduce a new size of bottle. Celebrating a rare event (introducing a new bottle) makes for an interesting story. ! Link: coca-cola.co.uk/about-us/new-375ml-coke.html
  • 35.
    enjoy & bond 3 Add Color,Depth to Brand Building a deeper story around the product. But rather than trying to motivate a purchase, the “color” adds to loyalty and connection. Running a Successful Coffee Shop Nice way for a merchant to provide a bit of color to what they do and share a background story with customers. Allows patrons to take a peak behind the curtains to see how it all works. ! Link: javadetour.com/running-asuccessful-coffee-shop/
  • 36.
    enjoy & bond 3 Bond toBrand Focused on after purchase use of the product, this sort of infographic provides greater details about how to use the product to get most enjoyment (bonds to brand). iPhone Photography - History Apple has an incredible ecosystem and so both app developers and fans regularly create content in support of the platform. Every piece of content is an endorsement for the iPhone and keeps user interest in the product high. ! Link: funnyfacescamera.com
  • 37.
    advocate 4 We Are Worthy Representingthe brand as a careful, conscientious citizen ...as an entity consumers can relate to and feel good about advocating for. Coming Together - Coca-Cola Infographic to visually demonstrate Coke’s efforts at corporate responsibility, is an accessible way to rebuff some of the negative PR they get for selling a product linked to weight problems. ! Link: comingtogether.com
  • 38.
    advocate 4 Loyalty & Rewards Brandproviding a gift to members and patrons, something of real value about category which benefits loyal consumers. Six Ways to Save on Beef A beef marketing board provides information to consumers to help them buy more effectively ...and getting good value. Its a “PSA” for beef. ! Link: beefitswhatsfordinner.com
  • 39.
    advocate 4 Input/Data Feedback Taking inputfrom existing customers and re-presenting it to new & loyal customers. There is value in what customers are telling brands (others want to know). PriceGrabber - Power of Ratings Using survey data they collected, PriceGrabber constructed this infographic to provide insight on the importance of customer reviews and comments to the final purchase decision. ! Link: pricegrabber.com
  • 40.
    advocate 4 Input/Data Feedback Taking inputfrom existing customers and re-presenting it to new & loyal customers. There is value in what customers are telling brands (others want to know). United States of Yelp Great use of data by Yelp to demonstrate the strength of their platform. This is a good example of providing value back to its participants while promoting itself. ! Link: yelp.com
  • 41.
  • 42.
    its about morethan just snappy visuals. ! Gotta have a compelling, useful story.
  • 43.
    the content 1 2 3 4 who’s thetarget audience think like an editor develop a brand personality get the basics right ! Have a clear profile of who you are going to be talking to. ! ! What questions do they want answers for? ! ! What do they care about? ! ! What jobs do they need done? ! ! How can you help them look good, be smarter, be better at what they do? ! Tell a good story. Make it compelling. ! ! Have a content plan ...plan for more than just one “story telling unit” ! ! Have a focused idea and stick to it. ! ! Be creative, surprising and provocative - capture attention. ! ! Get a scoop. ! ! Be original, be first to uncover a new idea. ! ! Be clear on who you are as a brand, what you stand for. Review to see that you have made one point crystal clear. Use your infographic to reveal your brand personality ...or as a way to develop your ID. Get good data and fact check it. ! ! ! ! Let the brand personality speak for itself. Dont just “slap” the brand, logo all over the infographic. ! ! ! ! ! Format for sharing (dimensions, file type and format). ! ! Make sure its shareable on the networks that matter for you (Facebook, Twitter, Pinterest, mobile, email) ! !
  • 44.
    social media sharing 1.publish to your blog ! And then spread the message by Twitter, Facebook and other relevant social networks based on your priority and ranking of each. 2. schedule a rollout of tweets 3. move to facebook, Google Each tweet can highlight one specific fact from your infographic in small, compelling bits. Link back to infographic. Adapt process from Twitter, with mix of visual and text. Look to build around each bit of information and tie-in to related contents. Add value! ! ! 4. go visual ! Push the infographic and pieces of it to visual networks (Pinterest, Tumbler and Flickr).
  • 45.
    list on directories topfive 1 2 3 4 5 infographr.tumblr.com infographicsbin.tumblr.com next five 6. infosthetics.com iheartinfographics.tumblr.com fastcompany.com/tag/infographic visual.ly ! 7. ! 8. ! 9. ! coolinfographics.com theinfographics.blogspot.co.uk dailyinfographic.com 10. infographicsshowcase.com
  • 46.
    enroll media support 1 2 Writea press release to accompany your infographic. This is a good test in making sure you have created something which is “remarkable” in that it forces you to answer the question of whether or not it is newsworthy. 3 Find people on Twitter who have an interest in and authority over the area. Pass your information on to them by direct message. Together with the graphics, make sure you pass on a sense of “first view” privilege and rights to spread it. ! ! Enlist the support of bloggers and media to help spread your story (infographic). Send them an email with press release and graphics - giving clear permission to republish. ! !
  • 47.
  • 48.
    infographics part of abigger movement the infographic “movement” represents a broader trend of more dialogue between brands and audiences. ! while infographics as a unit of story telling may soon peak and loose impact, the move to story telling is a much longer term trend.
  • 49.
    story-telling in advertising isback Its not just infographics... marketers are responding with more depth, detail in ads 1958 Ad for Rolls-Royce by Ogilvy March 2012 Newsweek Mad Men Issue
  • 50.
    are we headed furtherback to the future? Sao Paulo ad agency Moma Propaganda created a wondeful series of retro future ads for Facebook, YouTube and Skype as part of the “Everything Ages Fast” ad campaign for Maximidia Seminars.
  • 51.
  • 52.
  • 53.
  • 54.
    its still veryearly days for infographics in china. while they are popular with media and inspired individuals, they are not yet being used fully by brands for marketing. ! push marketing is still relatively more important in china for building into lower tier markets … ! but for premium brands in top tier markets, infographics should take off in 2014.
  • 55.
    china infographics playbook 1.publish to your blog (or site) ! And then spread the message by Weibo, WeChat and other relevant social networks based on your priority and ranking of each. 2. schedule a rollout of ‘posts’ 3. move to other sns Each ‘post’ can highlight one specific fact from your infographic in small, compelling bits. Link back to infographic (blog). Adapt process from Weibo/ WeChat …on Renren, Douban, Tumblr… Look to build around each bit of information and tie-in to related contents. ! ! 4. go vertical ! Push the infographic and pieces of it to specialised industry, category verticals.
  • 56.
    list on directories topfive in china 1 2 3 4 5 dooyea.com douban.com/group/infographics huaban.com itongji.cn/infographics kcis.cn/category/infographic
  • 57.
    type x time ofinfographics 1 2 from 4 3 cases Search & verticals china social influence enjoy & bond advocate Brand Story Infographic Visual resume of the brand itself in a short, shareable format. A concise, visual version of what you might find on wikipedia. Apple-Style Product Demo Video Feature focused content that resonates with “product geeks” Shows off the details of design. Total Transparency Full disclosure of the business. Detailed product photos, product facts and figures, R&D, route to market, suppliers, components, materials, QA. We Are Worthy Representing the brand as a careful, conscientious citizen ...as an entity consumers can relate to and feel good about advocating for. The Product Sheet The product in-depth. No marketing superlatives - just the facts - on design, materials, colors, pricing, performance. Kickstarter Creator, Product Story Product & maker as one. Intricate design details crafted by passionate professional. Add Color, Depth to Brand Building a deeper story around the product. But rather than trying to motivate a purchase, the “color” adds to loyalty and connection. Loyalty & Rewards Brand providing a gift to members and patrons, something of real value about category which benefits loyal consumers. Interactive Product Demo “Prezi” style motion graphics approach to learning just the basics or going deep to uncover the details of a brand & product. “Authority Infographics” Related to industry, audience and expertise of an organization featuring content company is expert in. Bond to Brand Focused on after purchase use of the product, this sort of infographic provides greater details about how to use the product to get most enjoyment (bonds to brand). Input/Data Feedback Taking input from existing customers and re-presenting it to new & loyal customers. There is value in what customers are telling brands (others want to know). totem
  • 58.
    Search & verticals 1 Brand StoryInfographic Visual resume of the brand itself in a short, shareable format. A concise, visual version of what you might find on wikipedia. Elements of the Unilever Brand Detailed breakdown of the visual elements of the Unilever brand. It serves to tell a story of what the company does and where its from. ! Link: http://weibo.com/1258811194/ AgLrYtWPi?mod=weibotime
  • 59.
    social influence 2 Apple-Style Product Demo Video Featurefocused content that resonates with “product geeks” Shows off the details of design. Nokia Lumia 920 A video showcase of the “making of Lumia” from the inside out. Clearly a page out of Apple’s marketing playbook. ! Link: v.youku.com/v_show/ id_XNDk4NzlxMTM.html
  • 60.
    social influence 2 “Authority Infographics” Related toindustry, audience and expertise of an organization featuring content company is expert in. Beginners Guide to Sushi A visual guide put together by a seafood restaurant to educate first-time sushi eaters. Adapted from “Blu on the Avenue” restaurant. ! Link: weibo.com/1258811194/ AlVRnoL9B?mod=weibotime
  • 61.
    enjoy & bond 3 Add Color,Depth to Product Building a deeper story around the product. But rather than trying to motivate a purchase, the “color” adds to loyalty and connection. Evolution of Nokia from 1984 Nokia put this infographic together to showcase how their mobile phones have evolved over the last three decades. ! Link: http://huaban.com/pins/88937137/
  • 62.
    enjoy & bond 3 Add Color,Depth to Product Building a deeper story around the product. But rather than trying to motivate a purchase, the “color” adds to loyalty and connection. Google’s M&A History On a higher level the relationships between Google’s subsidiaries and departments are mapped out, allowing users to get an idea of how the whole ecosystem works together. ! Link: huaban.com/pins/29616310/
  • 63.
    enjoy & bond 3 Bond toBrand Focused on after purchase use of the product, this sort of infographic provides greater details about how to use the product to get most enjoyment (bonds to brand). What is WeChat A line-up of all the different functions and tools available in Tencent’s WeChat app. ! ! ! Link: http://www.niubiseo.cn/a/ 201303/10373.html
  • 64.
    advocate 4 Input/Data Feedback Taking inputfrom existing customers and re-presenting it to new & loyal customers. There is value in what customers are telling brands (others want to know). What do Travellers Want? Survey results showing what services and details customers are looking for while staying at hotels. ! ! Link: http://huaban.com/pins/123754110/
  • 65.
    advocate 4 Input/Data Feedback Taking inputfrom existing customers and re-presenting it to new & loyal customers. There is value in what customers are telling brands (others want to know). Pod Inn & WeChat Study Using survey data, Pod Inn utilized this infographic to show the reasons and convenience behind booking on WeChat. ! Link: http://huaban.com/pins/74850639/
  • 66.