Downloaded 481 times


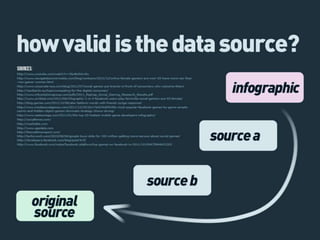
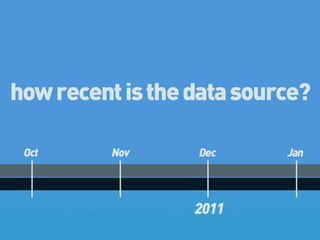

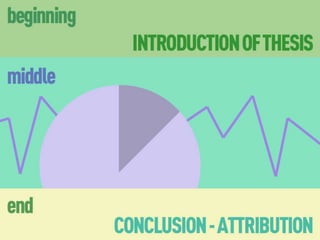


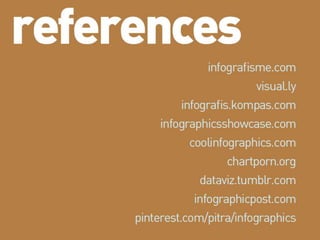


The document outlines key principles for effectively using data, including verifying sources, ensuring data is recent, and minimizing excessive information. It emphasizes structuring stories with a clear beginning, middle, and end, while distinguishing between data and design for clarity. Additionally, it provides references for infographic resources to aid in the presentation of data.


![Infographics for Marketing & Communication [White Paper]](https://cdn.slidesharecdn.com/ss_thumbnails/whitepaperinfographics-130904042249--thumbnail.jpg?width=640&height=640&fit=bounds)


