Download to read offline


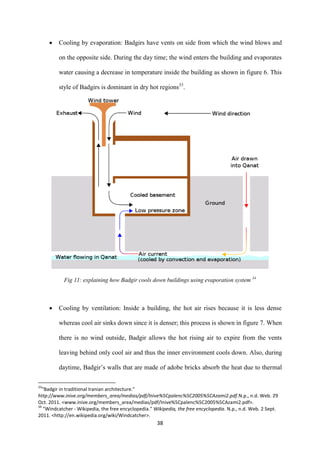
![10
emitted by the sun. Also, the humidity is very low because the water surfaces are limited and
the average annual raining is very low. These regions are therefore very suitable for the use of
Badgirs since conditions needed to maximise evaporation are available.
2.5 Entropy
The second law of Thermodynamics states that the total entropy29
of the universe is always
increasing. Even if there is a decrease in entropy within a system, it still causes an increase in
universe entropy30
.
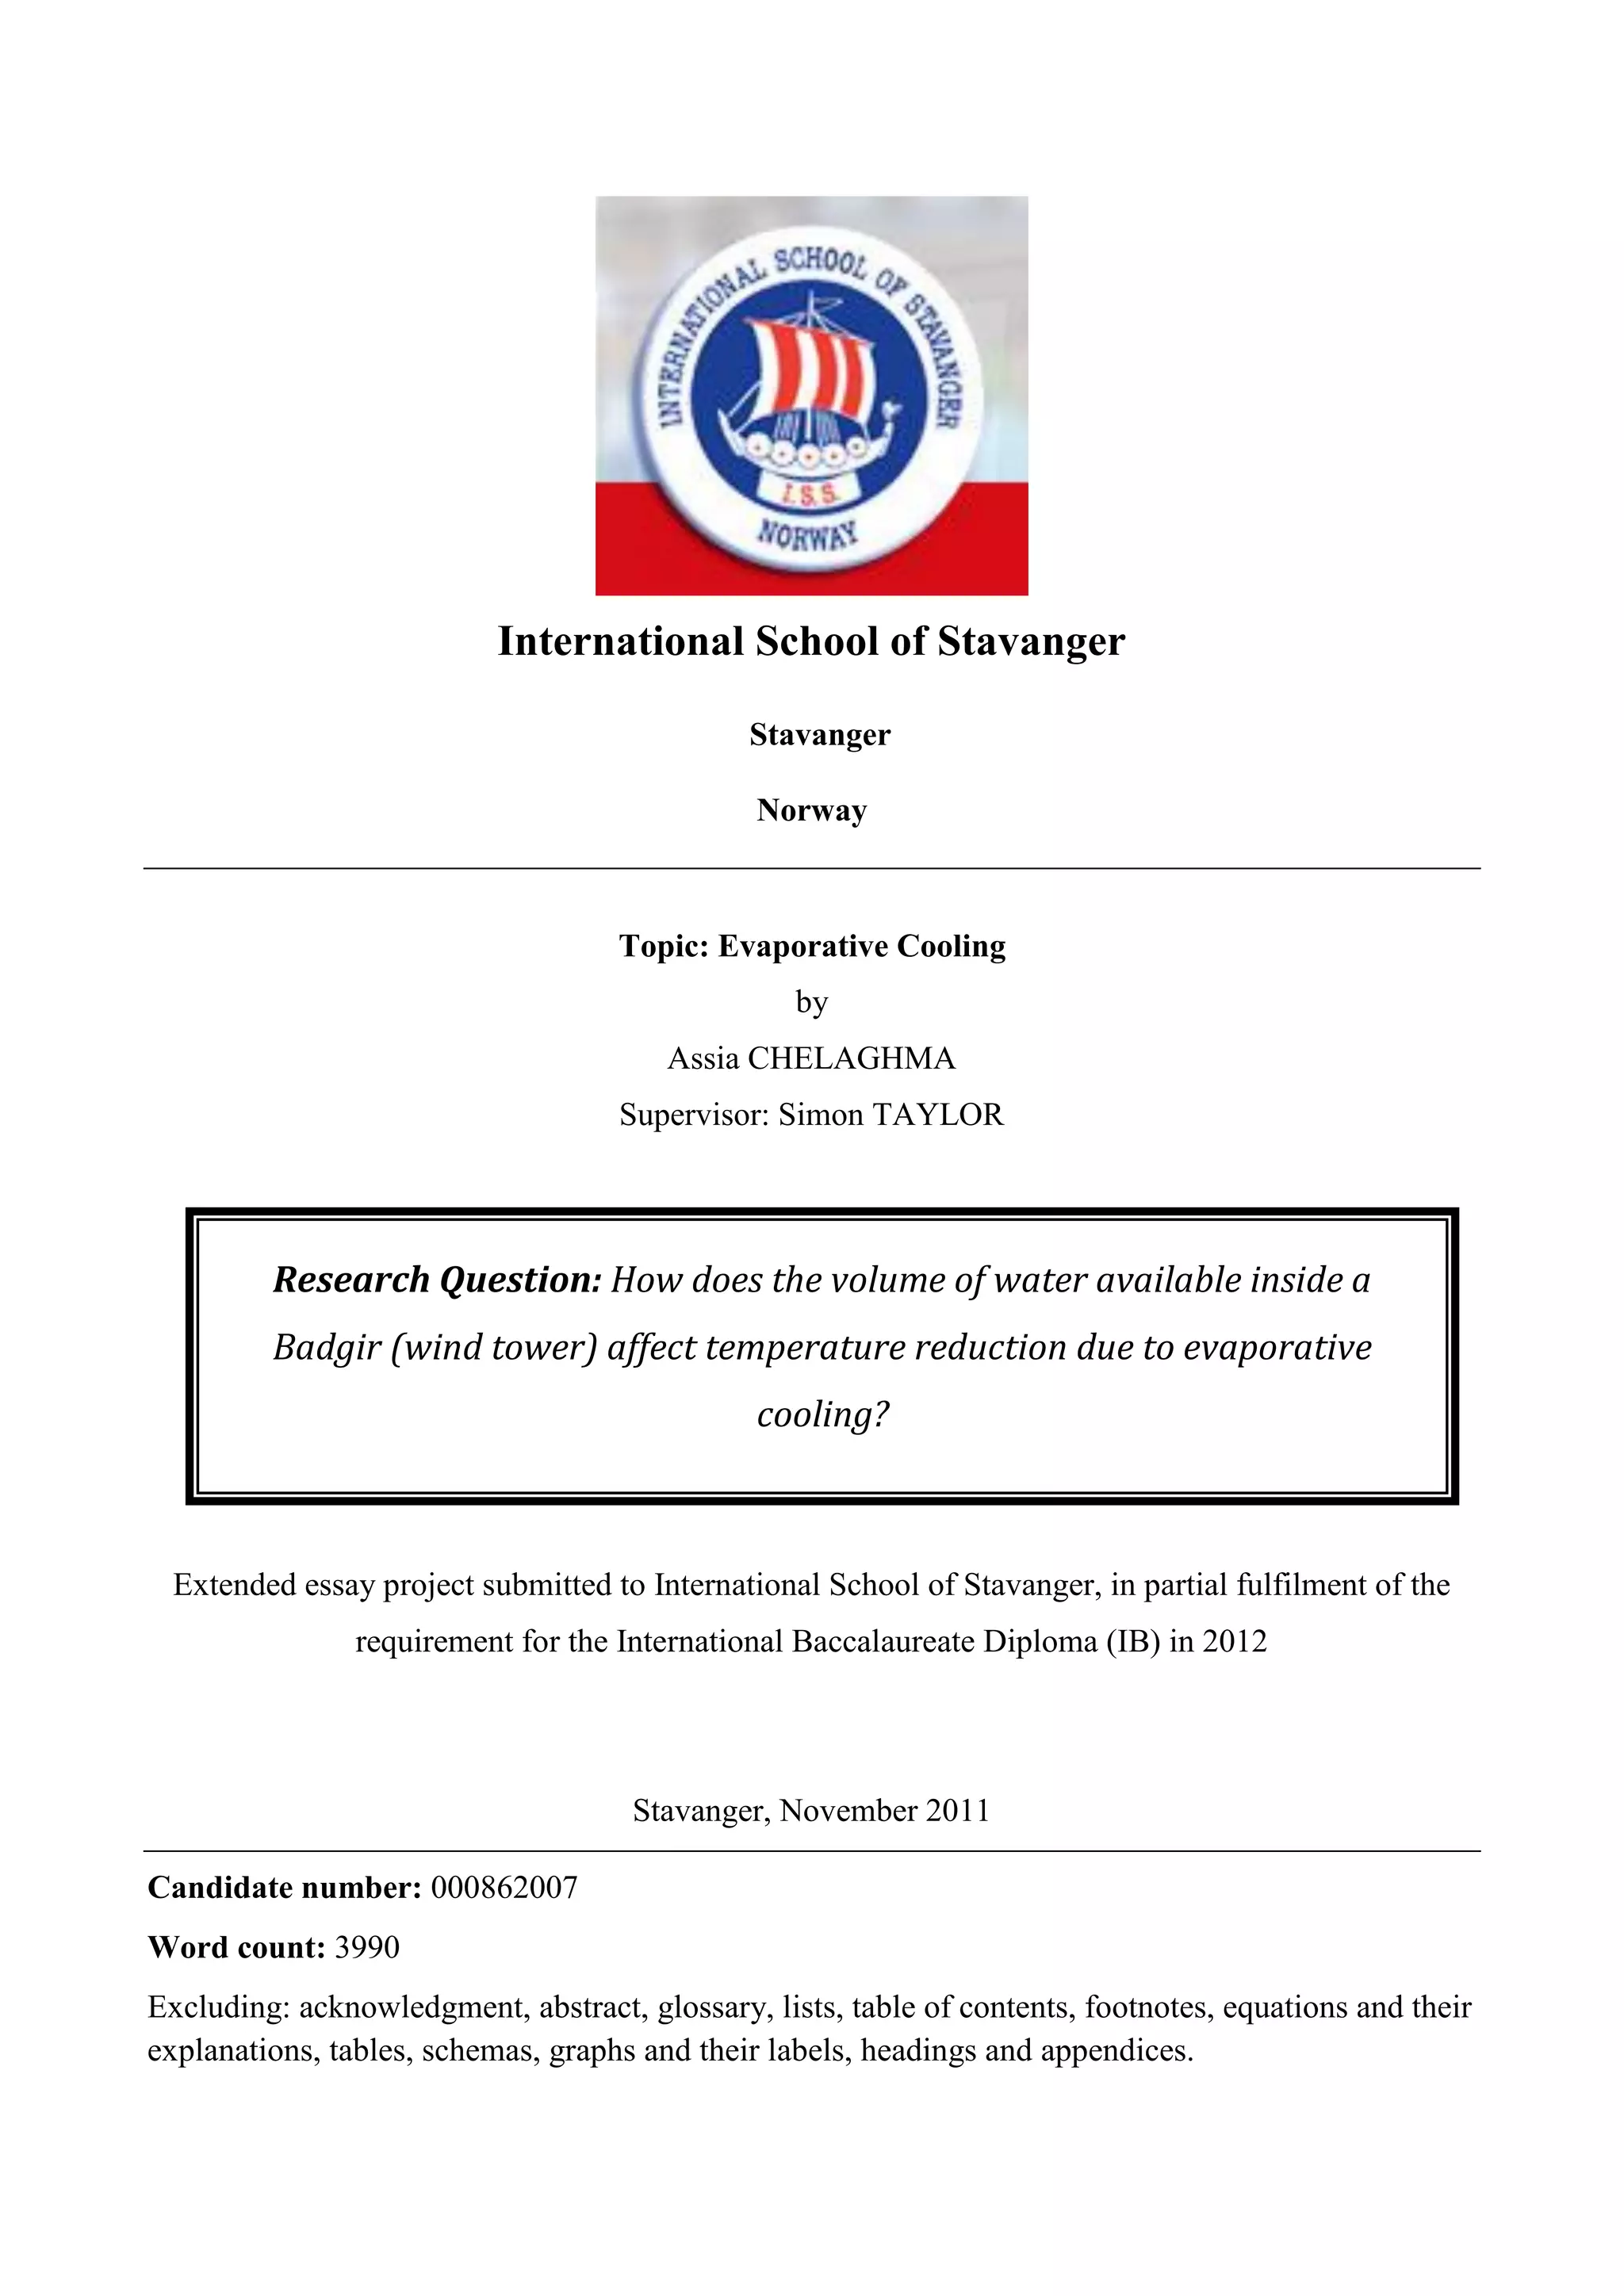
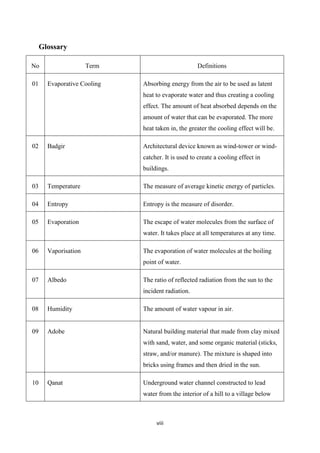
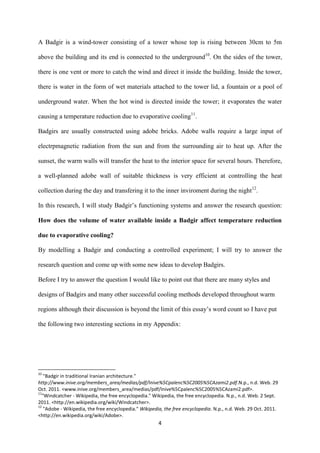
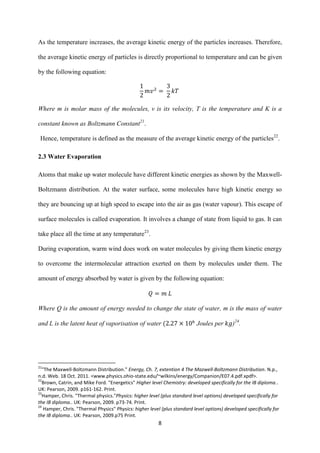
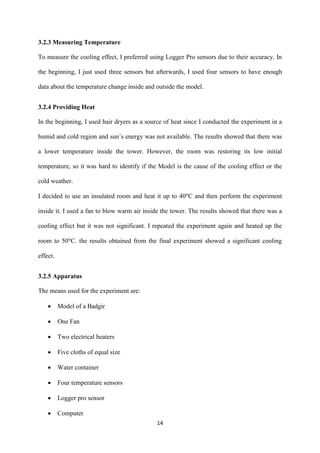
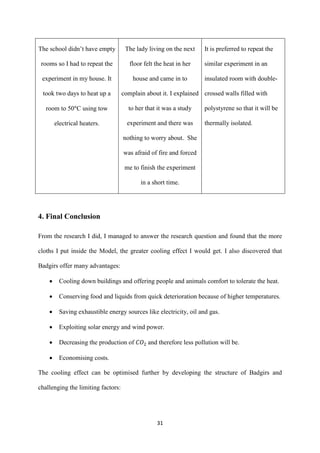
Water in a container has initial entropy of . When evaporation takes place, the fastest-
moving particles leave the surface, leaving behind particles with low kinetic energy. Water
molecules left in the container move with lower speed and get in less disorder. Hence, water
entropy decreases.
Schema 1: showing the dispersion of water molecules in a container before and after evaporation
[Author]
As more molecules escape into air and spread all over, the external entropy increases.
Water will have a negative entropy change and the surroundings will have a positive
entropy change .
29
Please see glossary for definition.
30
Hamper, Chris. "Thermal physics."Physics: higher level (plus standard level options) developed specifically for
the IB diploma.. UK: Pearson, 2009. p93-94. Print.
𝑆 𝑤 𝑆 𝑤
𝑆 𝑒𝑥 𝑆 𝑒𝑥](https://image.slidesharecdn.com/chelaghmaassia-181125072732/85/Extended-Essay-Physics-20-320.jpg)

![15
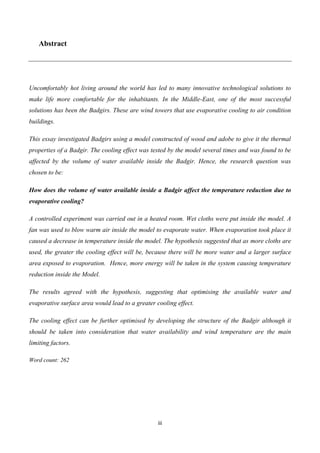
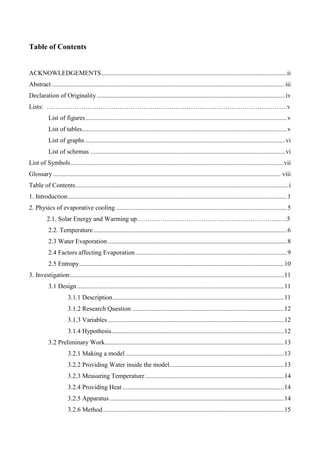
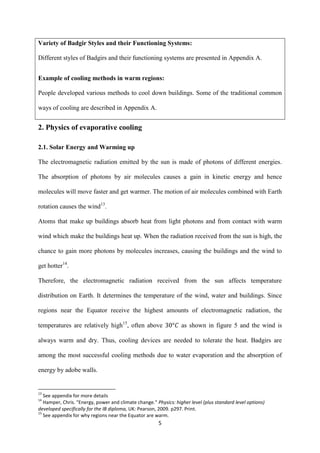
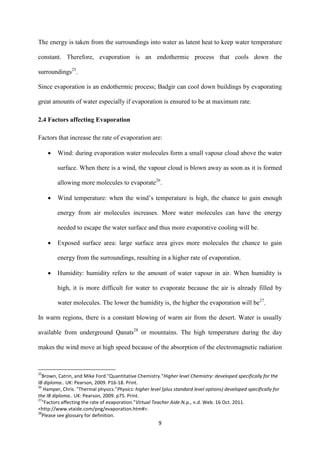
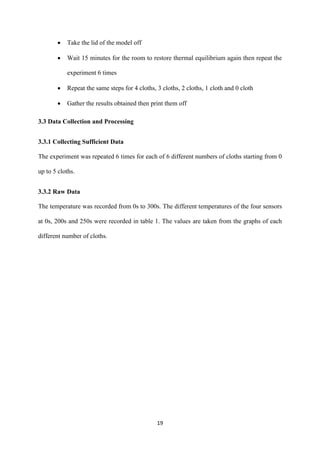
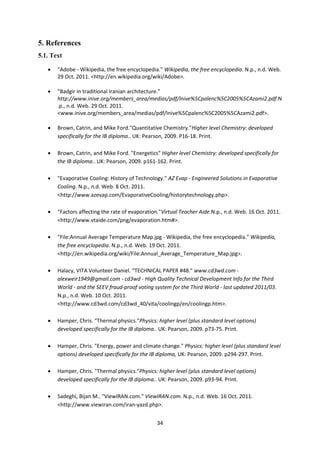
3.2.6 Method
Set up the procedure as shown in the pictures below:
Fig 6: showing apparatus set up, the model is put on one desk and the computer& Logger Pro
Sensors on the other desk. [Author]
Fig 7: showing cloths hanging inside the model and temperature sensors set up [Author]](https://image.slidesharecdn.com/chelaghmaassia-181125072732/85/Extended-Essay-Physics-25-320.jpg)
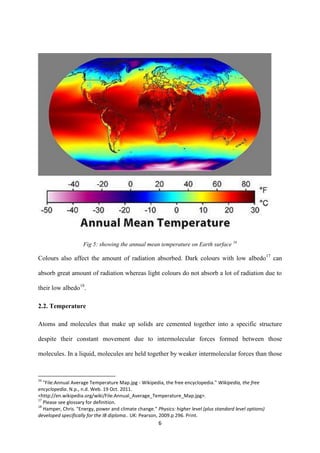
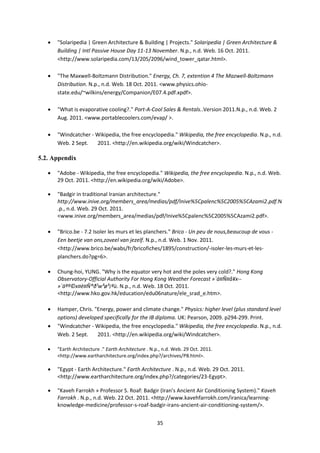
![16
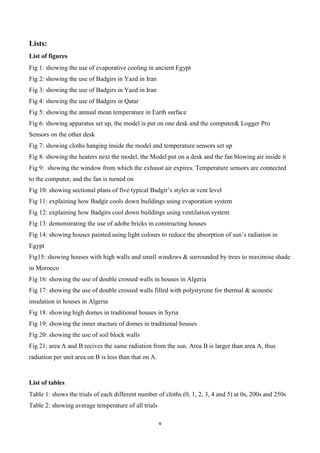
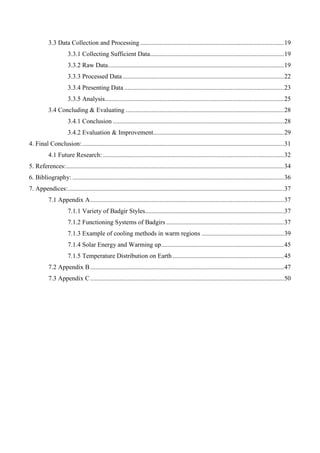
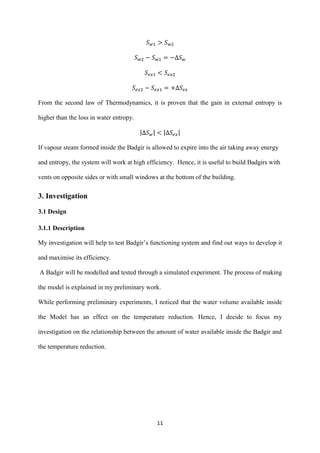
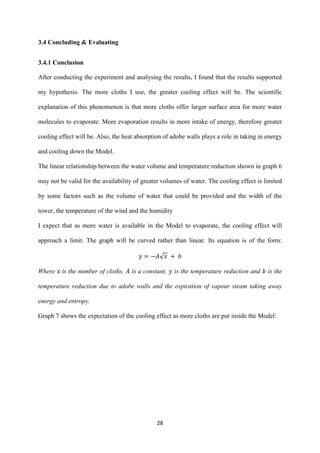
Fig 8: showing the heaters next the model, the Model put on a desk and the fan blowing air inside it
[Author]
Fig 9: showing the window from which the exhaust air expires. Temperature sensors are connected to
the computer, and the fan is turned on [Author]](https://image.slidesharecdn.com/chelaghmaassia-181125072732/85/Extended-Essay-Physics-26-320.jpg)
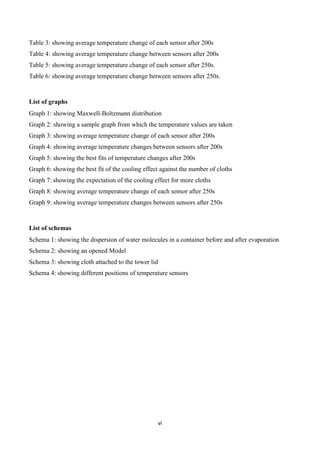
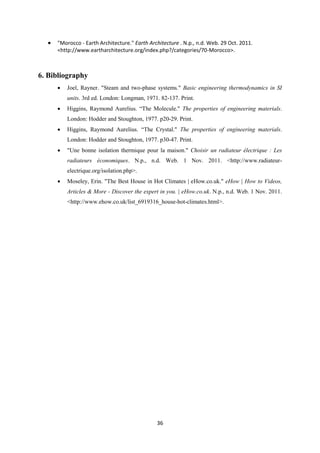
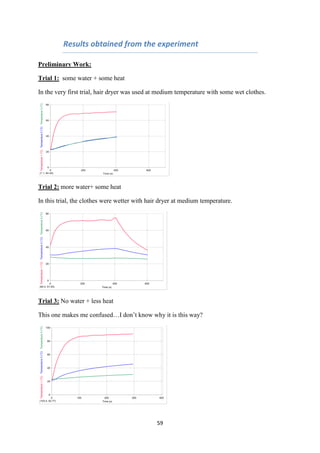
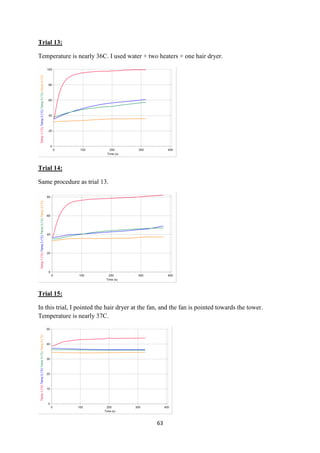
![17
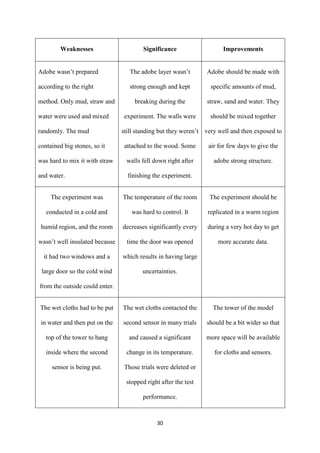
Heat up an insulated room to 50º C using two heaters
Put the model of the Badgir on one table with a lid taken off
Schema 2: showing an opened Model [Author]
Attach 5 cloths to the tower lid as shown below:
Schema 3: showing cloth attached to the tower lid [Author]](https://image.slidesharecdn.com/chelaghmaassia-181125072732/85/Extended-Essay-Physics-27-320.jpg)
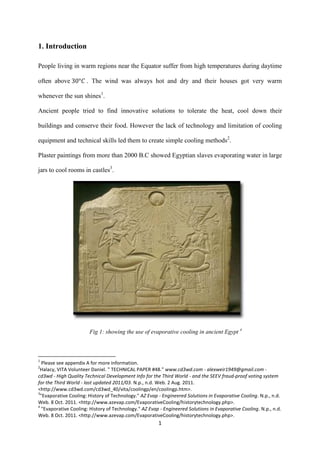
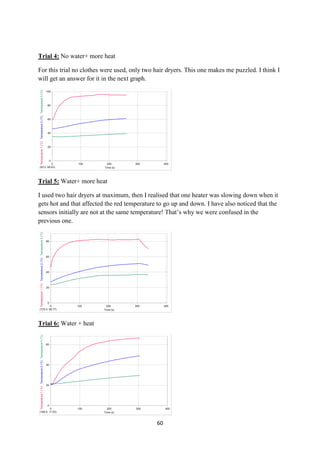
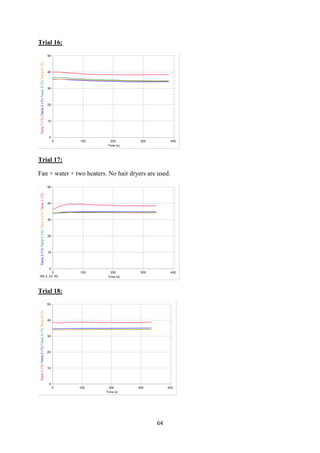
![18
Place temperature sensors as shown below:
Sensor 1
Sensor 2
Sensor 3
Sensor 4
Schema 4: showing different positions of temperature sensors [Author]
Connect logger pro sensor to a computer
Wait for the room to reach thermal equilibrium
Put the lid of the model on.
Put the cloths in water then return the lid to its place
Turn the fan on
Click Collect
Wait 300s then click Stop
Stop the fan
Take the lid of the tower off and put the cloths in a bath of water
1
2
4
3](https://image.slidesharecdn.com/chelaghmaassia-181125072732/85/Extended-Essay-Physics-28-320.jpg)
![20
Sample Graph:
Graph 2: showing a sample graph from which the temperature values are taken [Author]
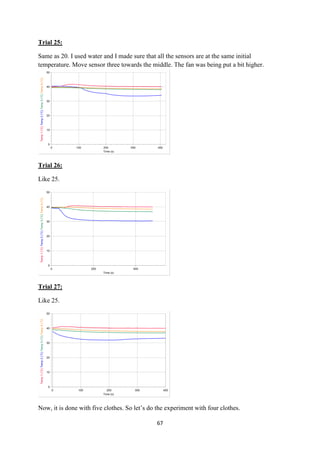
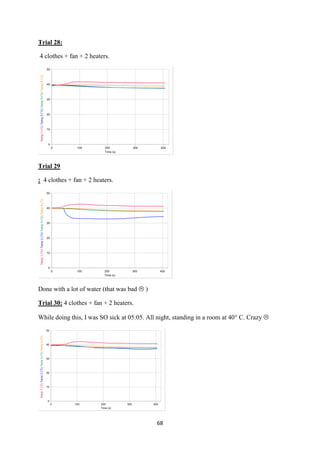
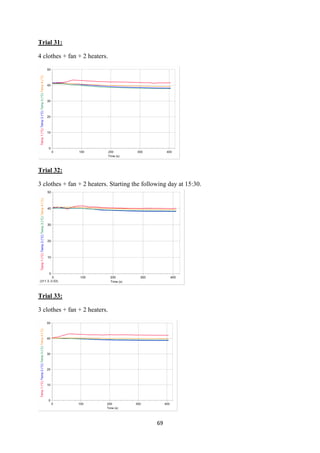
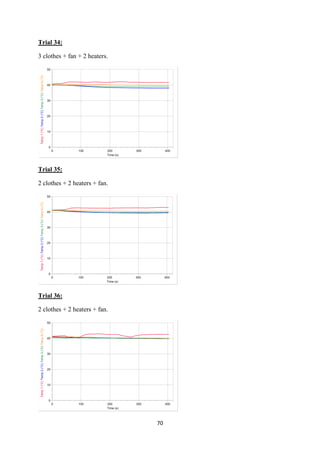
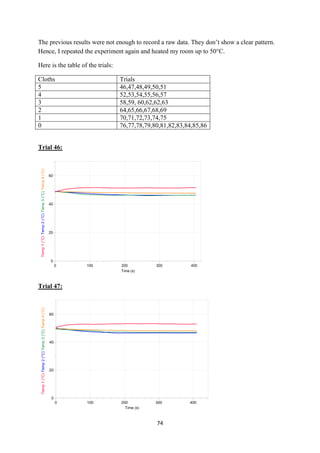
I ignored some results because they were out of range. I kept at least five different trials for
each number of cloths.
Table 1: shows the trials of each different number of cloths (0, 1, 2, 3, 4 and 5) at 0s, 200s
and 250s. Please see Appendix B.
The average temperature of each number of clothes was calculated and recorded in table 2.
Uncertainty in temperature was estimated to be C because the sensors were accurate in
measuring temperatures, but after calculating the uncertainty from the equation:
I found that the calculated uncertainty is larger and hence I ignored the estimated uncertainty
and considered only the calculated uncertainty.](https://image.slidesharecdn.com/chelaghmaassia-181125072732/85/Extended-Essay-Physics-30-320.jpg)
![21
Cloths
Average of all the trials
/ C
Sensor 0s Uncertainty
/ C
200s Uncertainty
/ C
250s Uncertainty
/ C
0 Cloth
1 54.0 1.2 55.4 0.5 55.5 0.4
2 52.9 0.9 53.6 0.4 53.8 0.4
3 52.9 1.0 53.2 0.9 53.2 0.8
4 53.5 1.1 53.7 0.8 53.8 0.8
1 Cloth
1 53.0 1.5 55.0 0.7 55.0 0.9
2 52.4 1.3 52.1 1.0 52.1 1.1
3 52.1 1.6 51.7 1.5 51.8 1.5
4 52.9 1.6 52.7 1.2 52.7 1.2
2 Cloths
1 51.6 0.6 54.0 0.8 54.0 0.9
2 51.3 0.3 50.3 0.4 50.3 0.4
3 50.8 0.3 49.6 0.6 49.6 0.7
4 51.6 0.3 50.3 0.5 50.3 0.5
3 Cloths
1 51.1 0.8 54.3 0.3 54.4 0.4
2 50.6 0.4 49.8 0.5 49.8 0.6
3 50.3 0.6 49.2 0.5 49.2 0.5
4 50.7 0.4 49.9 0.2 49.8 0.2
4 Cloths
1 51.2 0.7 53.7 1.1 53.7 1.1
2 50.5 0.5 48.7 0.6 48.7 0.7
3 50.1 0.3 47.9 0.4 47.9 0.4
4 50.9 0.4 48.9 0.4 48.8 0.4
5 Cloths
1 50.8 1.7 53.0 1.2 53.1 1.3
2 50.2 1.2 47.3 0.8 47.2 0.7
3 49.7 0.8 47.7 1.5 47.6 1.5
4 50.1 1.1 48.6 0.5 48.5 0.5
Table 2: showing average temperature of all trials [Author]](https://image.slidesharecdn.com/chelaghmaassia-181125072732/85/Extended-Essay-Physics-31-320.jpg)
![22
3.3.3 Processed Data
Temperature at 0s represents the initial temperature; to get the temperature change after 200s
and 250s, I used the following formulae:
Positive sign shows an increase in temperature and negative sign shows a decrease in
temperature.
Cloths
Change after 200s
Sensor
1
/ C
Uncertainty
/ C
Sensor
2
/ C
Uncertainty
/ C
Sensor
3
/ C
Uncertainty
/ C
Sensor
4
/ C
Uncertainty
/ C
0 1.4 1.6 0.7 1.3 0.3 1.8 0.2 1.9
1 2.0 2.2 -0.3 2.3 -0.3 3.2 -0.2 2.7
2 2.3 1.4 -1.0 0.6 -1.2 0.9 -1.3 0.8
3 3.2 1.2 -0.8 0.9 -1.1 1.1 -0.8 0.6
4 2.5 1.8 -1.8 1.1 -2.2 0.7 -2.0 0.8
5 2.2 2.9 -2.9 1.9 -1.9 1.7 -1.5 1.7
Table 3: showing average temperature change of each sensor after 200s [Author]
Sensor 1 gives the temperature of the surroundings in which there was no evaporative cooling
effect. Hence, to get the cooling effect inside the Model, I calculated temperature change and
uncertainties using the formulae:](https://image.slidesharecdn.com/chelaghmaassia-181125072732/85/Extended-Essay-Physics-32-320.jpg)
![23
Cloths
Change After 200s
Change 1-
2
/ C
Uncertainty
/ C
Change 1-
3
/ C
Uncertainty
/ C
Change 1-
4
/ C
Uncertainty
/ C
0 -1.8 0.8 -2.3 1.3 -1.7 1.3
1 -2.9 1.8 -3.3 2.2 -2.3 1.9
2 -3.7 1.2 -4.3 1.4 -3.6 1.3
3 -4.5 0.8 -5.1 0.9 -4.4 0.6
4 -5.0 1.7 -5.7 1.5 -4.8 1.4
5 -5.7 2.0 -5.2 2.7 -4.4 1.7
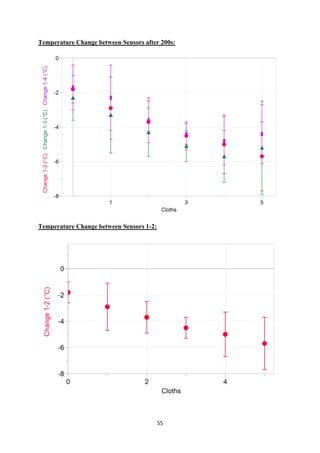
Table 4: showing average temperature change between sensors after 200s [Author]
Remark: please note that the calculations of temperature change after 250s are shown in
Appendix B.
3.3.4 Presenting Data
Since the number of cloths is the independent variable and the change in temperature is the
dependent variable, I plotted a graph with number of cloths on the x-axis and the change of
temperature on the y-axis.](https://image.slidesharecdn.com/chelaghmaassia-181125072732/85/Extended-Essay-Physics-33-320.jpg)
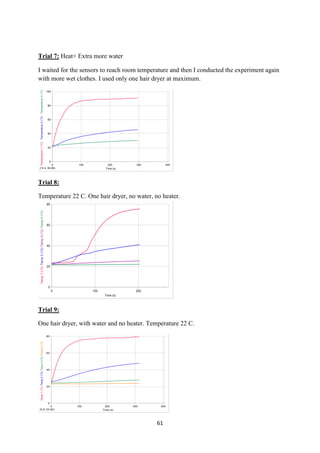
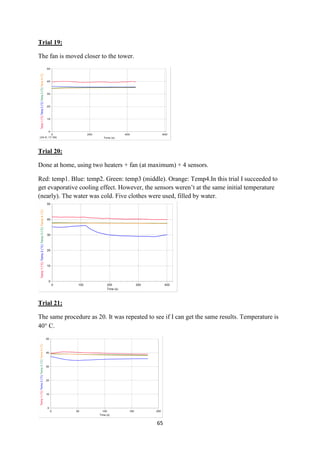
![24
Graph 3: showing average temperature change of each sensor after 200s [Author]
-4.0
-3.0
-2.0
-1.0
0.0
1.0
2.0
3.0
4.0
0 1 2 3 4 5 6
TemeratureChange/C
Number of Cloths put inside the Model
Temperature Change after 200s
Sensor 1
Sensor 2
Sensor 3
Sensor 4](https://image.slidesharecdn.com/chelaghmaassia-181125072732/85/Extended-Essay-Physics-34-320.jpg)
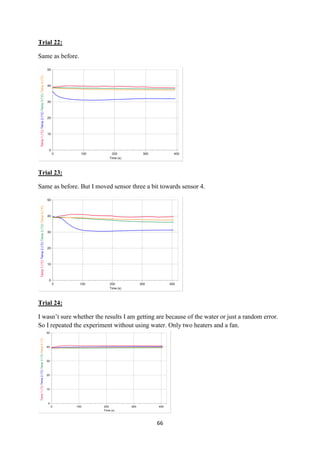
![25
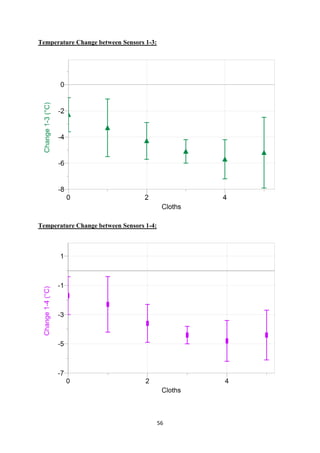
Graph 4: showing average temperature changes between sensors after 200s [Author]
3.3.5 Analysis
The graphs are shown without uncertainties because the uncertainties were large and when I
insert them in the graphs they make the results look complicated and confusing. Hence, I
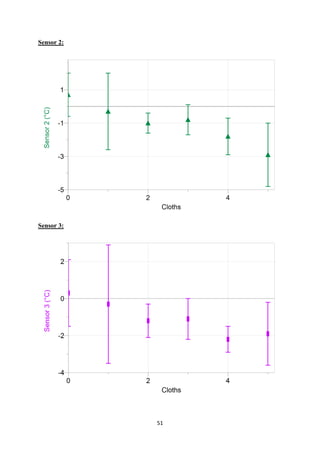
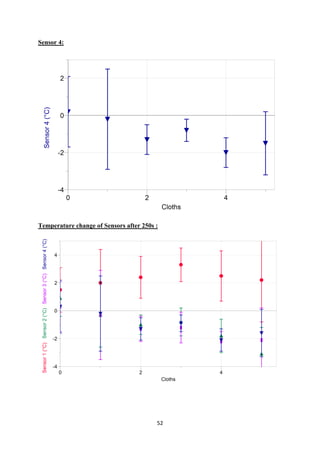
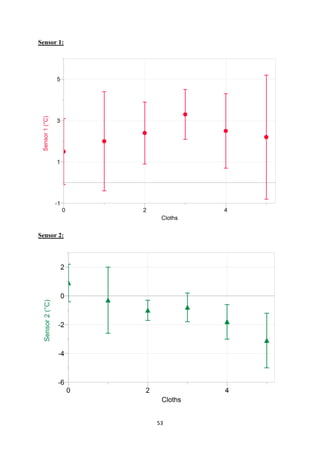
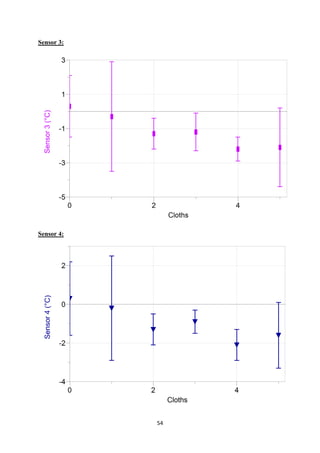
decided to make separate graphs for each change and for each sensor with error bars and
include them in Appendix C.
Temperature change of the four sensors presented in graph 3 shows that the temperature of
the surroundings detected by the first sensor has increased (positive sign) and the temperature
of the system detected by sensor 2, 3 and 4 has decreased (negative sign). Therefore, there is a
cooling effect inside the Model.
-7.0
-6.0
-5.0
-4.0
-3.0
-2.0
-1.0
0.0
0 1 2 3 4 5 6
TemperatureChangebewteenSensors/C
Number of Cloths put inside the Model
Temperature Change between Sensors after 200s
Change 1-2
Change 1-3
Change 1-4](https://image.slidesharecdn.com/chelaghmaassia-181125072732/85/Extended-Essay-Physics-35-320.jpg)
![26
Temperature of the surroundings is . Thus, the kinetic energy of air molecules is high.
When the warm air entered inside the Model, an amount of energy was absorbed by water to
break down intermolecular forces and changed the state of water from a liquid to a gas, and
some energy was transferred to the walls of the room which were covered by adobe. The
absorption of energy by water and adobe resulted in temperature reduction inside the Model.
Graph 4 shows that the more cloths are put inside the model, the more temperature reduction
will be. Hence, there will be greater cooling effect inside the Model.
The relationship between the number of cloths and temperature reduction showed a pattern
that excel gave by the best fits presented in graph 5:
Graph 5: showing the best fits of temperature changes after 200s [Author]
y = -0.7611x - 2.0211
R² = 0.9849
y = -0.6592x - 2.6694
R² = 0.8626
y = -0.6179x - 1.991
R² = 0.8457
-7.0
-6.0
-5.0
-4.0
-3.0
-2.0
-1.0
0.0
0 1 2 3 4 5 6
TemperatureChangebewteenSensors/C
Number of Cloths put inside the Model
Temperature Change between Sensors after 200s
Change 1-2
Change 1-3
Change 1-4
Linear (Change 1-2)
Linear (Change 1-3)
Linear (Change 1-4)](https://image.slidesharecdn.com/chelaghmaassia-181125072732/85/Extended-Essay-Physics-36-320.jpg)
![27
The equations of the best fits are the form of:
Where is the number of cloths, is a constant, is the temperature reduction due to adobe
walls and the expiration of vapour steam taking away energy and entropy and is the
temperature reduction inside the Model.
The average equation is:
The graph of the equation is shown in graph 5:
Graph 6: showing the best fit of the cooling effect against the number of cloths [Author]
5 10 15
−14
−12
−10
−8
−6
−4
−2
Number of cloths
Temperature reduction/ °C](https://image.slidesharecdn.com/chelaghmaassia-181125072732/85/Extended-Essay-Physics-37-320.jpg)
![29
Graph 7: showing the expectation of the cooling effect for more cloths [Author]
The present investigation could not prove the expected relationship since the volume of water
tested and the conditions simulated were limited, but in future research this can be
investigated further.
3.4.2 Evaluation & Improvement
In general the experiment gave sufficient data that answered the research question. However,
while doing the experiment, I found many issues and difficulties about the model which
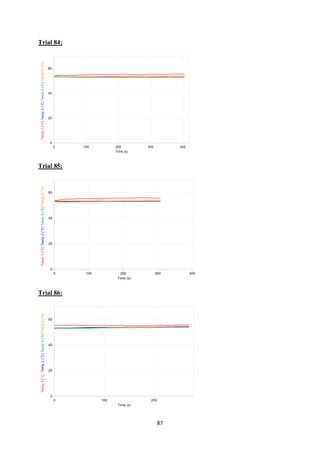
caused having large uncertainties, forced me to repeat the experiment four times and had 85
trials in total besides other trials that were stopped during the performance of the experiment.
5 10 15
−14
−12
−10
−8
−6
−4
−2
Number of Cloths
TemperatureReduction/ °C](https://image.slidesharecdn.com/chelaghmaassia-181125072732/85/Extended-Essay-Physics-39-320.jpg)


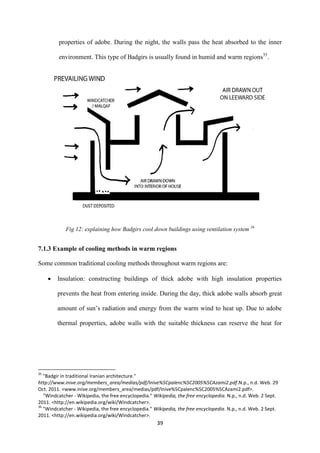
![42
Fig15: showing houses with high walls and small windows & surrounded by trees to maximise shade
in Morocco 40
Double crossed walls filled with polystyrene. They keep houses insulated thermally
and acoustically 41
Fig 16: showing the use of double crossed walls in houses in Algeria [Author]
40
"Morocco - Earth Architecture." Earth Architecture . N.p., n.d. Web. 29 Oct. 2011.
<http://www.eartharchitecture.org/index.php?/categories/70-Morocco>.
41
"Brico.be - 7.2 Isoler les murs et les planchers." Brico - Un peu de nous,beaucoup de vous - Een beetje van
ons,zoveel van jezelf. N.p., n.d. Web. 1 Nov. 2011.
<http://www.brico.be/wabs/fr/bricofiches/1895/construction/-isoler-les-murs-et-les-planchers.do?pg=6>.](https://image.slidesharecdn.com/chelaghmaassia-181125072732/85/Extended-Essay-Physics-52-320.jpg)
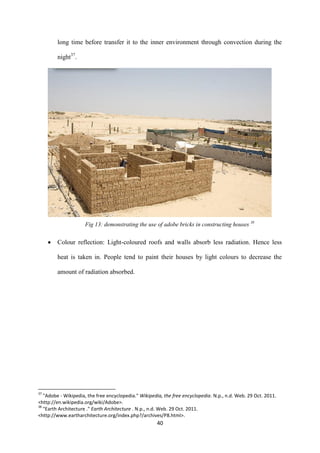
![43
Fig 17: showing the use of double crossed walls filled with polystyrene for thermal & acoustic
insulation in houses in Algeria [Author]
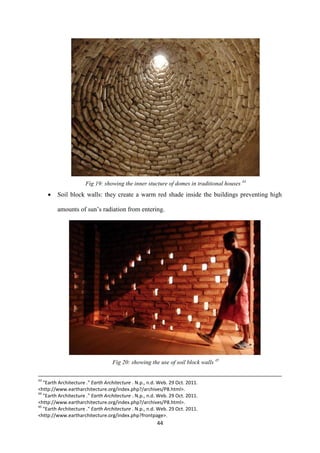
High domes. They keep the inner environment of the building thermally insulated by
their thick adobe walls and they also collect the warm air raising inside the dome and
let it expire so that the building cools down42
.
Fig 18: showing high domes in traditional houses in Syria43
42
"Earth Architecture ." Earth Architecture . N.p., n.d. Web. 29 Oct. 2011.
<http://www.eartharchitecture.org/index.php?/archives/P8.html>.](https://image.slidesharecdn.com/chelaghmaassia-181125072732/85/Extended-Essay-Physics-53-320.jpg)

![48
Cloths
Change after 250s
Sensor
1
/ C
Uncertainty
/ C
Sensor
2
/ C
Uncertainty
/ C
Sensor
3
/ C
Uncertainty
/ C
Sensor
4
/ C
Uncertainty
/ C
0 1.5 1.6 0.9 1.3 0.3 1.8 0.3 1.9
1 2.0 2.4 -0.3 2.3 -0.3 3.2 -0.2 2.7
2 2.4 1.5 -1.0 0.7 -1.3 0.9 -1.3 0.8
3 3.3 1.2 -0.8 1.0 -1.2 1.1 -0.9 0.6
4 2.5 1.8 -1.8 1.2 -2.2 0.7 -2.1 0.8
5 2.2 3.0 -3.1 1.9 -2.1 2.3 -1.6 1.7
Table 5: showing average temperature change of each sensor after 250s [Author]
Cloths
Change after 250s
Change 1-2
/ C
Uncertainty
/ C
Change 1-3
/ C
Uncertainty
/ C
Change 1-4
/ C
Uncertainty
/ C
0 -1.7 0.8 -2.3 1.3 -1.7 1.2
1 -2.9 2.0 -3.2 2.5 -2.3 2.1
2 -3.7 1.4 -4.4 1.6 -3.7 1.5
3 -4.6 1.0 -5.2 0.9 -4.5 0.6
4 -5.0 1.8 -5.9 1.5 -4.9 1.5
5 -5.9 2.0 -5.5 2.7 -4.6 1.8
Table 6: showing average temperature change between sensors after 250s [Author]](https://image.slidesharecdn.com/chelaghmaassia-181125072732/85/Extended-Essay-Physics-58-320.jpg)
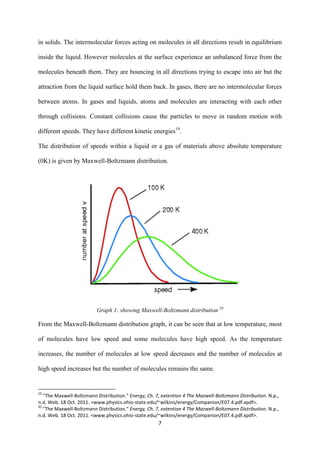
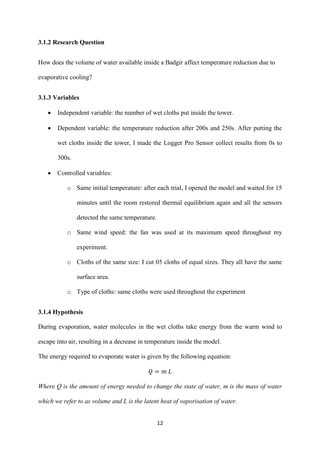
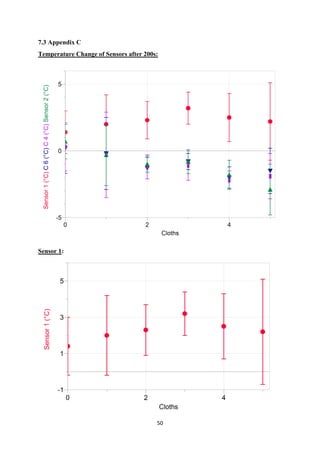
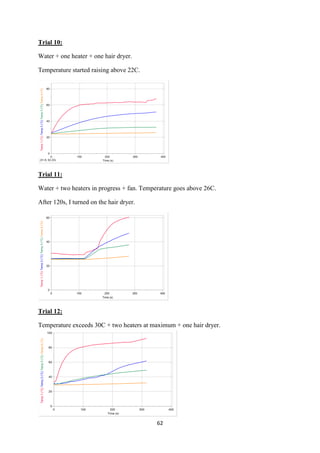
![49
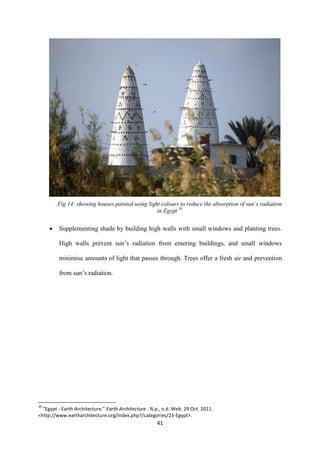
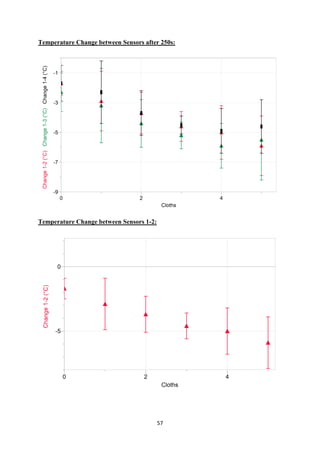
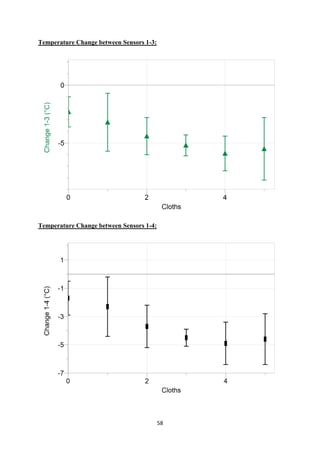
Graph 8: showing average temperature change of each sensor after 250s [Author]
Graph 9: showing average temperature changes between sensors after 250s [Author]
-4.0
-3.0
-2.0
-1.0
0.0
1.0
2.0
3.0
4.0
0 1 2 3 4 5 6
TemperatureChange/C
Number of Cloths put inside the Model
Temperature Change after 250s
Sensor 1
Sensor 2
Sensor 3
Sensor 4
-7.0
-6.0
-5.0
-4.0
-3.0
-2.0
-1.0
0.0
0 1 2 3 4 5 6
TemperatureChangebetweenSensors/C
Number of Cloths put inside the Model
Temperature Change between Sensors after
250s
Change 1-2
Change 1-3
Change 1-4](https://image.slidesharecdn.com/chelaghmaassia-181125072732/85/Extended-Essay-Physics-59-320.jpg)

This document is Assia Chelaghma's extended essay submitted to the International School of Stavanger in Norway in partial fulfillment of the IB diploma. The 3990 word essay investigates how the volume of water inside a Badgir (wind tower) affects temperature reduction due to evaporative cooling. Through a controlled experiment using a model Badgir, Assia tests her hypothesis that increasing the amount of water-soaked cloths inside the model would increase the cooling effect. The results supported the hypothesis, showing greater temperature decreases with more cloths. Optimizing water availability and surface area for evaporation maximizes the cooling potential of Badgirs.


