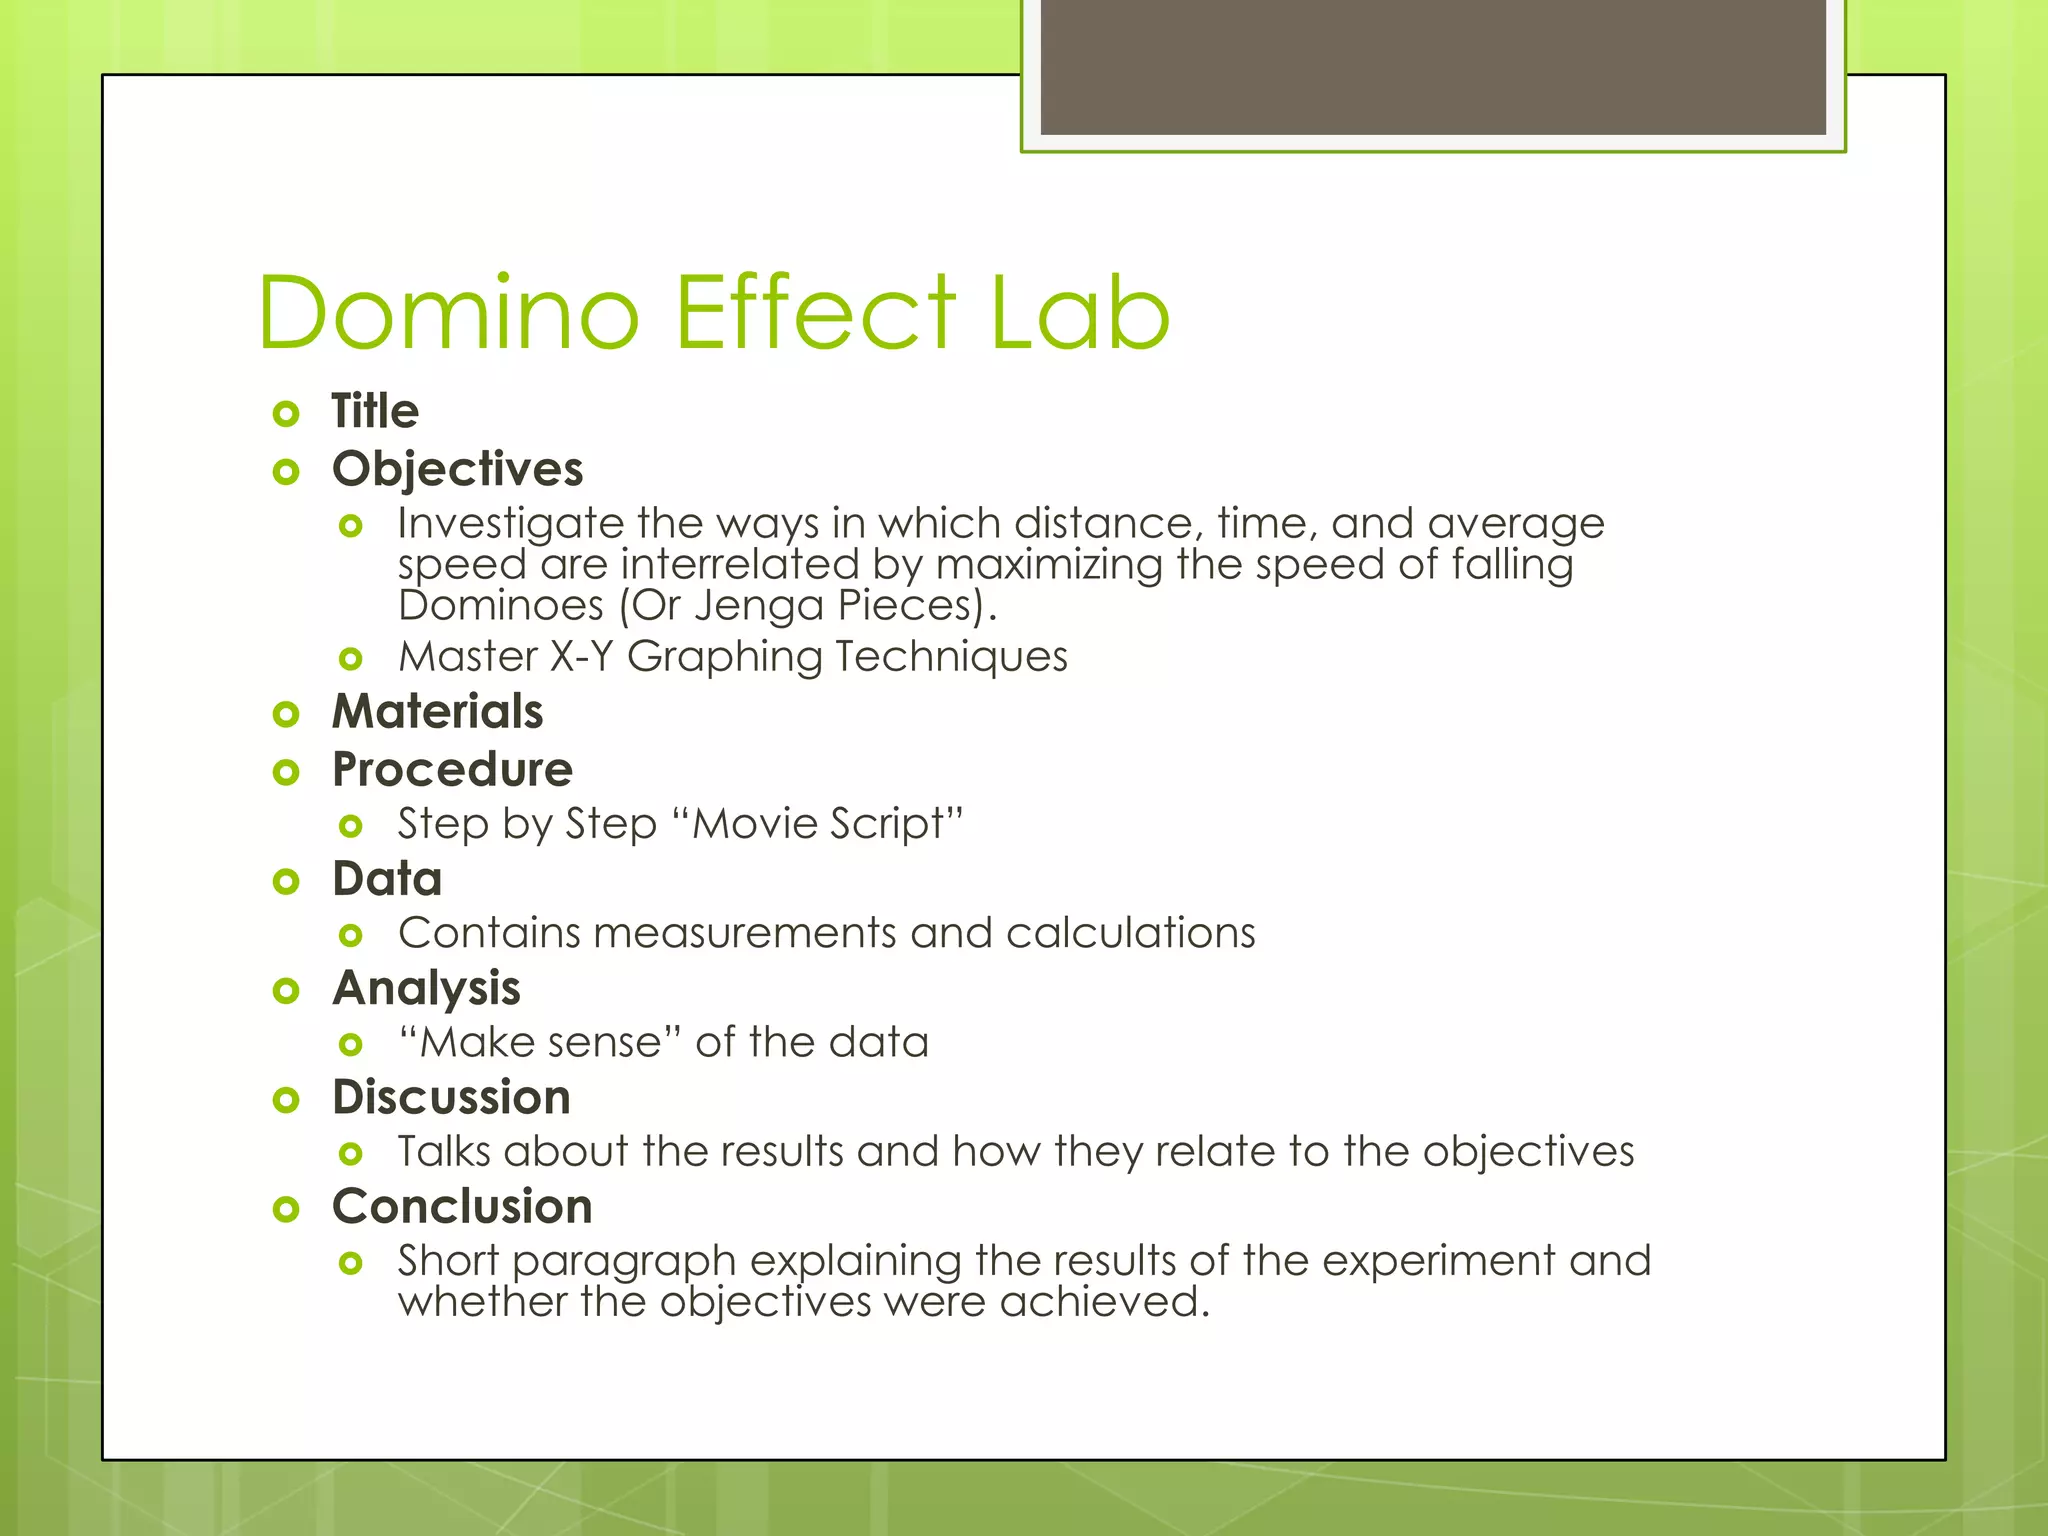
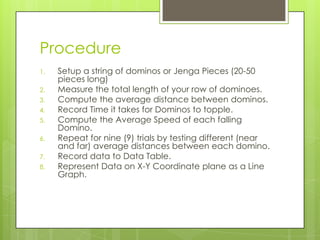
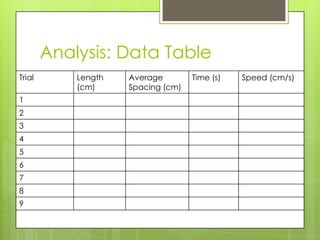
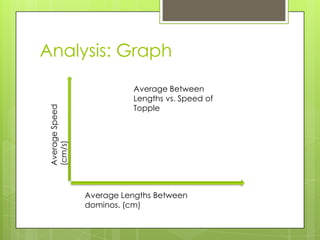
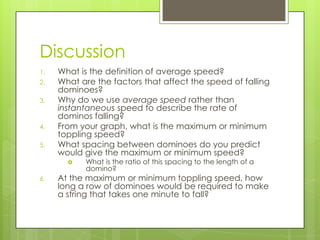
Domino Effect LabTitleObjectivesInvestigate the ways in which distance, time, and average speed are interrelated by maximizing the speed of falling Dominoes (Or Jenga Pieces).  Master X-Y Graphing TechniquesMaterialsProcedureStep by Step “Movie Script”DataContains measurements and calculationsAnalysis“Make sense” of the dataDiscussionTalks about the results and how they relate to the objectivesConclusionShort paragraph explaining the results of the experiment and whether the objectives were achieved.
IntroductionRead the Discussion section on Page 5 in the “blue” lab manual
ProcedureSetup a string of dominos or Jenga Pieces (20-50 pieces long)Measure the total length of your row of dominoes.   Compute the average distance between dominos.Record Time it takes for Dominos to topple.Compute the Average Speed of each falling Domino.Repeat for nine (9) trials by testing different (near and far) average distances between each domino.Record data to Data Table.Represent Data on X-Y Coordinate plane as a Line Graph.
Analysis: Data Table
Analysis: GraphAverage Between Lengths vs. Speed of ToppleAverage Speed (cm/s)Average Lengths Between dominos. (cm)
DiscussionWhat is the definition of average speed?What are the factors that affect the speed of falling dominoes?Why do we use average speed rather than instantaneous speed to describe the rate of dominos falling?From your graph, what is the maximum or minimum toppling speed?What spacing between dominoes do you predict would give the maximum or minimum speed?What is the ratio of this spacing to the length of a domino?At the maximum or minimum toppling speed, how long a row of dominoes would be required to make a string that takes one minute to fall?
ConclusionShort paragraph explaining the results of the experiment and whether the objectives were achieved.

Physics Domino effect Lab

  • 1.
    Domino Effect LabTitleObjectivesInvestigatethe ways in which distance, time, and average speed are interrelated by maximizing the speed of falling Dominoes (Or Jenga Pieces). Master X-Y Graphing TechniquesMaterialsProcedureStep by Step “Movie Script”DataContains measurements and calculationsAnalysis“Make sense” of the dataDiscussionTalks about the results and how they relate to the objectivesConclusionShort paragraph explaining the results of the experiment and whether the objectives were achieved.
  • 2.
    IntroductionRead the Discussionsection on Page 5 in the “blue” lab manual
  • 3.
    ProcedureSetup a stringof dominos or Jenga Pieces (20-50 pieces long)Measure the total length of your row of dominoes. Compute the average distance between dominos.Record Time it takes for Dominos to topple.Compute the Average Speed of each falling Domino.Repeat for nine (9) trials by testing different (near and far) average distances between each domino.Record data to Data Table.Represent Data on X-Y Coordinate plane as a Line Graph.
  • 4.
  • 5.
    Analysis: GraphAverage BetweenLengths vs. Speed of ToppleAverage Speed (cm/s)Average Lengths Between dominos. (cm)
  • 6.
    DiscussionWhat is thedefinition of average speed?What are the factors that affect the speed of falling dominoes?Why do we use average speed rather than instantaneous speed to describe the rate of dominos falling?From your graph, what is the maximum or minimum toppling speed?What spacing between dominoes do you predict would give the maximum or minimum speed?What is the ratio of this spacing to the length of a domino?At the maximum or minimum toppling speed, how long a row of dominoes would be required to make a string that takes one minute to fall?
  • 7.
    ConclusionShort paragraph explainingthe results of the experiment and whether the objectives were achieved.