1) Velocity includes both speed and direction of motion. Constant velocity means constant speed in a single direction. Acceleration is a change in velocity caused by applying a force.
2) More massive objects have more inertia, making them more resistant to changes in motion. For example, it takes a massive oil tanker 10km to stop due to its large mass and inertia.
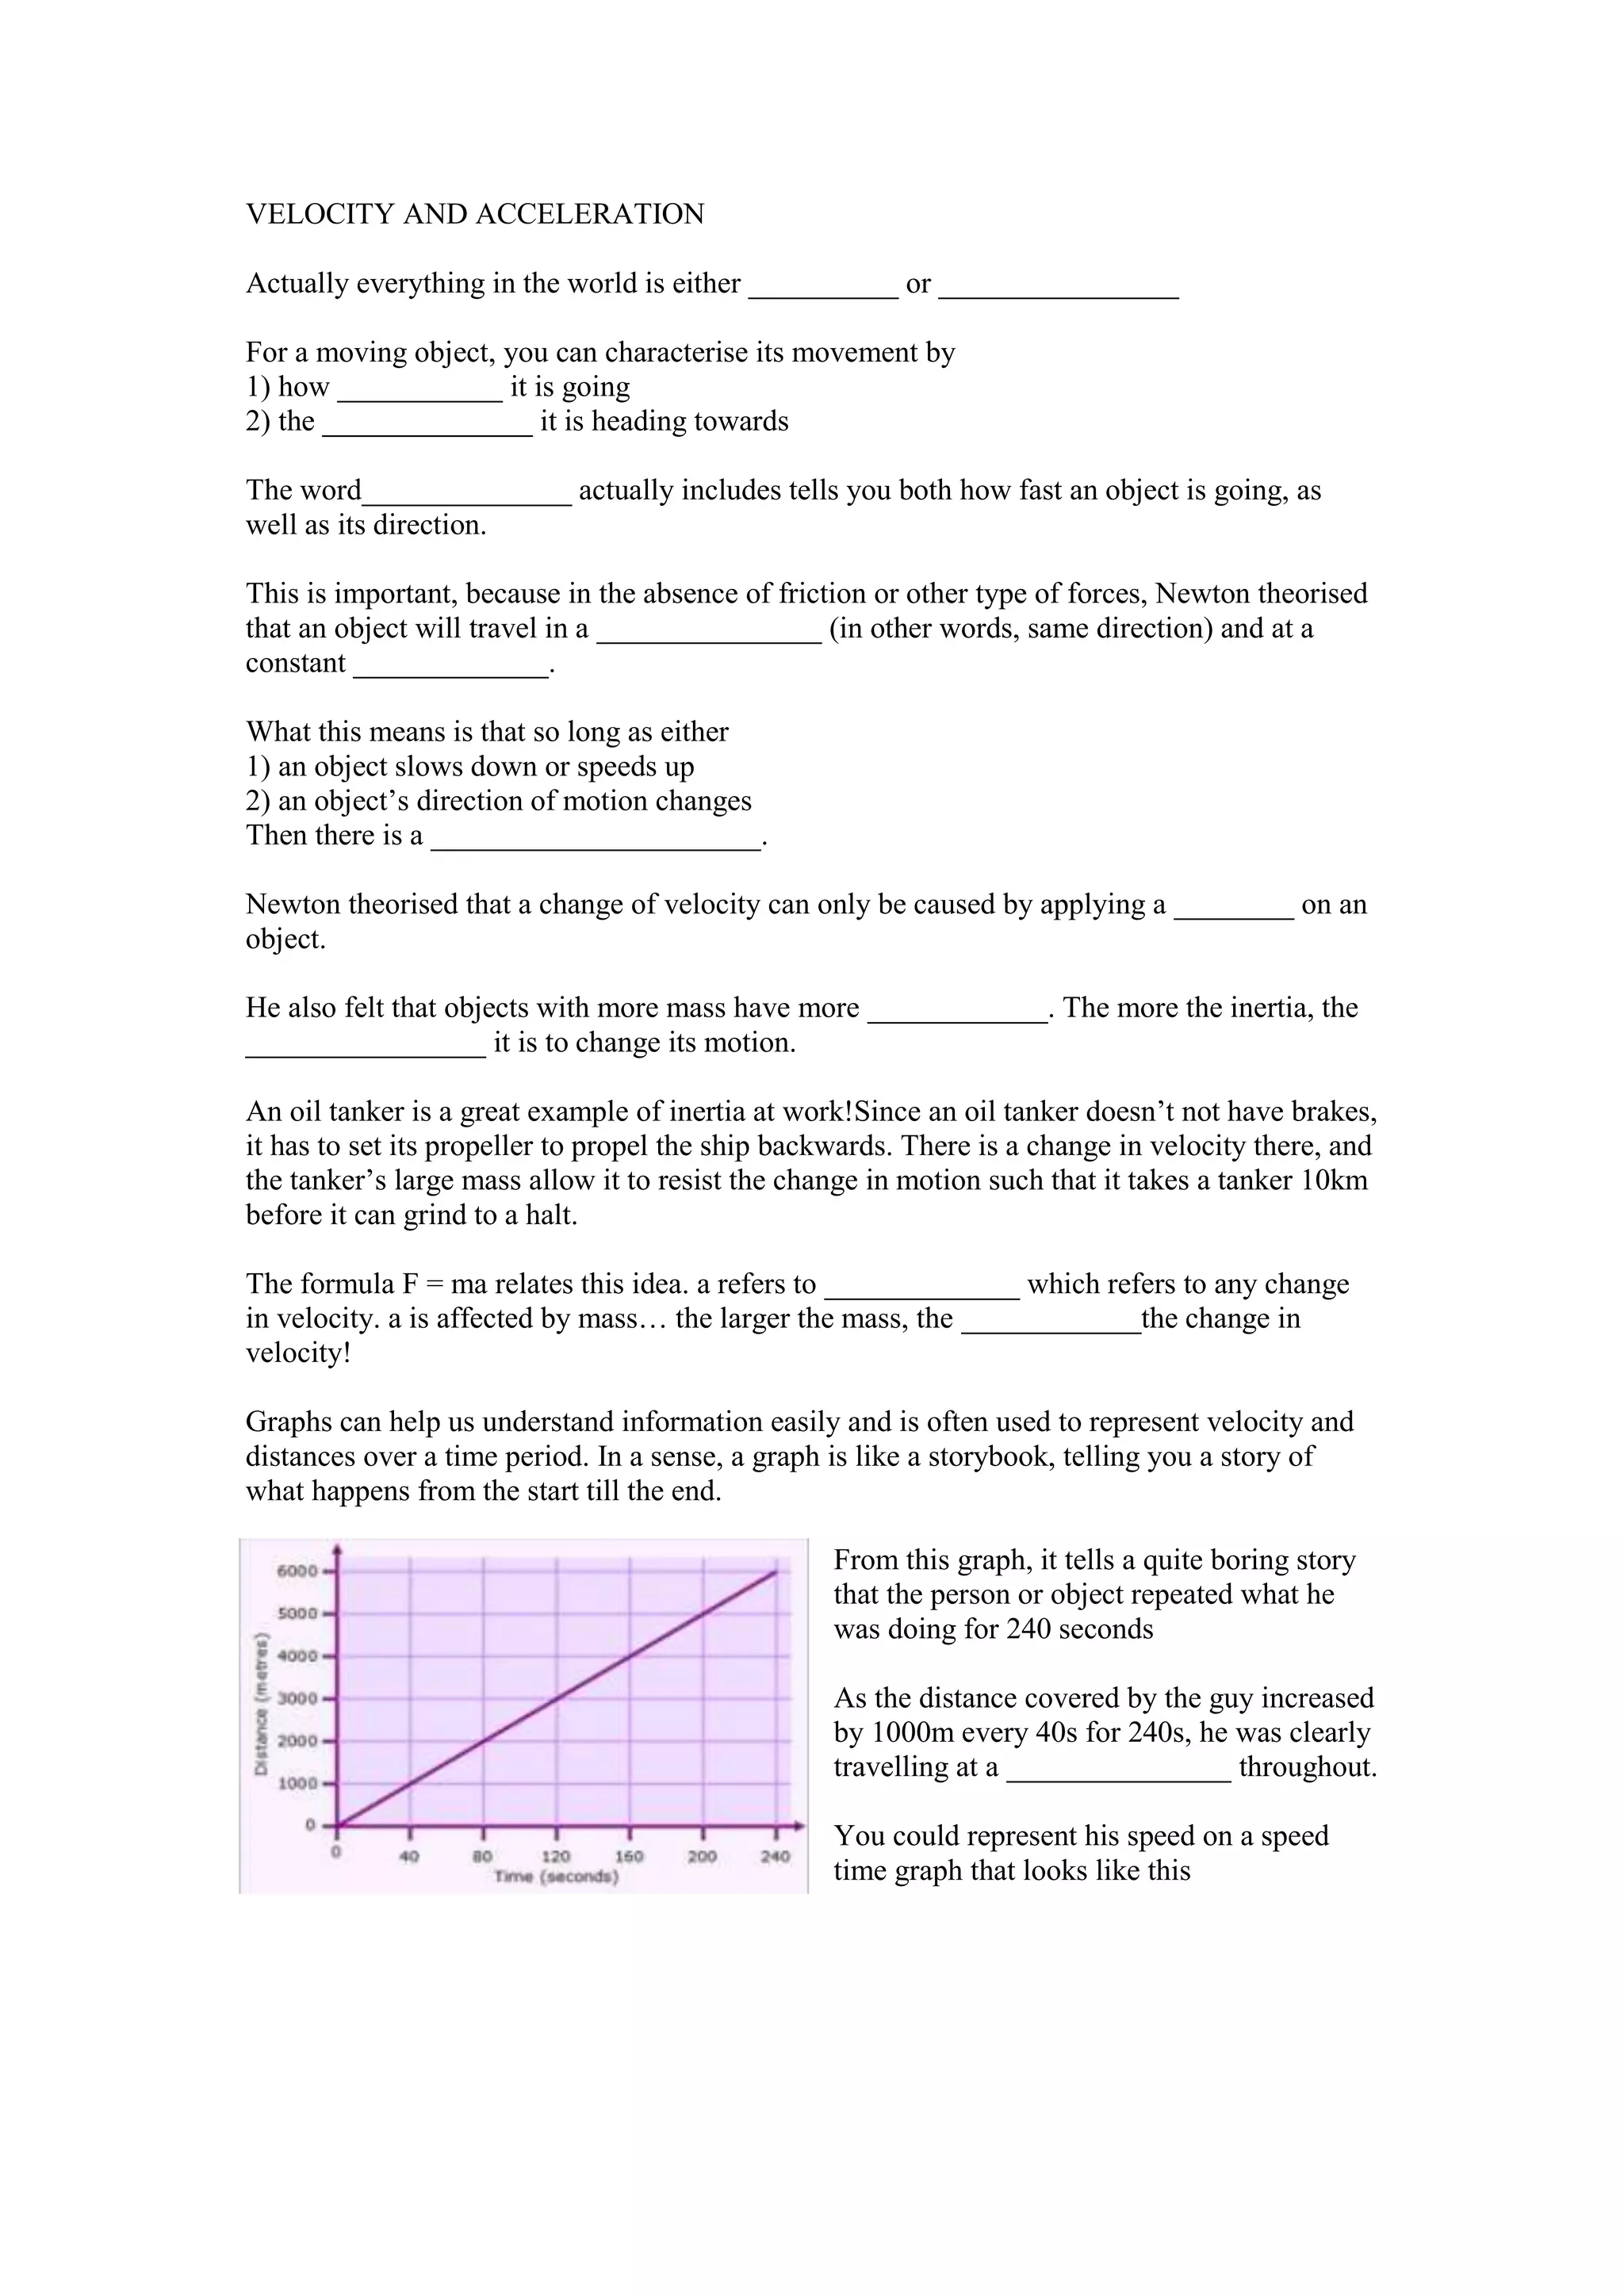
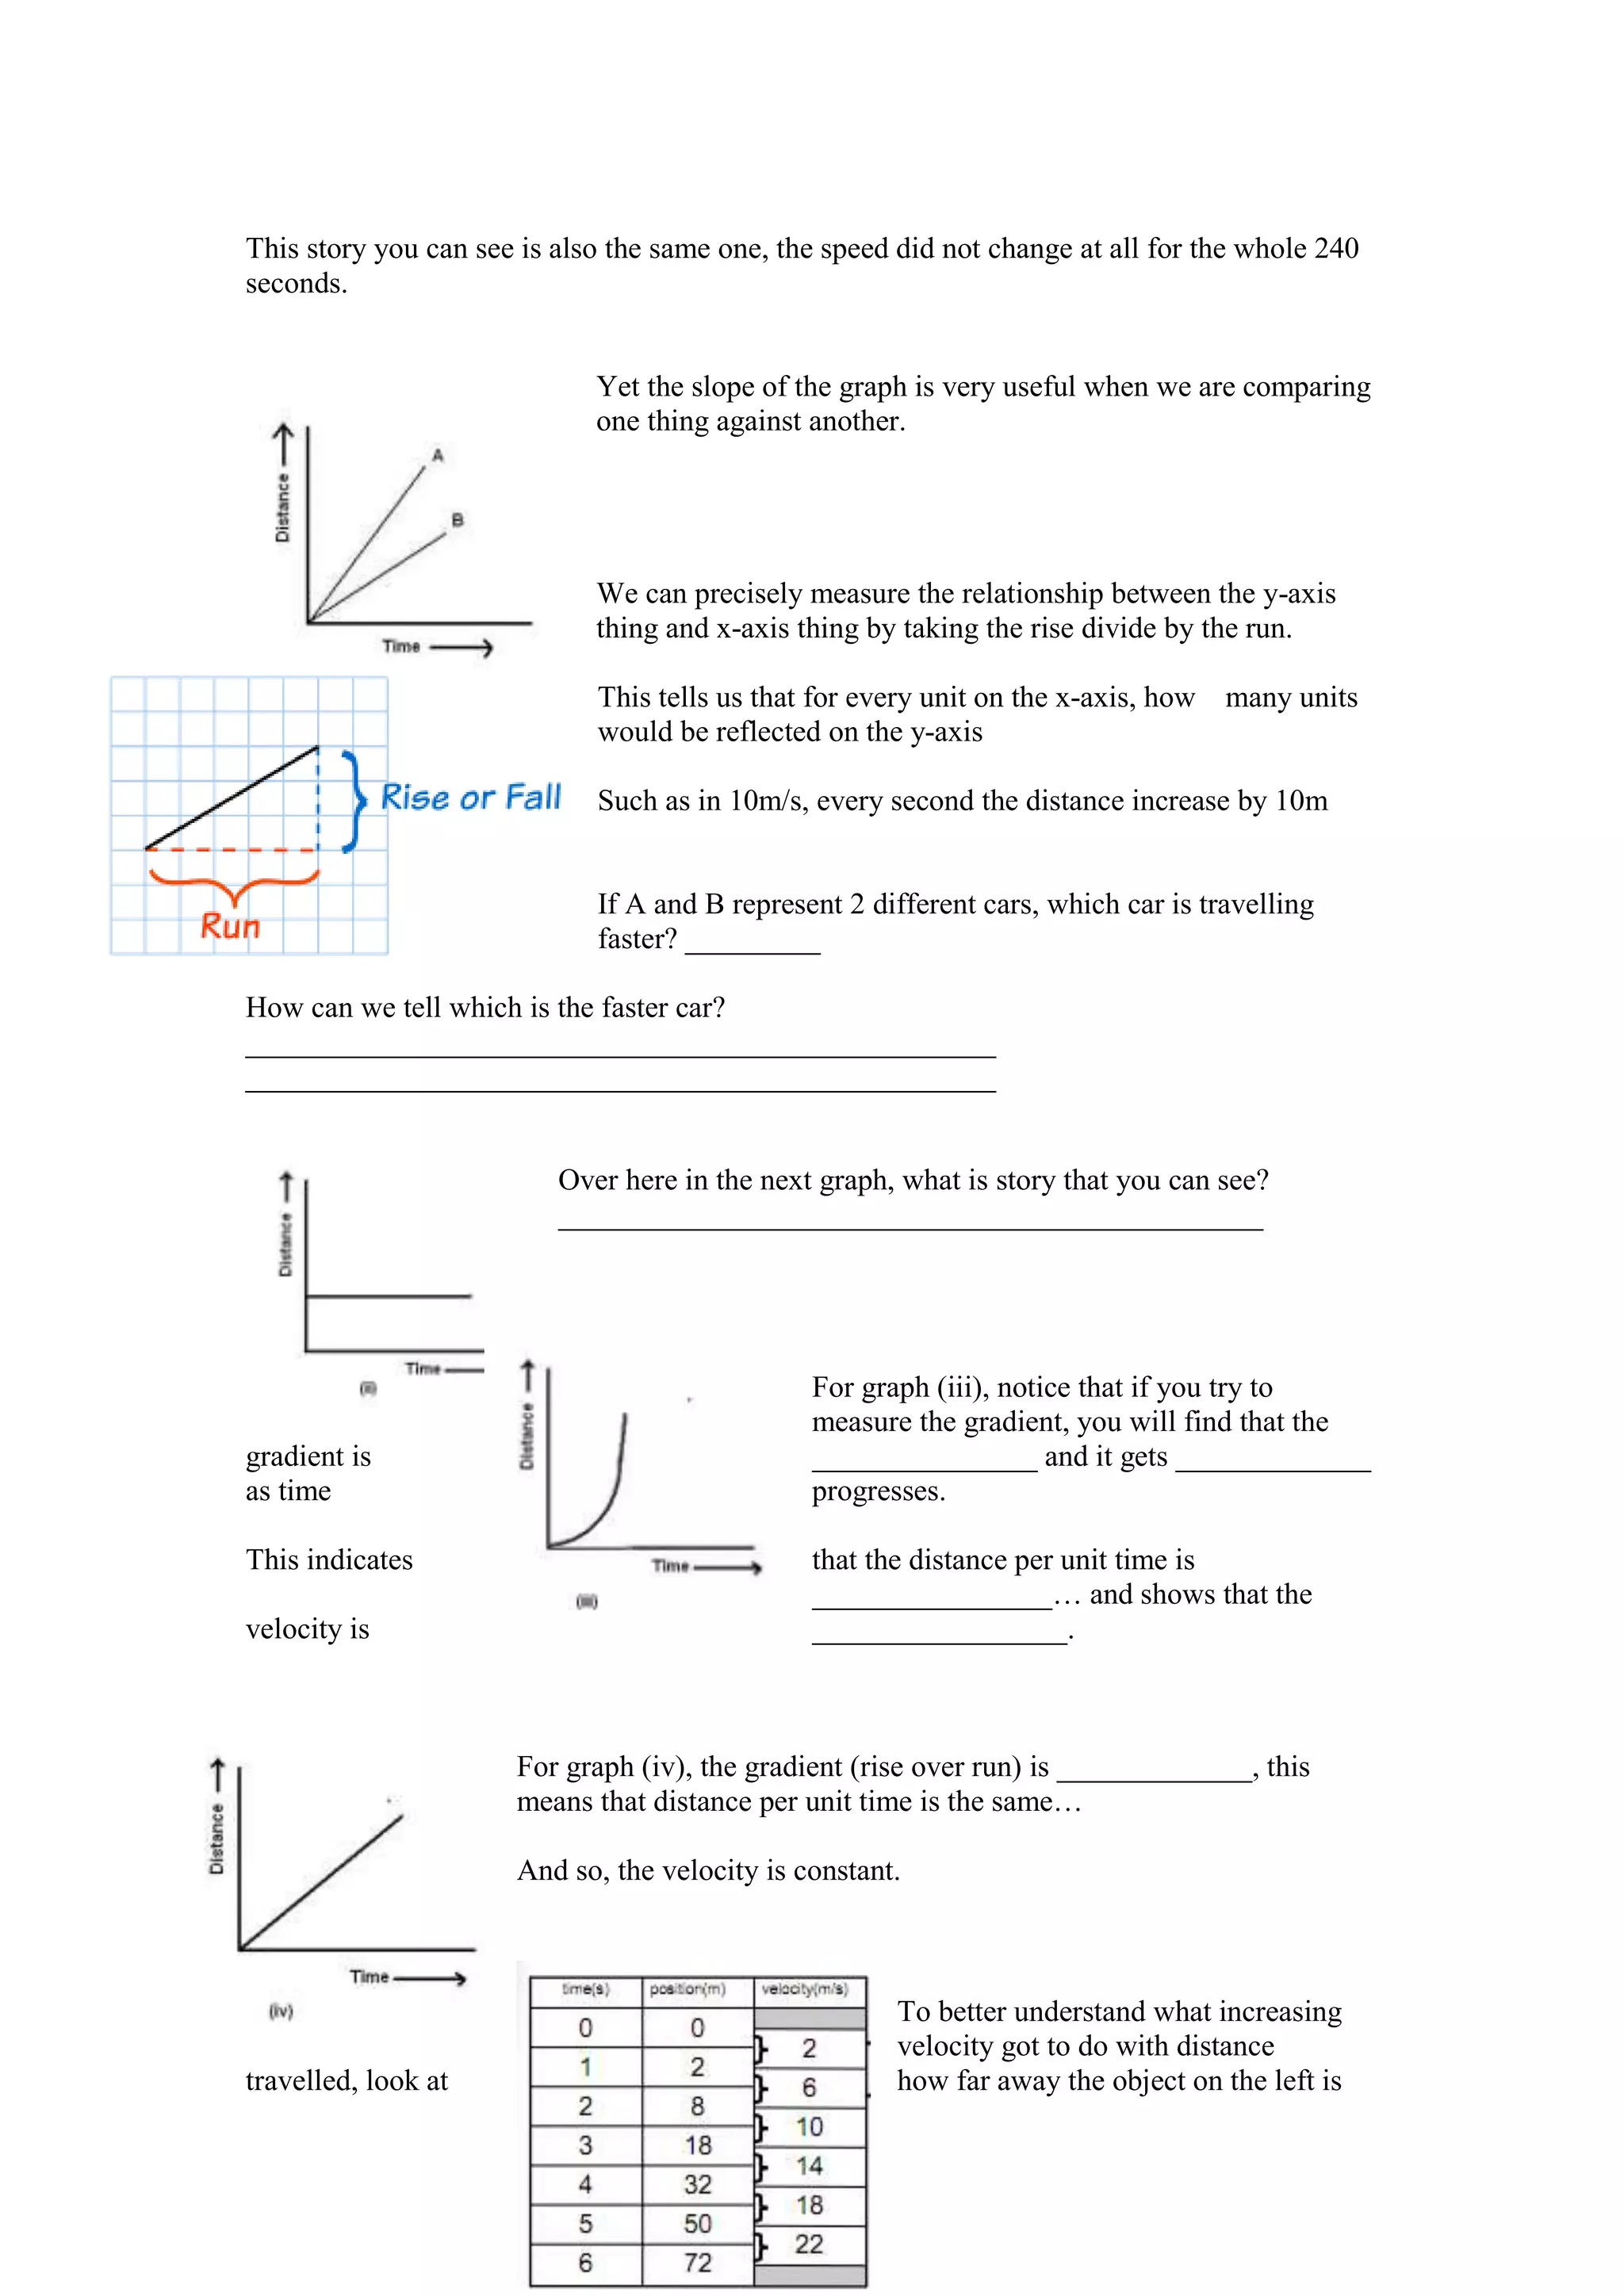
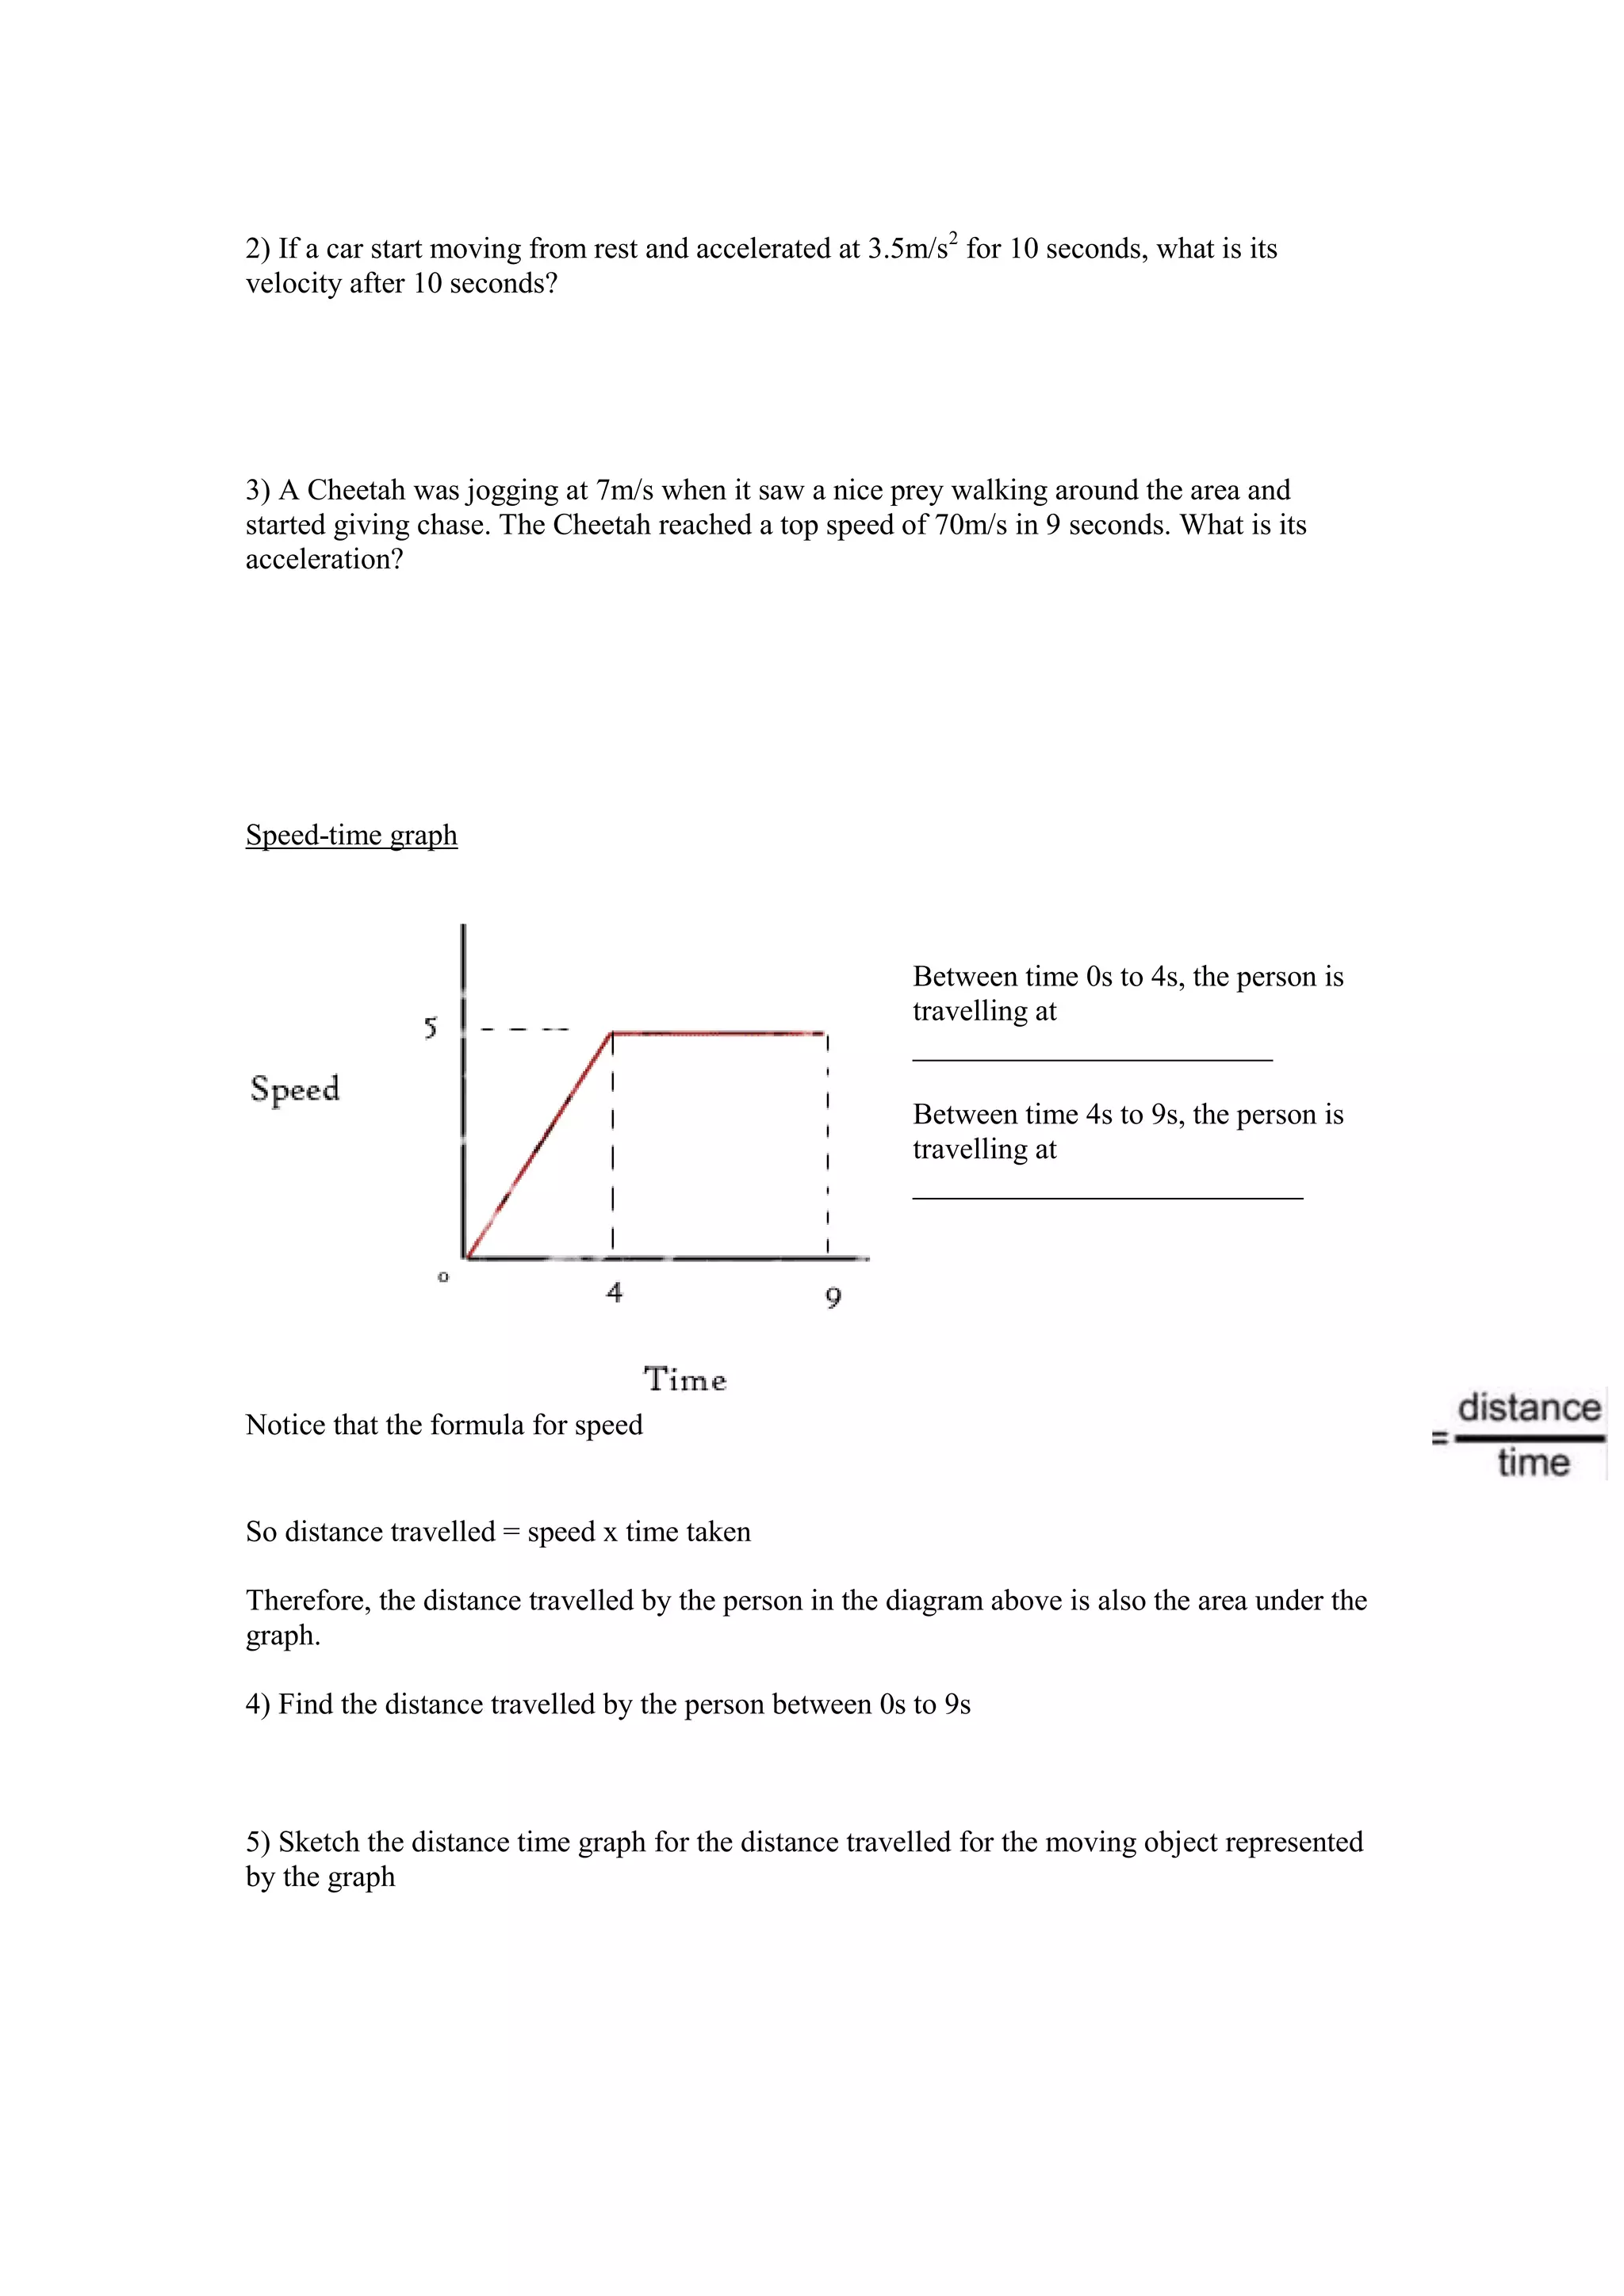
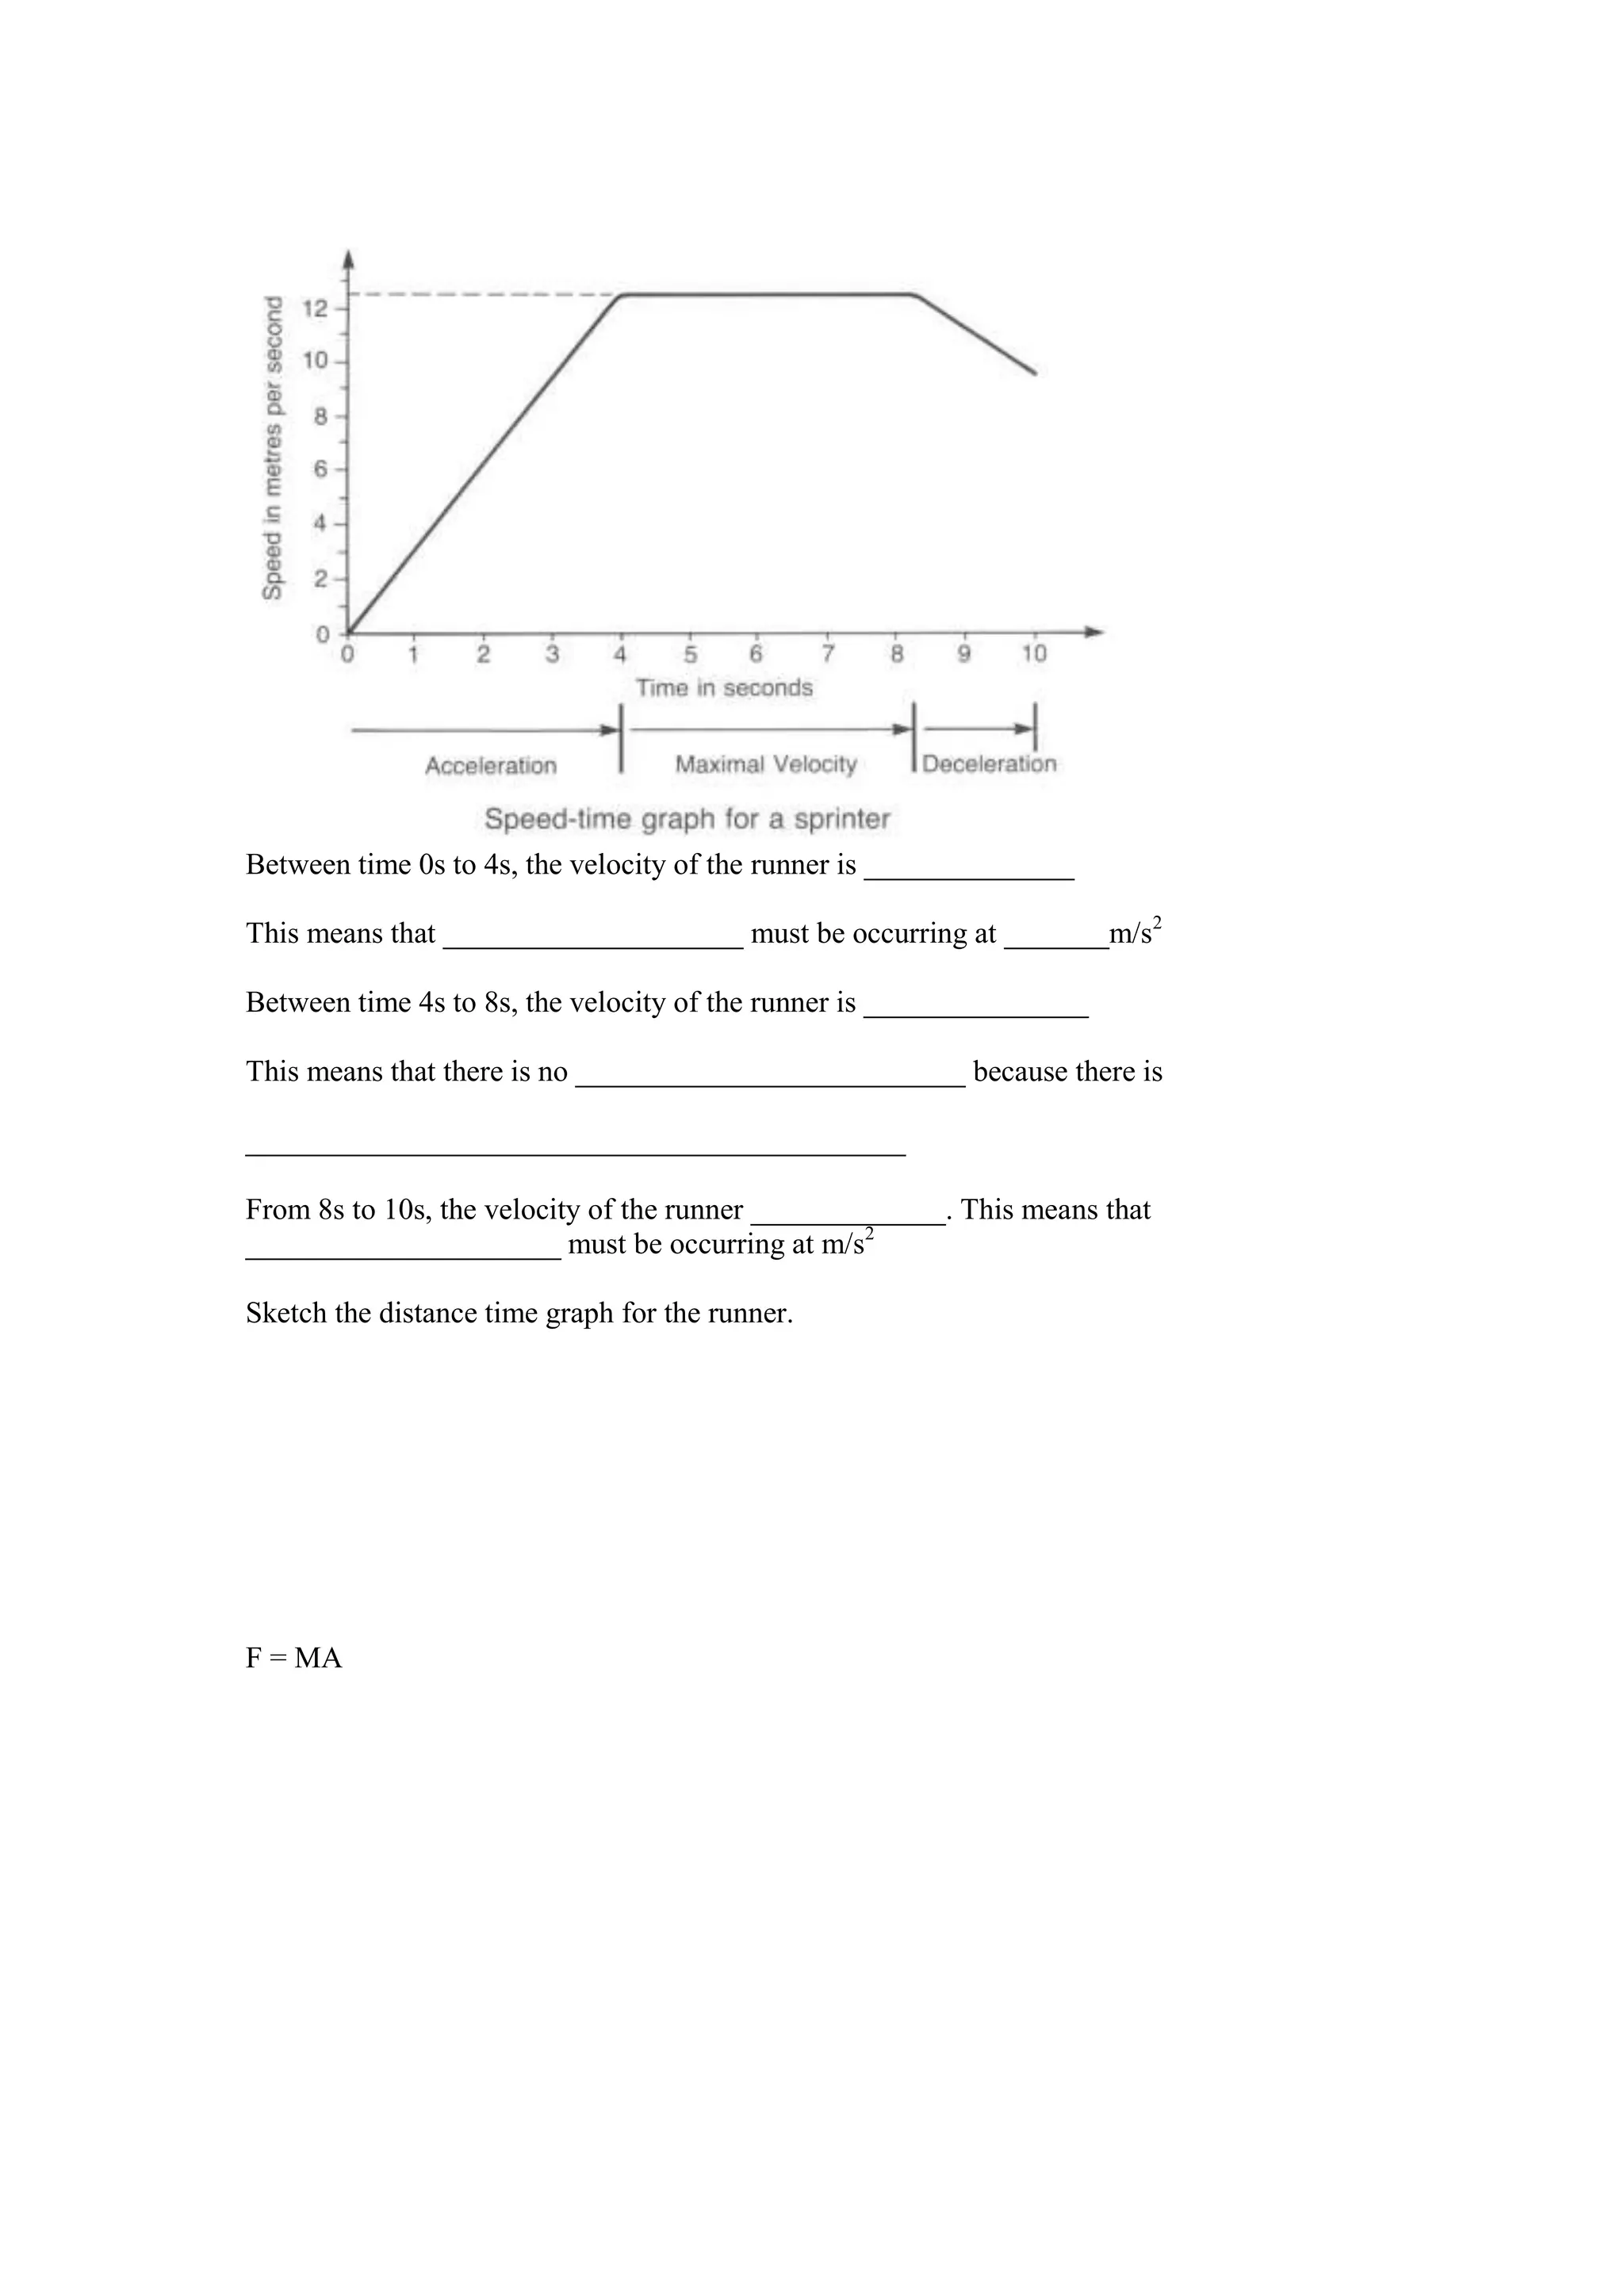
3) Graphs can show velocity, acceleration, distance, and other variables over time. Slope represents rate of change and can indicate if velocity or acceleration is constant or varying.


![Family.ppt[1]](https://cdn.slidesharecdn.com/ss_thumbnails/family-ppt1-101019145606-phpapp02-thumbnail.jpg?width=640&height=640&fit=bounds)


