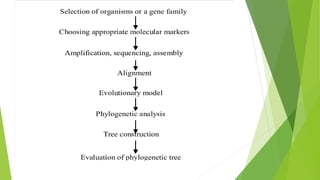
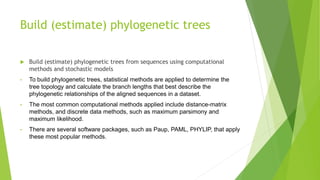
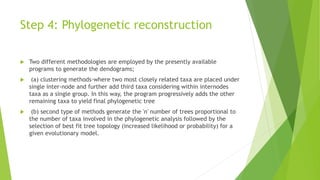
CONSTRUCTION OF
PHYLOGENETIC TREE
SWORNA KUMARI.C
PhD., Biotechnology
Hexacara Lifesciences pvt ltd
The basic steps in any phylogenetic
analysis
How To Construct A Phylogenetic Tree
 A phylogenetic tree is a visual representation of the relationship between
different organisms, showing the path through evolutionary time from a
common ancestor to different descendants.
 Similarities and divergence among related biological sequences revealed by
sequence alignment often have to be rationalized and visualized in the
context of phylogenetic trees. Thus, molecular phylogenetics is a
fundamental aspect of bioinformatics.
 Molecular phylogenetics is the branch of phylogeny that analyzes genetic,
hereditary molecular differences, predominately in DNA sequences, to gain
information on an organism’s evolutionary relationships.
How To Construct A Phylogenetic Tree
 The similarity of biological functions and molecular mechanisms in living
organisms strongly suggests that species descended from a common ancestor.
Molecular phylogenetics uses the structure and function of molecules and how
they change over time to infer these evolutionary relationships.
 From these analyses, it is possible to determine the processes by which
diversity among species has been achieved. The result of a molecular
phylogenetic analysis is expressed in a phylogenetic tree.
Assemble and align a dataset
• The first step is to identify a protein or DNA sequence of interest and assemble
a dataset consisting of other related sequences.
• DNA sequences of interest can be retrieved using NCBI BLAST or similar
search tools.
• Once sequences are selected and retrieved, multiple sequence alignment is
created.
• This involves arranging a set of sequences in a matrix to identify regions of
homology.
• There are many websites and software programs, such as ClustalW, MSA,
MAFFT, and T-Coffee, designed to perform multiple sequence on a given set of
molecular data.
Build (estimate) phylogenetic trees
 Build (estimate) phylogenetic trees from sequences using computational
methods and stochastic models
• To build phylogenetic trees, statistical methods are applied to determine the
tree topology and calculate the branch lengths that best describe the
phylogenetic relationships of the aligned sequences in a dataset.
• The most common computational methods applied include distance-matrix
methods, and discrete data methods, such as maximum parsimony and
maximum likelihood.
• There are several software packages, such as Paup, PAML, PHYLIP, that apply
these most popular methods.
Statistically test and assess the
estimated trees.
 Tree estimating algorithms generate one or more optimal trees.
 This set of possible trees is subjected to a series of statistical tests to
evaluate whether one tree is better than another – and if the proposed
phylogeny is reasonable.
 Common methods for assessing trees include the Bootstrap and Jackknife
Resampling methods, and analytical methods, such as parsimony, distance,
and likelihood.
Human Phylogenetic Tree
 As you can see in the diagram, every species or individual
(in this case) has a common ancestor, and that is your
grandparent. Then it splits up into two branches: your
parent and your aunt (sibling of your parent). And then
you, your sibling, and your cousins have a unique history
because you were born from different parents yet have the
same and common ancestor as your grandparent.
Animal Phylogenetic Tree
As you can see in the diagram, all animals have the same common
ancestor, but they are divided because of their different
characteristics. These characteristics are jaws, lungs,
gizzards, and feathers. Thus, these characteristics
differentiate between the animals mentioned in the diagram that
nevertheless have the same ancestor.
Programs
 PHYLIP, Mega and PAUPp (pronounced ‘pop star’) are the most comprehensive
and widely used phylogeny packages
Process of constructing Tree
 The whole process of construction of the phylogenetic tree is divided into five
different steps,
 Step 1: Choosing an appropriate markers for the phylogenetic analysis
 Step 2: Multiple sequence alignments
 Step 3: Selection of an evolutionary model
 Step 4: Phylogenetic reconstruction
 Step 5: Evaluation of the phylogenetic tree
Choosing an appropriate markers for the
phylogenetic analysis
 Any biological information that can be used to infer the evolutionary
relationship among the taxa is known as a phylogenetic information marker.
 It can be anything like DNA, RNA, protein, RFLP, AFLP, ISSR, allozymes, and
conserved intronic positions, etc. Identification of conserved genetic loci
(coding- or non-coding) is the first step in analyzing the phylogenetic
relationship.
 Both coding (genes) and non-coding genetic region can be used for the
analysis of phylogenetic relationships.
Step 2: Multiple sequence alignments
 Aligning two sequences is known as pair-wise sequence alignment, while the
alignment that includes more than two sequences is known as multiple
sequence alignments.
 The main aim of multiple sequence alignment is to compare the three or
more nucleotide or protein sequences and to provide the basis for calculation
of the sequence diversities/divergences to infer the evolutionary relationship
among the taxa.
Global vs. Local Alignment
 Global alignment algorithms which optimize overall alignment between two sequences
(Needleman & Wunsch)
 Local alignment algorithms which seek only relatively conserved pieces of sequence (Smith-
Waterman)
 Alignment stops at the ends of regions of strong similarity
 Favors finding conserved patterns in otherwise different pairs of sequences
Sequence 1 - LGPSSKQTGKGSSRIWDN
Sequence 2 - LNITKSAGKGAIMRLGDA
Multiple Sequence Alignment
Global alignment methods (both are progressive pairwise)
• ClustalW (most popular)
• PileUp (used in GCG package)
Local alignment methods
• Dialign
MSA – methods used....
PILEUP
 aligned pairwise using dynamic
programming algorithm
 scores - produce a phylogenetic tree
 then used to guide the alignment
 Result- global alignment produced by
the Needleman-Wunsch algorithm
 No gap modifications or sequence
weighting does not guarantee an
optimal alignment
 dependence of the final MSA on the
initial pairwise alignments
 For closely related sequences -
CLUSTAL
CLUSTAL
 Progressive Pairwise Alignment
(PPA)
 globally align most similar
sequences first
 construct a tree using neighbor-
joining
 align the sequences sequentially,
guided by the phylogenetic
relationships
 Gap penalties can be adjusted (
using other characteristics)
 It can re-align just selected
sequences or selected regions in an
existing alignment
 It can compute phylogenetic trees
from a set of aligned sequences.
Step 3: Selection of an evolutionary
model
 Selection of an evolutionary model follows the multiple sequence alignment.
 According to the neutral theory of evolution, most of the mutations are
neutral and can occur at the rate of 10-6 to 10-8.
 Considering this fact every site in a DNA sequence must have undergone
numerous substitutions that are proportional to the evolutionary time period.
Step 4: Phylogenetic reconstruction
 Two different methodologies are employed by the presently available
programs to generate the dendograms;
 (a) clustering methods-where two most closely related taxa are placed under
single inter-node and further add third taxa considering within internodes
taxa as a single group. In this way, the program progressively adds the other
remaining taxa to yield final phylogenetic tree
 (b) second type of methods generate the 'n' number of trees proportional to
the number of taxa involved in the phylogenetic analysis followed by the
selection of best fit tree topology (increased likelihood or probability) for a
given evolutionary model.
Step 5: evaluating the phylogenetic tree
 After successful construction of the phylogenetic tree, the next step involves
evaluation of the tree topology. This process can be performed using two
evaluation methods, namely bootstrap method and interior-branch test.
 The basic concept of bootstrap method is evaluation of the tree topology by
constructing phylogenetic trees equal to the given number of pseudo-data
replicates.
 In this way the user defined number of data pseudo-replicates is constructed
followed by corresponding phylogenetic trees.
Bioinformatics Tools for Phylogenetic
Analysis
• There are several bioinformatics tools and databases that can be used for
phylogenetic analysis.
• These include PANTHER, P-Pod, PFam, TreeFam, and the PhyloFacts
structural phylogenomic encyclopedia.
• Each of these databases uses different algorithms and draws on different
sources for sequence information, and therefore the trees estimated by
PANTHER, for example, may differ significantly from those generated by P-Pod
or PFam.
• As with all bioinformatics tools of this type, it is important to test different
methods, compare the results, then determine which database works best
(according to consensus results) for studies involving different types of
datasets.
phy prAC.pptx

phy prAC.pptx

  • 1.
    CONSTRUCTION OF PHYLOGENETIC TREE SWORNAKUMARI.C PhD., Biotechnology Hexacara Lifesciences pvt ltd
  • 2.
    The basic stepsin any phylogenetic analysis
  • 4.
    How To ConstructA Phylogenetic Tree  A phylogenetic tree is a visual representation of the relationship between different organisms, showing the path through evolutionary time from a common ancestor to different descendants.  Similarities and divergence among related biological sequences revealed by sequence alignment often have to be rationalized and visualized in the context of phylogenetic trees. Thus, molecular phylogenetics is a fundamental aspect of bioinformatics.  Molecular phylogenetics is the branch of phylogeny that analyzes genetic, hereditary molecular differences, predominately in DNA sequences, to gain information on an organism’s evolutionary relationships.
  • 5.
    How To ConstructA Phylogenetic Tree  The similarity of biological functions and molecular mechanisms in living organisms strongly suggests that species descended from a common ancestor. Molecular phylogenetics uses the structure and function of molecules and how they change over time to infer these evolutionary relationships.  From these analyses, it is possible to determine the processes by which diversity among species has been achieved. The result of a molecular phylogenetic analysis is expressed in a phylogenetic tree.
  • 6.
    Assemble and aligna dataset • The first step is to identify a protein or DNA sequence of interest and assemble a dataset consisting of other related sequences. • DNA sequences of interest can be retrieved using NCBI BLAST or similar search tools. • Once sequences are selected and retrieved, multiple sequence alignment is created. • This involves arranging a set of sequences in a matrix to identify regions of homology. • There are many websites and software programs, such as ClustalW, MSA, MAFFT, and T-Coffee, designed to perform multiple sequence on a given set of molecular data.
  • 7.
    Build (estimate) phylogenetictrees  Build (estimate) phylogenetic trees from sequences using computational methods and stochastic models • To build phylogenetic trees, statistical methods are applied to determine the tree topology and calculate the branch lengths that best describe the phylogenetic relationships of the aligned sequences in a dataset. • The most common computational methods applied include distance-matrix methods, and discrete data methods, such as maximum parsimony and maximum likelihood. • There are several software packages, such as Paup, PAML, PHYLIP, that apply these most popular methods.
  • 8.
    Statistically test andassess the estimated trees.  Tree estimating algorithms generate one or more optimal trees.  This set of possible trees is subjected to a series of statistical tests to evaluate whether one tree is better than another – and if the proposed phylogeny is reasonable.  Common methods for assessing trees include the Bootstrap and Jackknife Resampling methods, and analytical methods, such as parsimony, distance, and likelihood.
  • 9.
    Human Phylogenetic Tree As you can see in the diagram, every species or individual (in this case) has a common ancestor, and that is your grandparent. Then it splits up into two branches: your parent and your aunt (sibling of your parent). And then you, your sibling, and your cousins have a unique history because you were born from different parents yet have the same and common ancestor as your grandparent.
  • 10.
    Animal Phylogenetic Tree Asyou can see in the diagram, all animals have the same common ancestor, but they are divided because of their different characteristics. These characteristics are jaws, lungs, gizzards, and feathers. Thus, these characteristics differentiate between the animals mentioned in the diagram that nevertheless have the same ancestor.
  • 11.
    Programs  PHYLIP, Megaand PAUPp (pronounced ‘pop star’) are the most comprehensive and widely used phylogeny packages
  • 12.
    Process of constructingTree  The whole process of construction of the phylogenetic tree is divided into five different steps,  Step 1: Choosing an appropriate markers for the phylogenetic analysis  Step 2: Multiple sequence alignments  Step 3: Selection of an evolutionary model  Step 4: Phylogenetic reconstruction  Step 5: Evaluation of the phylogenetic tree
  • 13.
    Choosing an appropriatemarkers for the phylogenetic analysis  Any biological information that can be used to infer the evolutionary relationship among the taxa is known as a phylogenetic information marker.  It can be anything like DNA, RNA, protein, RFLP, AFLP, ISSR, allozymes, and conserved intronic positions, etc. Identification of conserved genetic loci (coding- or non-coding) is the first step in analyzing the phylogenetic relationship.  Both coding (genes) and non-coding genetic region can be used for the analysis of phylogenetic relationships.
  • 14.
    Step 2: Multiplesequence alignments  Aligning two sequences is known as pair-wise sequence alignment, while the alignment that includes more than two sequences is known as multiple sequence alignments.  The main aim of multiple sequence alignment is to compare the three or more nucleotide or protein sequences and to provide the basis for calculation of the sequence diversities/divergences to infer the evolutionary relationship among the taxa.
  • 15.
    Global vs. LocalAlignment  Global alignment algorithms which optimize overall alignment between two sequences (Needleman & Wunsch)  Local alignment algorithms which seek only relatively conserved pieces of sequence (Smith- Waterman)  Alignment stops at the ends of regions of strong similarity  Favors finding conserved patterns in otherwise different pairs of sequences Sequence 1 - LGPSSKQTGKGSSRIWDN Sequence 2 - LNITKSAGKGAIMRLGDA
  • 16.
  • 17.
    Global alignment methods(both are progressive pairwise) • ClustalW (most popular) • PileUp (used in GCG package) Local alignment methods • Dialign MSA – methods used.... PILEUP  aligned pairwise using dynamic programming algorithm  scores - produce a phylogenetic tree  then used to guide the alignment  Result- global alignment produced by the Needleman-Wunsch algorithm  No gap modifications or sequence weighting does not guarantee an optimal alignment  dependence of the final MSA on the initial pairwise alignments  For closely related sequences - CLUSTAL CLUSTAL  Progressive Pairwise Alignment (PPA)  globally align most similar sequences first  construct a tree using neighbor- joining  align the sequences sequentially, guided by the phylogenetic relationships  Gap penalties can be adjusted ( using other characteristics)  It can re-align just selected sequences or selected regions in an existing alignment  It can compute phylogenetic trees from a set of aligned sequences.
  • 18.
    Step 3: Selectionof an evolutionary model  Selection of an evolutionary model follows the multiple sequence alignment.  According to the neutral theory of evolution, most of the mutations are neutral and can occur at the rate of 10-6 to 10-8.  Considering this fact every site in a DNA sequence must have undergone numerous substitutions that are proportional to the evolutionary time period.
  • 19.
    Step 4: Phylogeneticreconstruction  Two different methodologies are employed by the presently available programs to generate the dendograms;  (a) clustering methods-where two most closely related taxa are placed under single inter-node and further add third taxa considering within internodes taxa as a single group. In this way, the program progressively adds the other remaining taxa to yield final phylogenetic tree  (b) second type of methods generate the 'n' number of trees proportional to the number of taxa involved in the phylogenetic analysis followed by the selection of best fit tree topology (increased likelihood or probability) for a given evolutionary model.
  • 20.
    Step 5: evaluatingthe phylogenetic tree  After successful construction of the phylogenetic tree, the next step involves evaluation of the tree topology. This process can be performed using two evaluation methods, namely bootstrap method and interior-branch test.  The basic concept of bootstrap method is evaluation of the tree topology by constructing phylogenetic trees equal to the given number of pseudo-data replicates.  In this way the user defined number of data pseudo-replicates is constructed followed by corresponding phylogenetic trees.
  • 21.
    Bioinformatics Tools forPhylogenetic Analysis • There are several bioinformatics tools and databases that can be used for phylogenetic analysis. • These include PANTHER, P-Pod, PFam, TreeFam, and the PhyloFacts structural phylogenomic encyclopedia. • Each of these databases uses different algorithms and draws on different sources for sequence information, and therefore the trees estimated by PANTHER, for example, may differ significantly from those generated by P-Pod or PFam. • As with all bioinformatics tools of this type, it is important to test different methods, compare the results, then determine which database works best (according to consensus results) for studies involving different types of datasets.