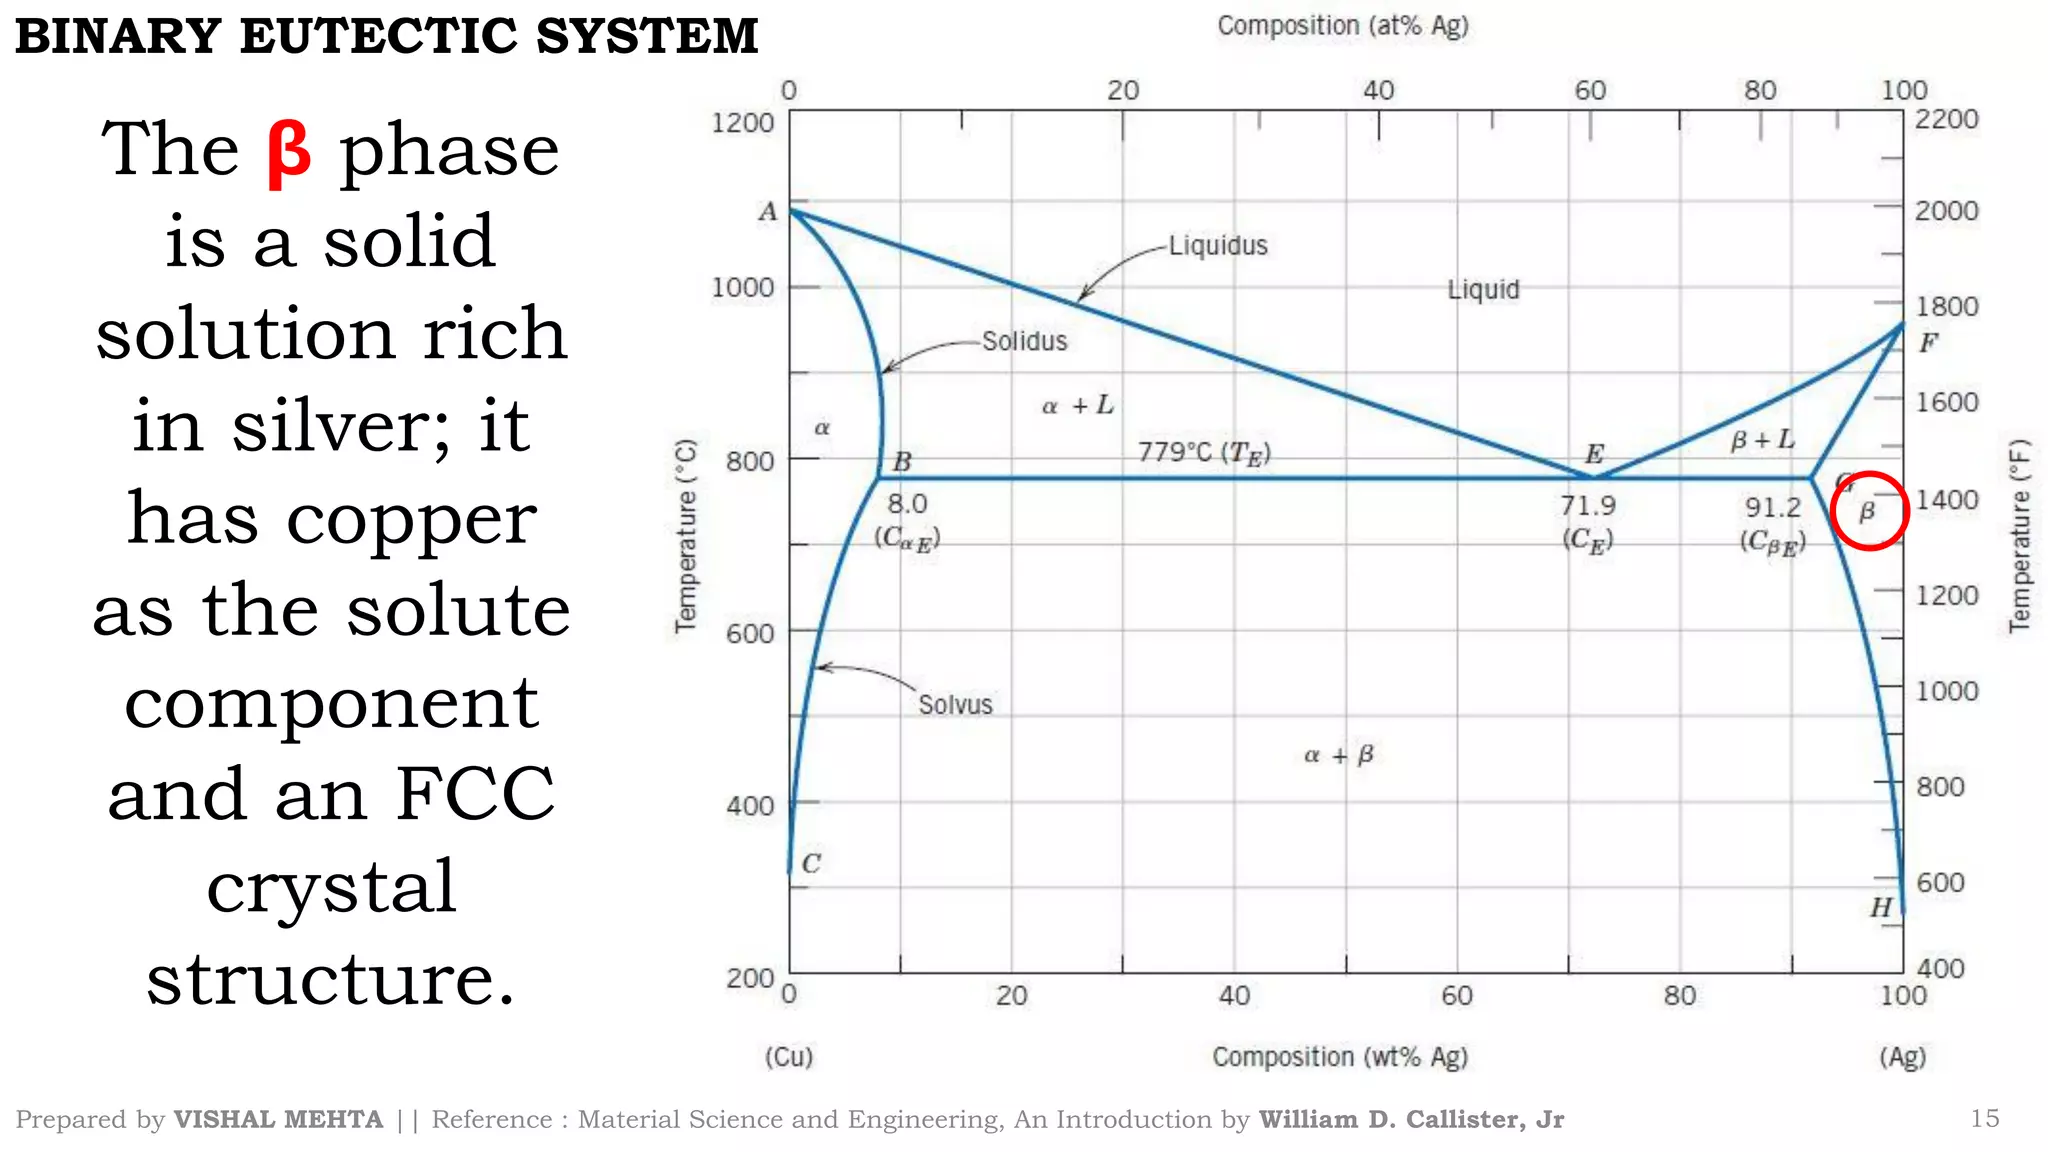
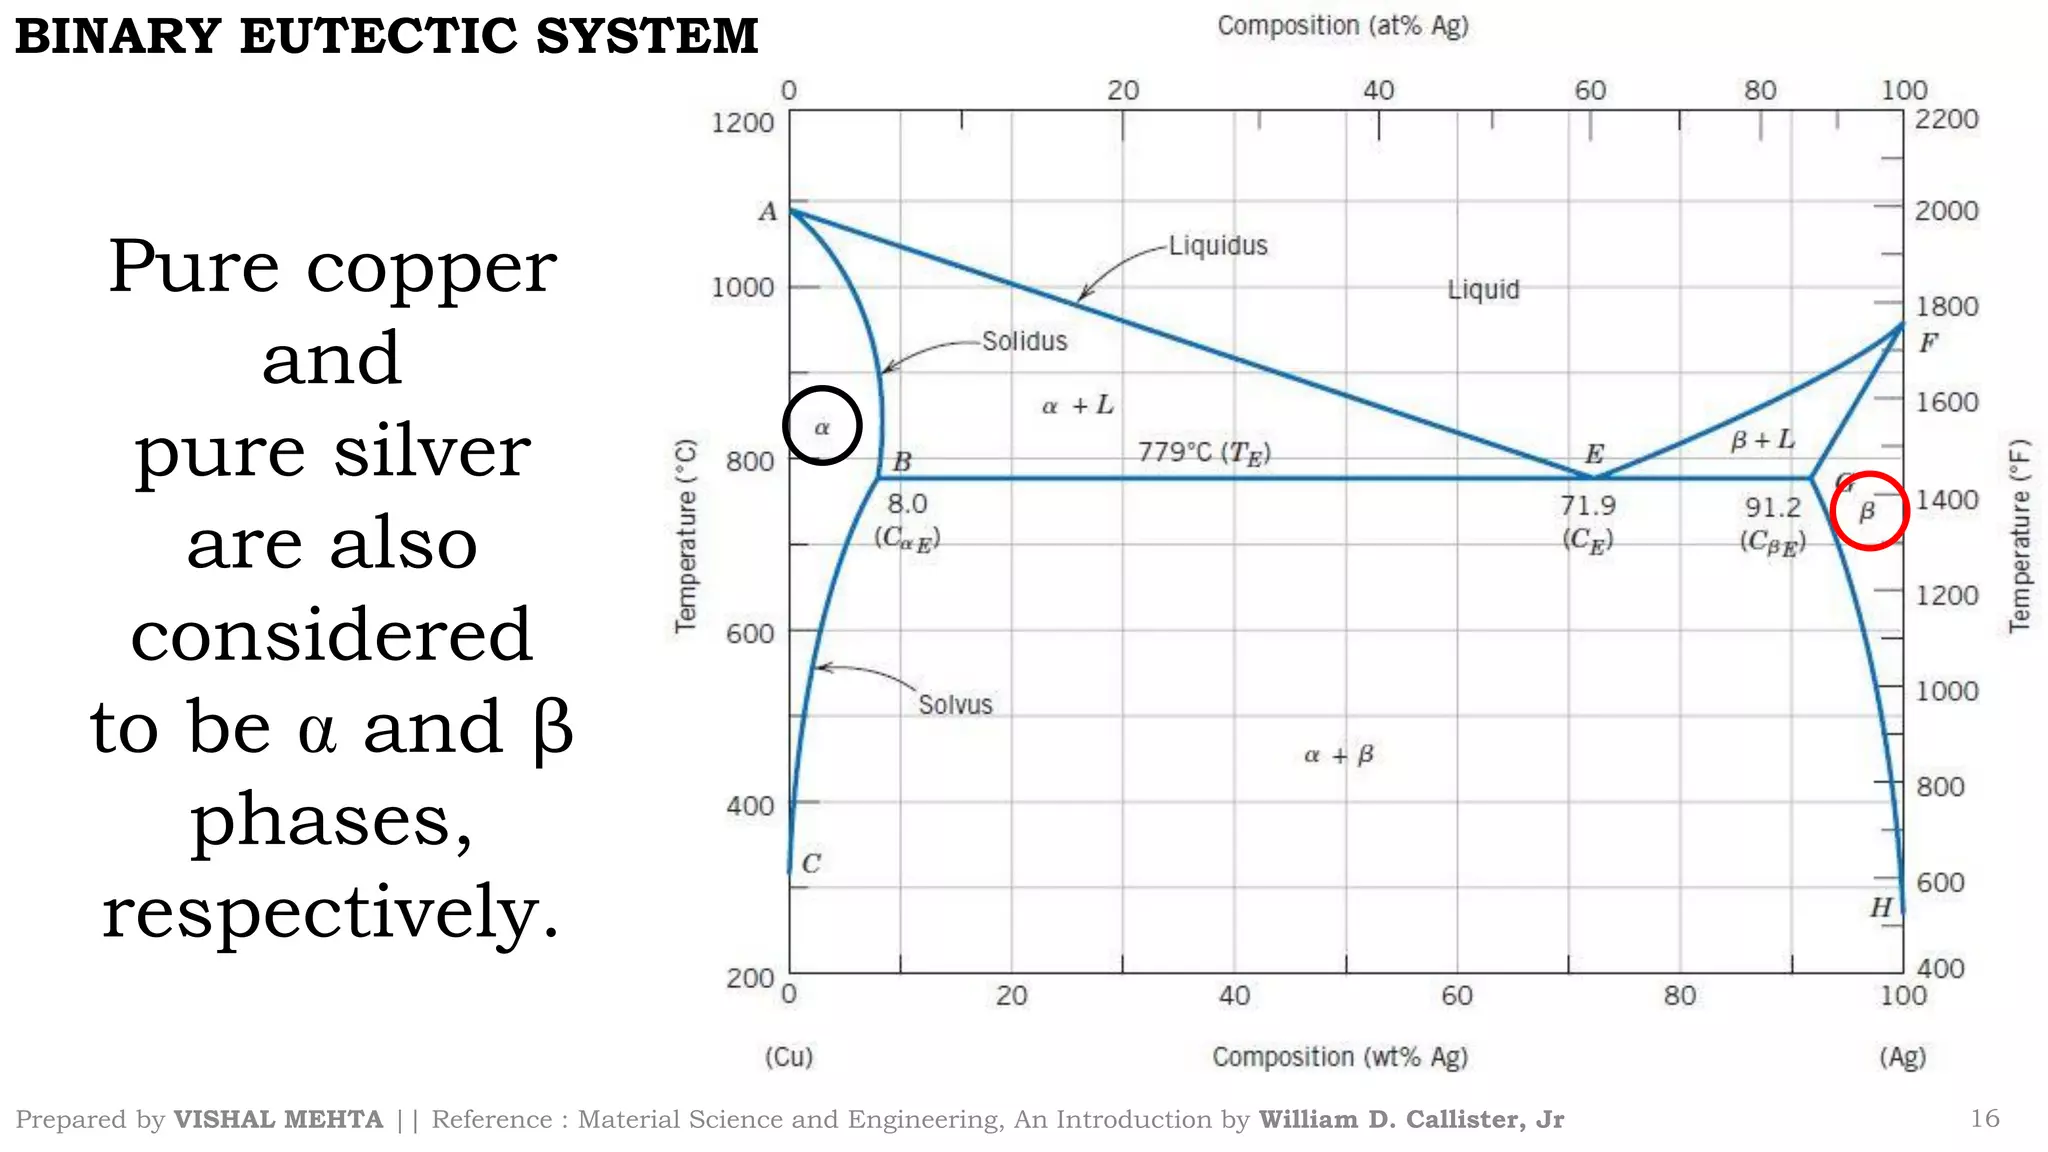
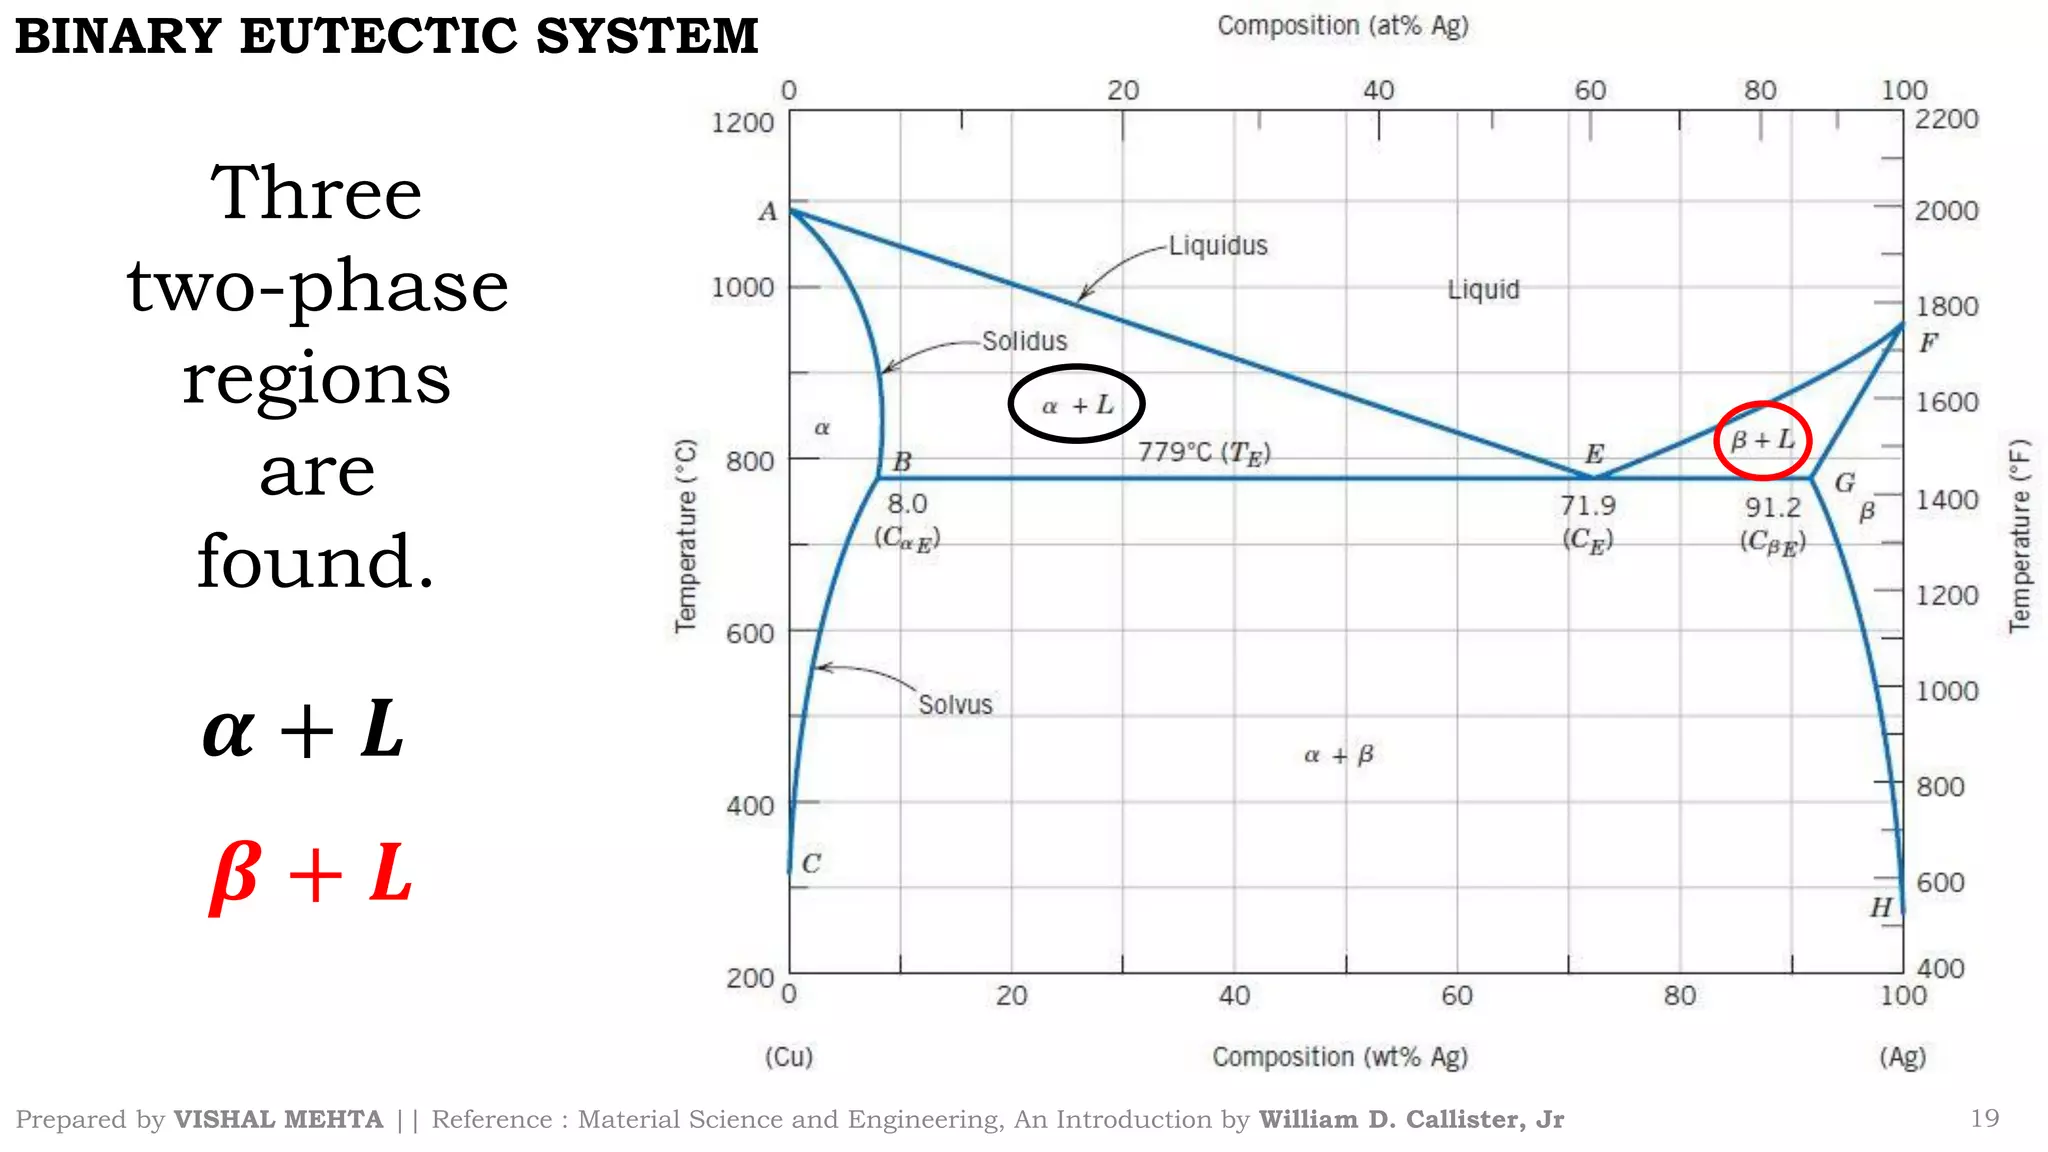
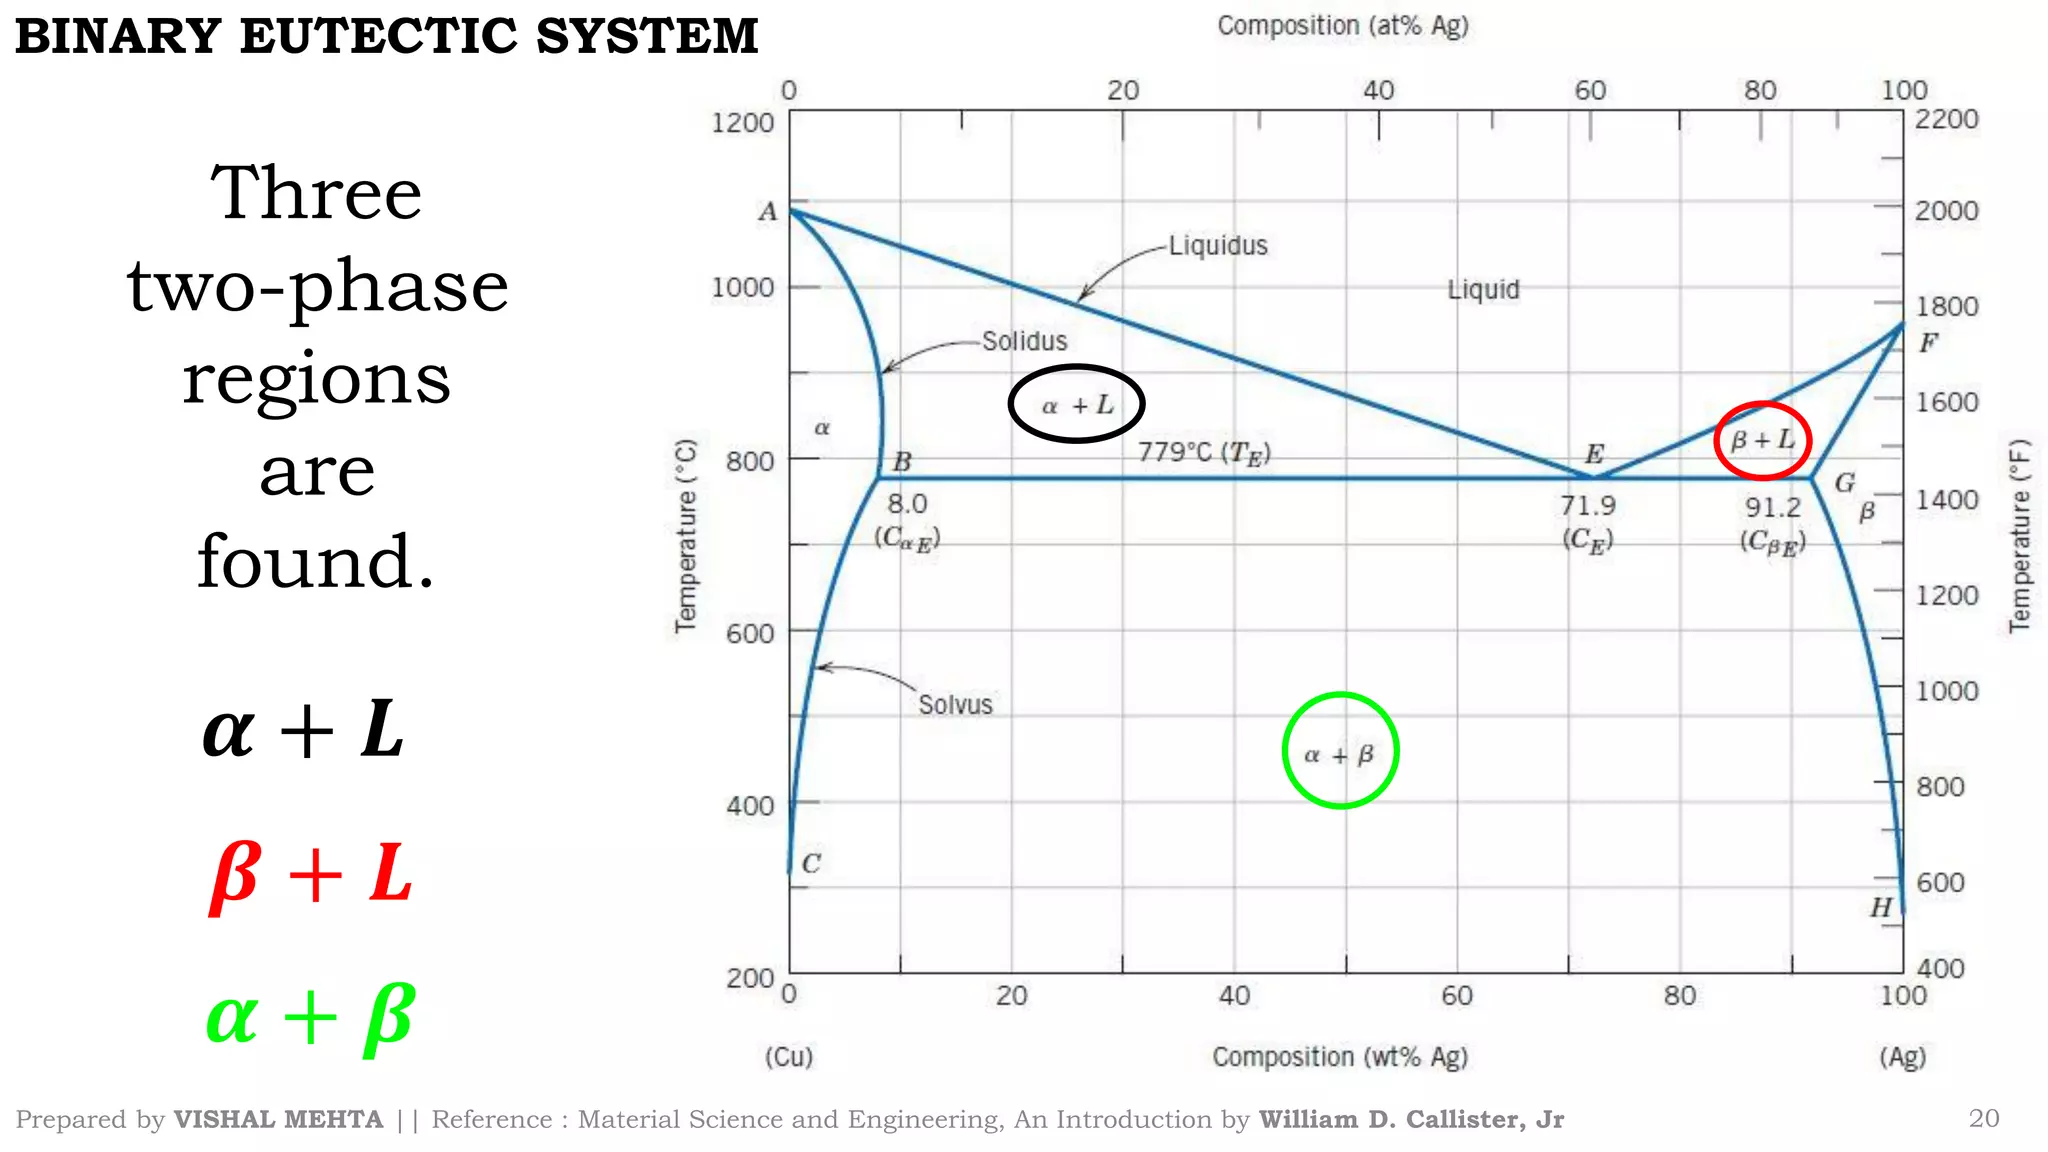
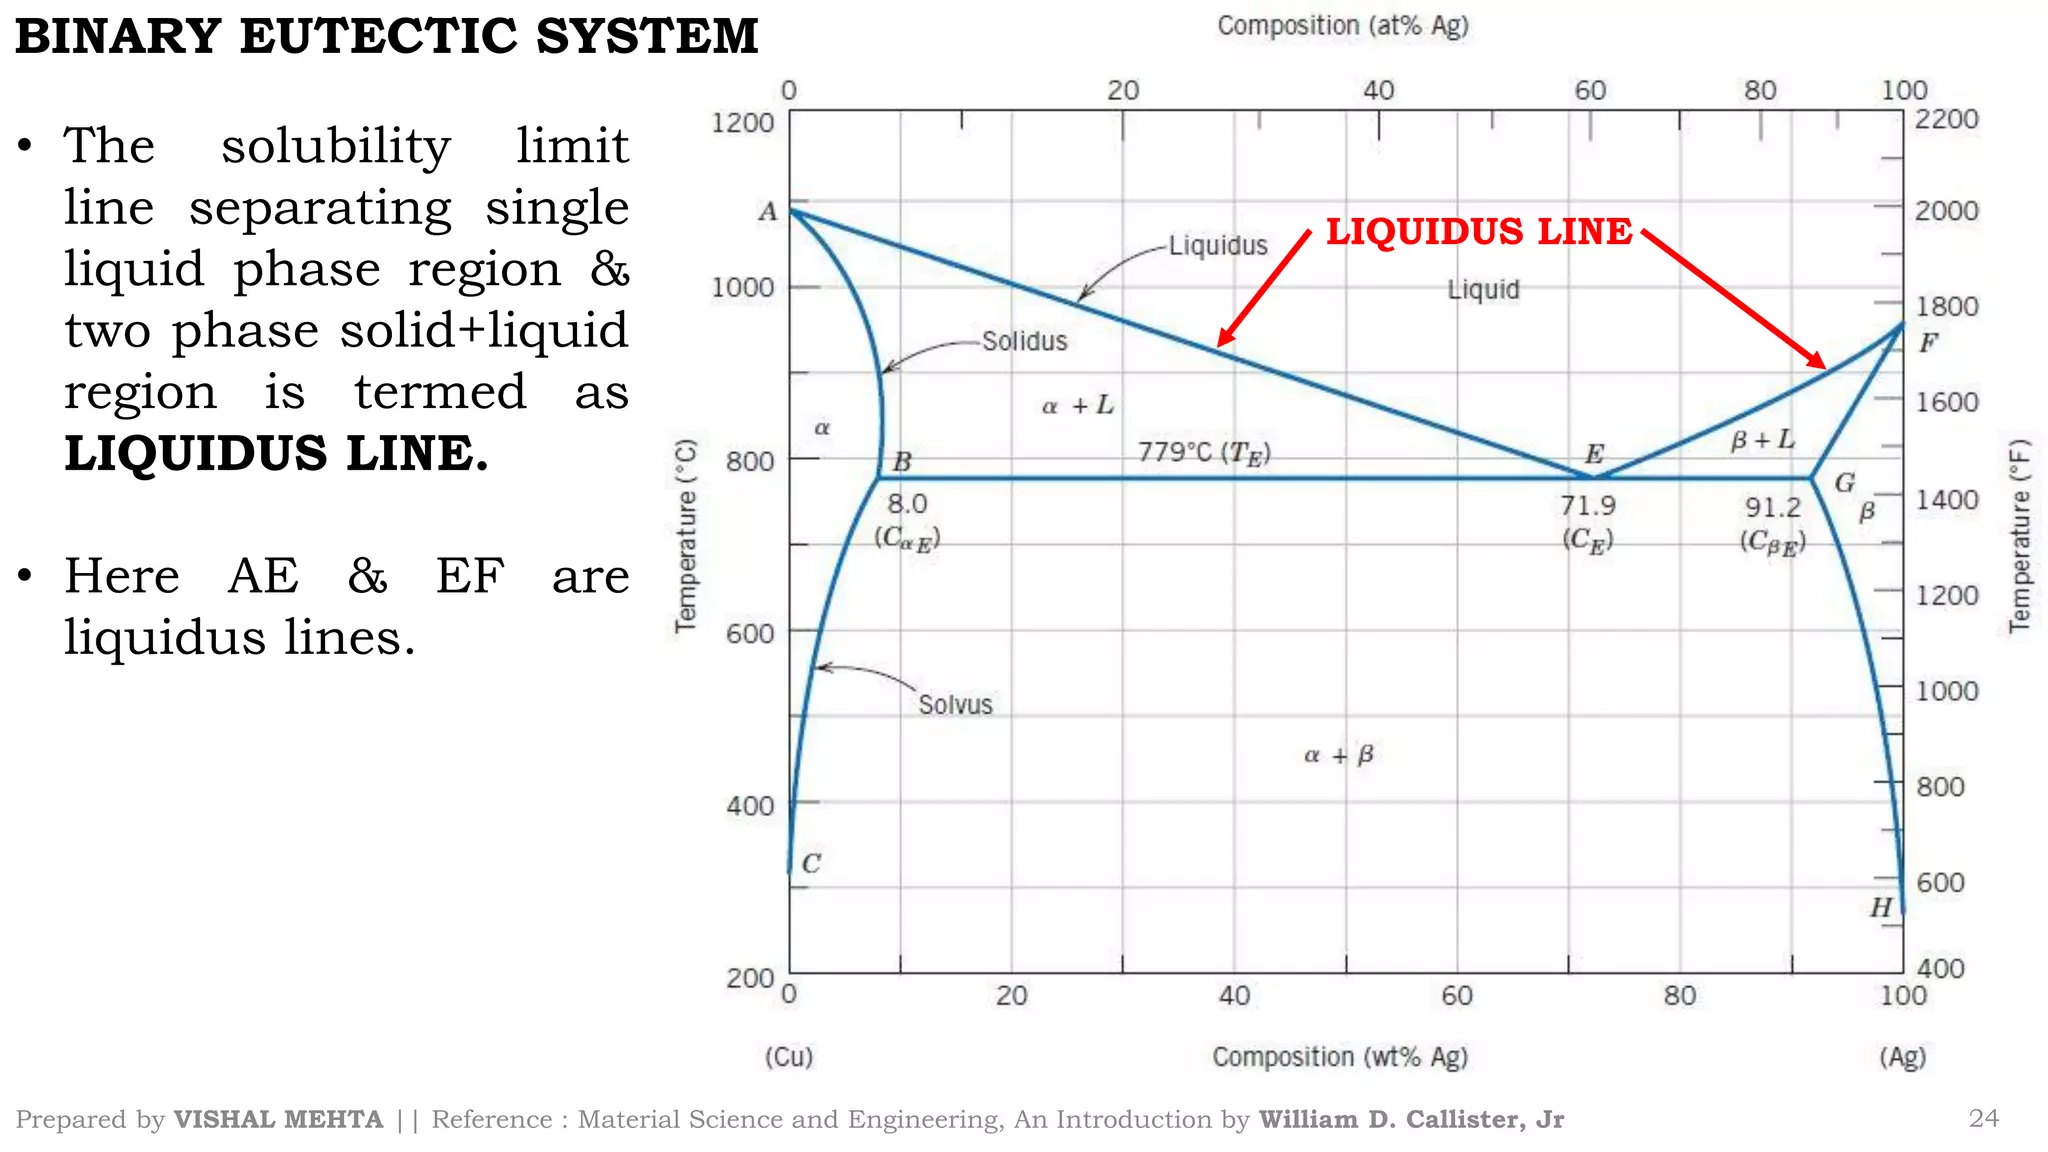
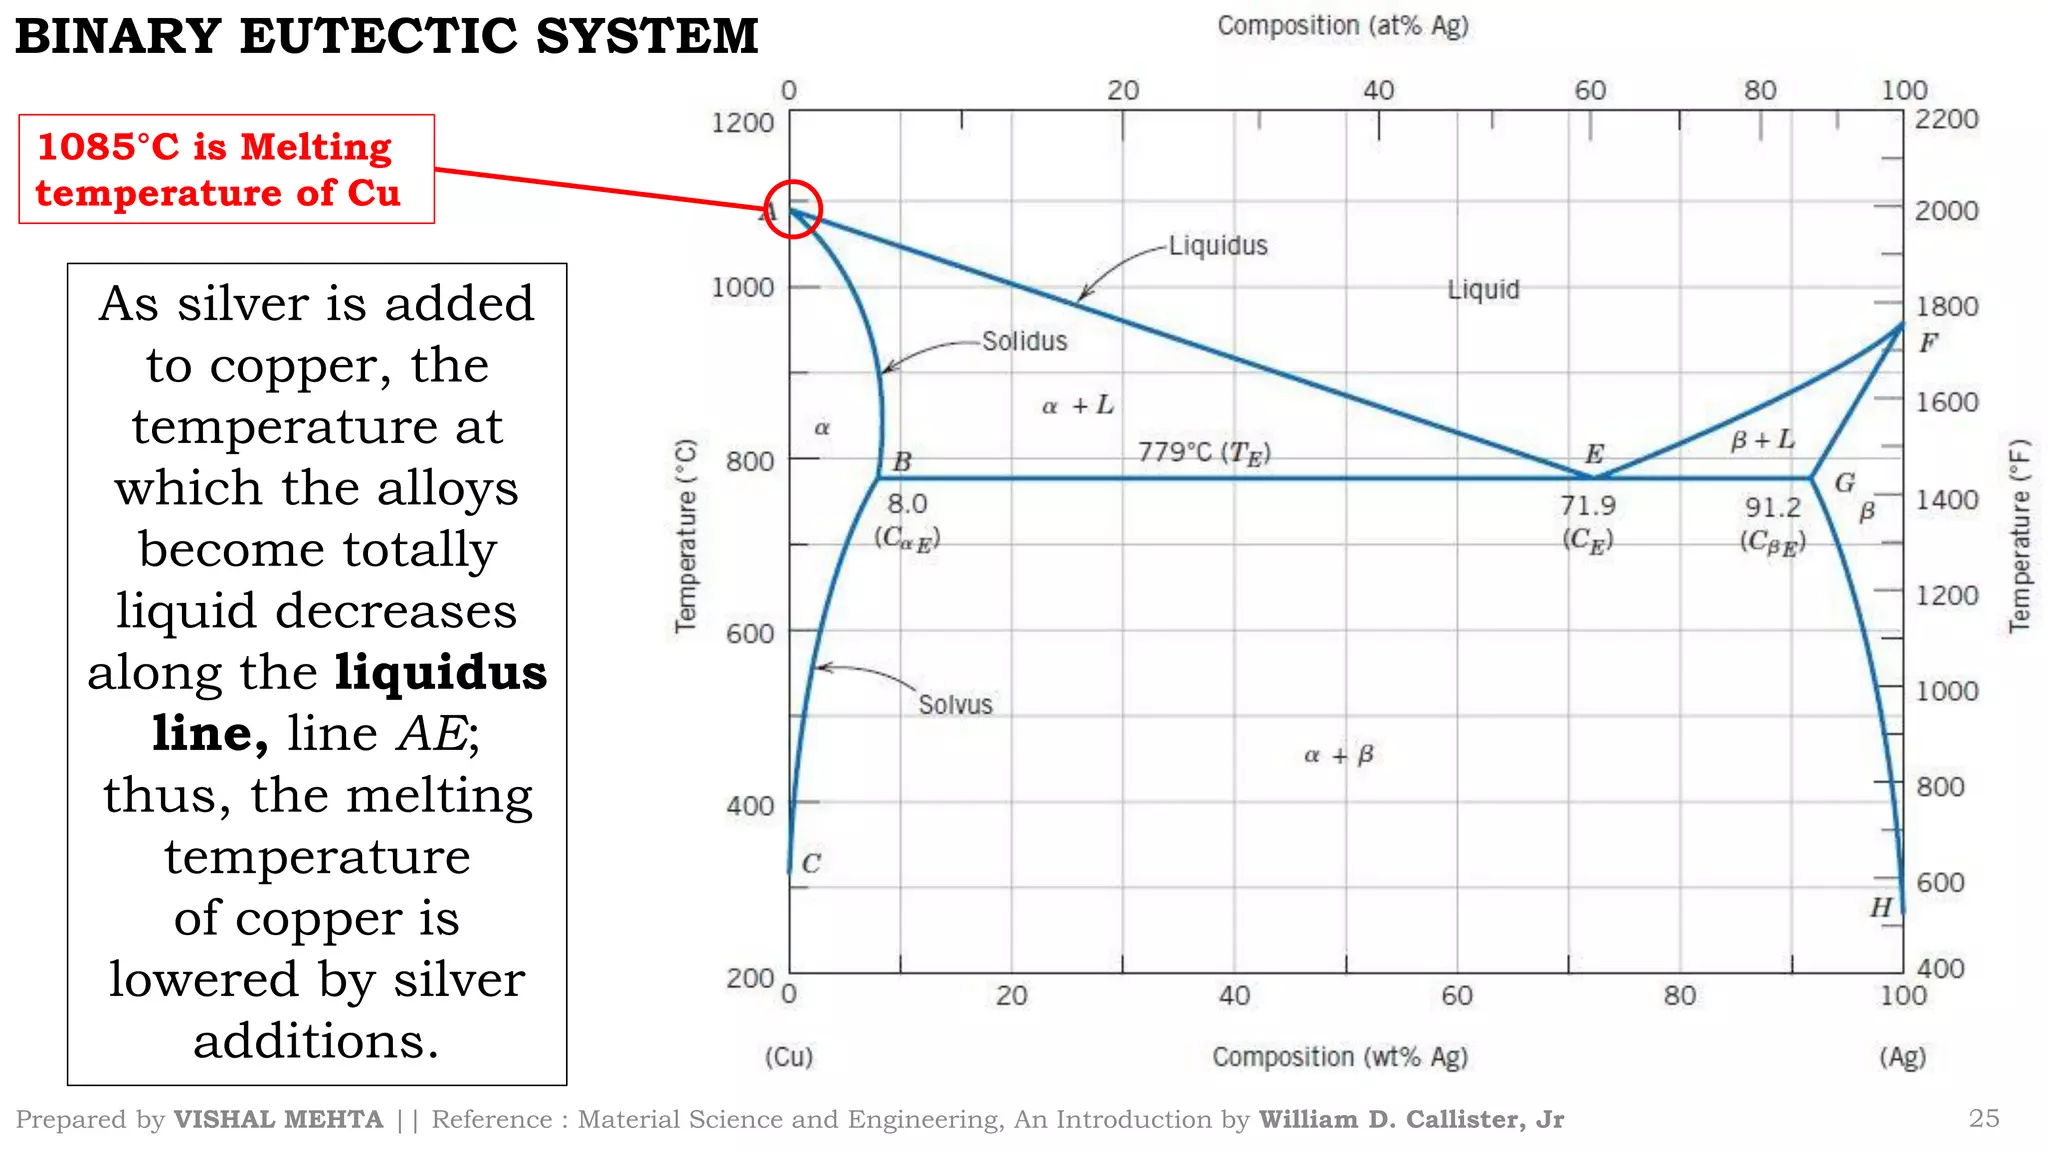
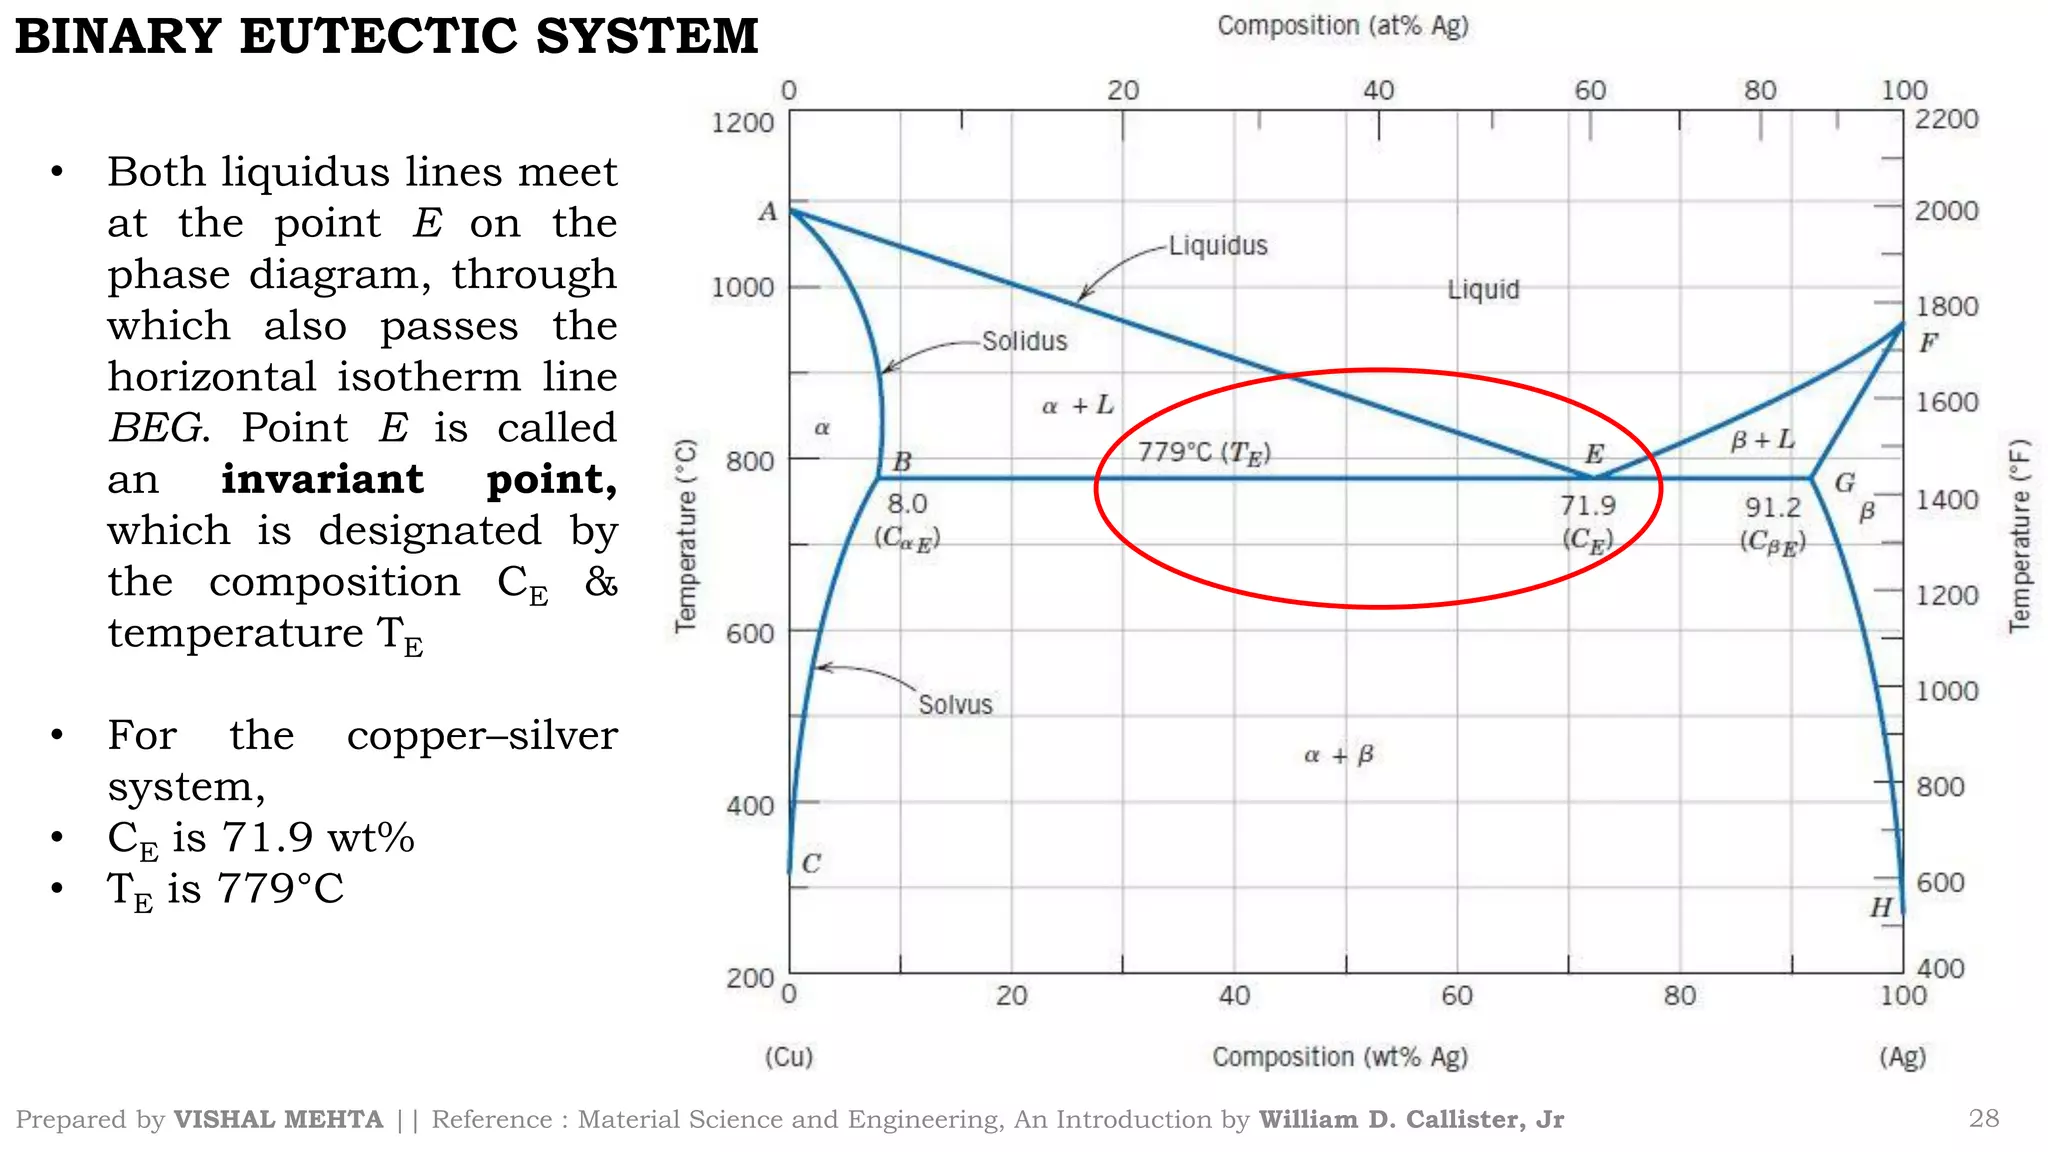
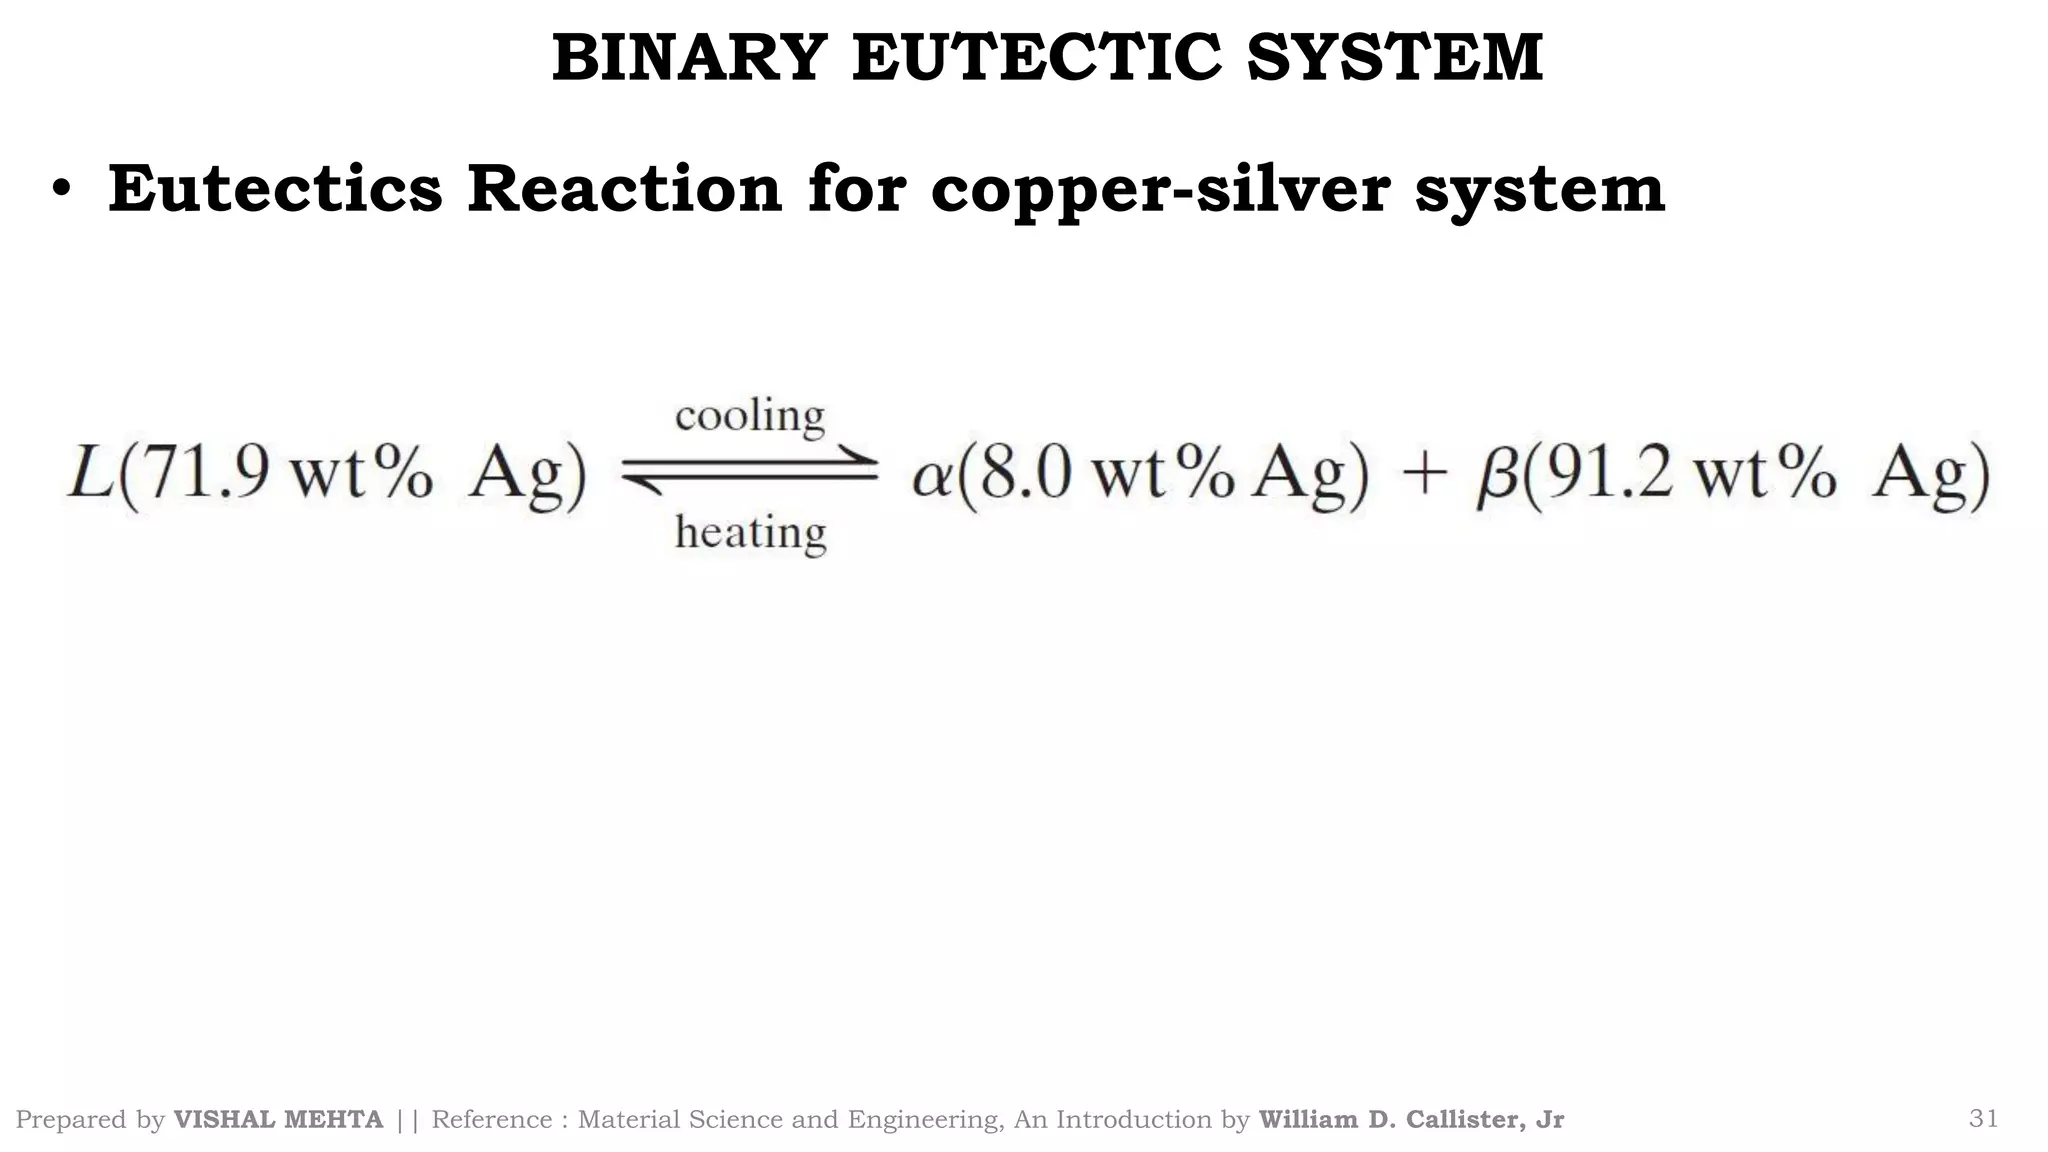
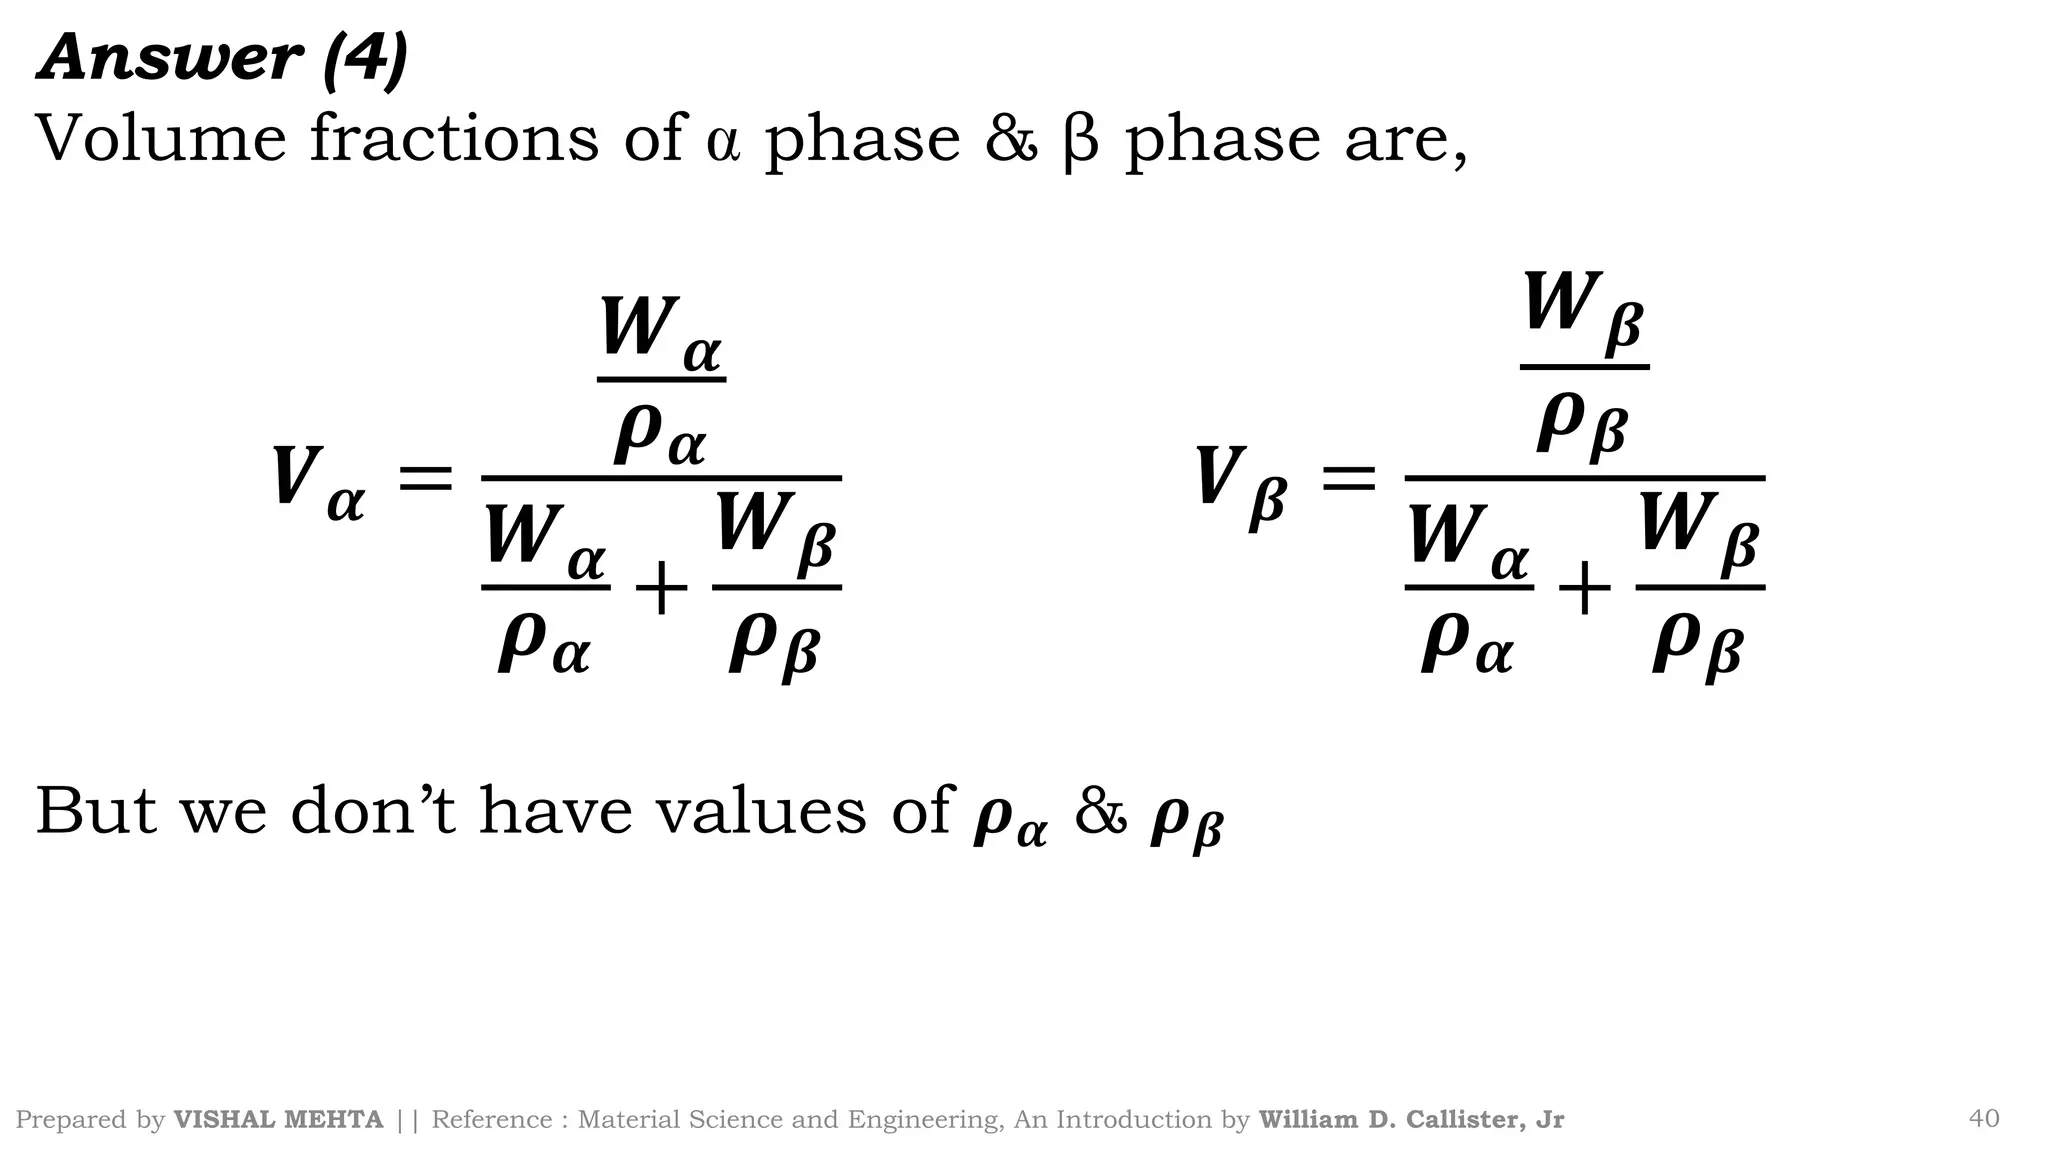
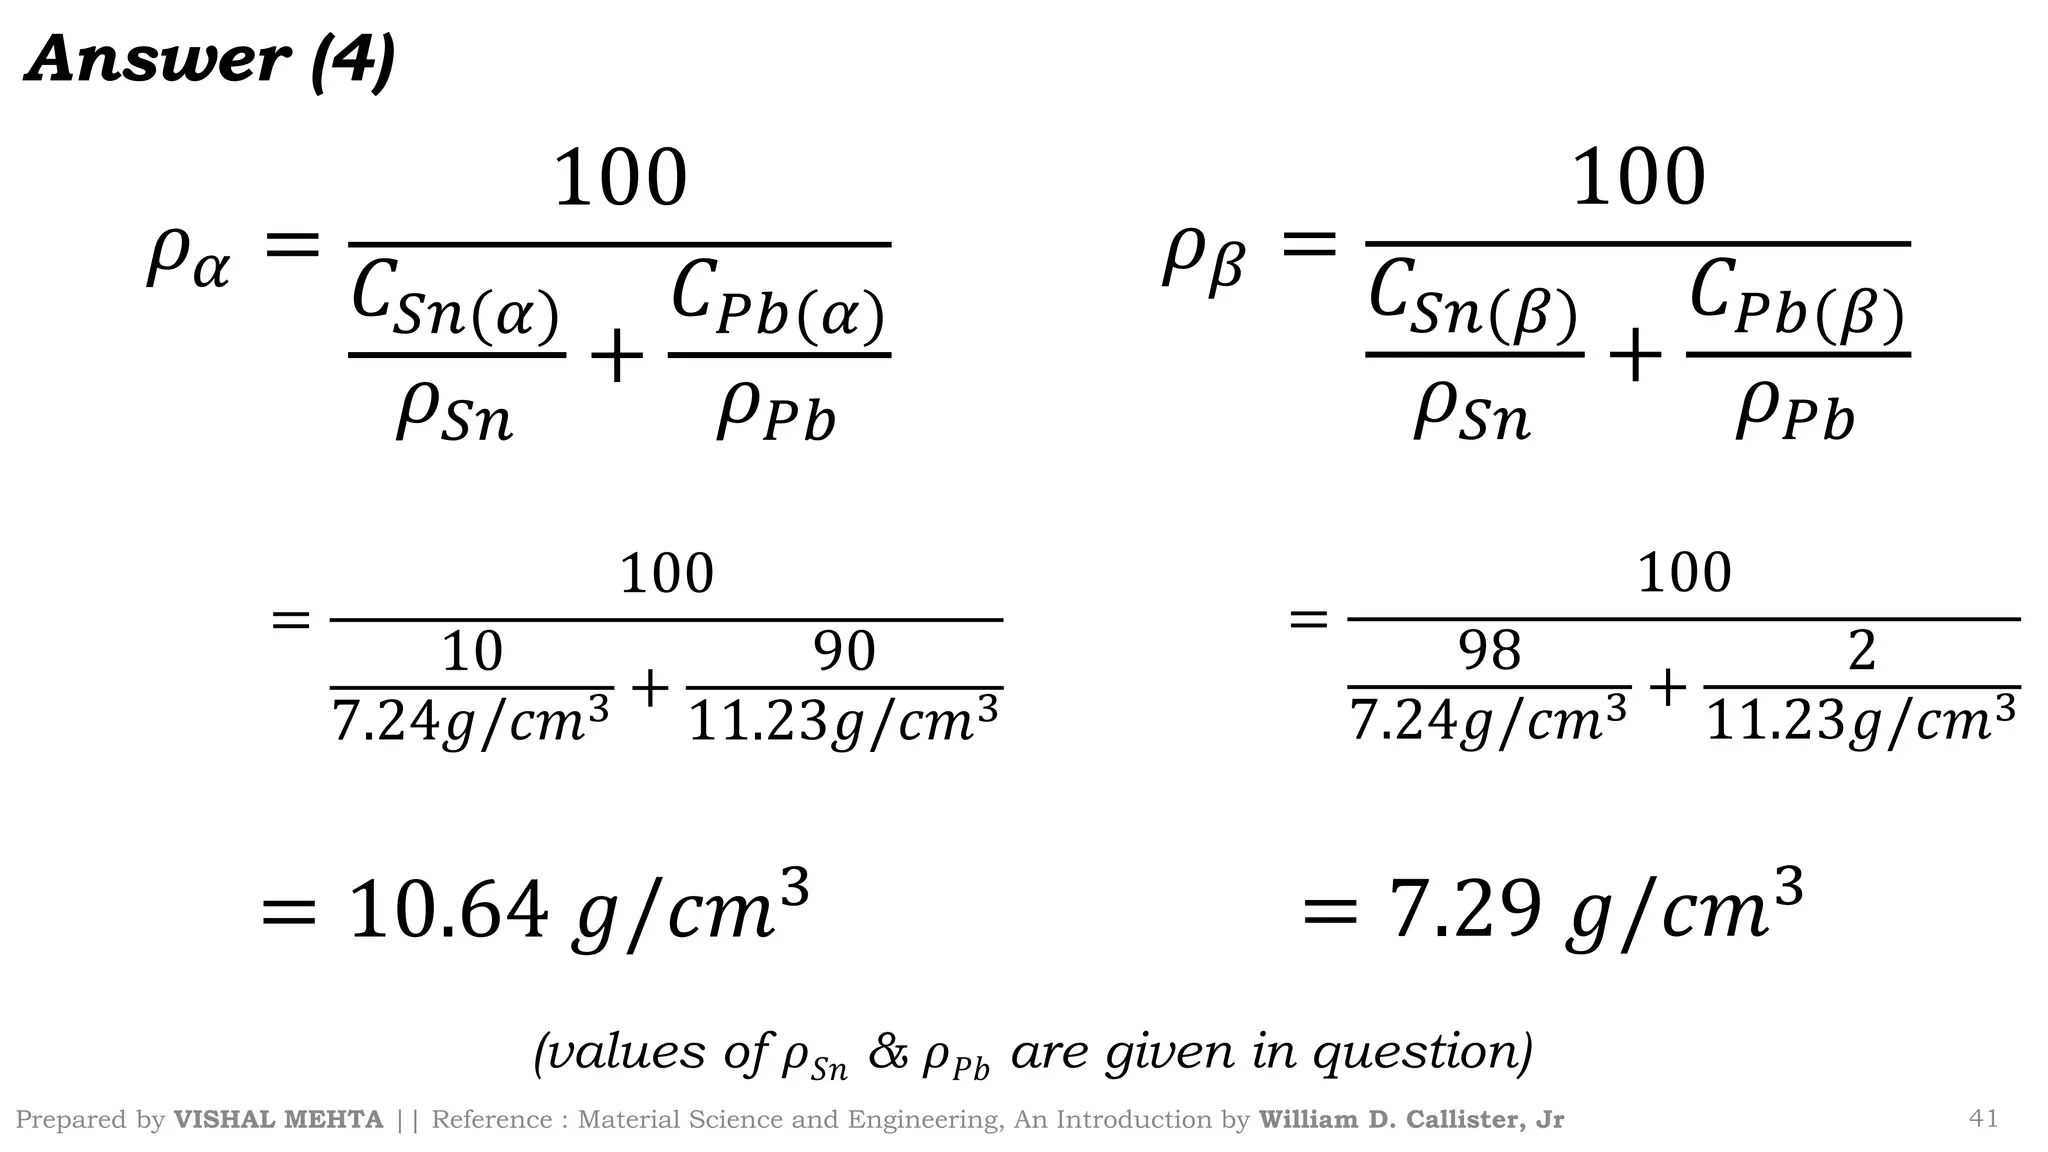
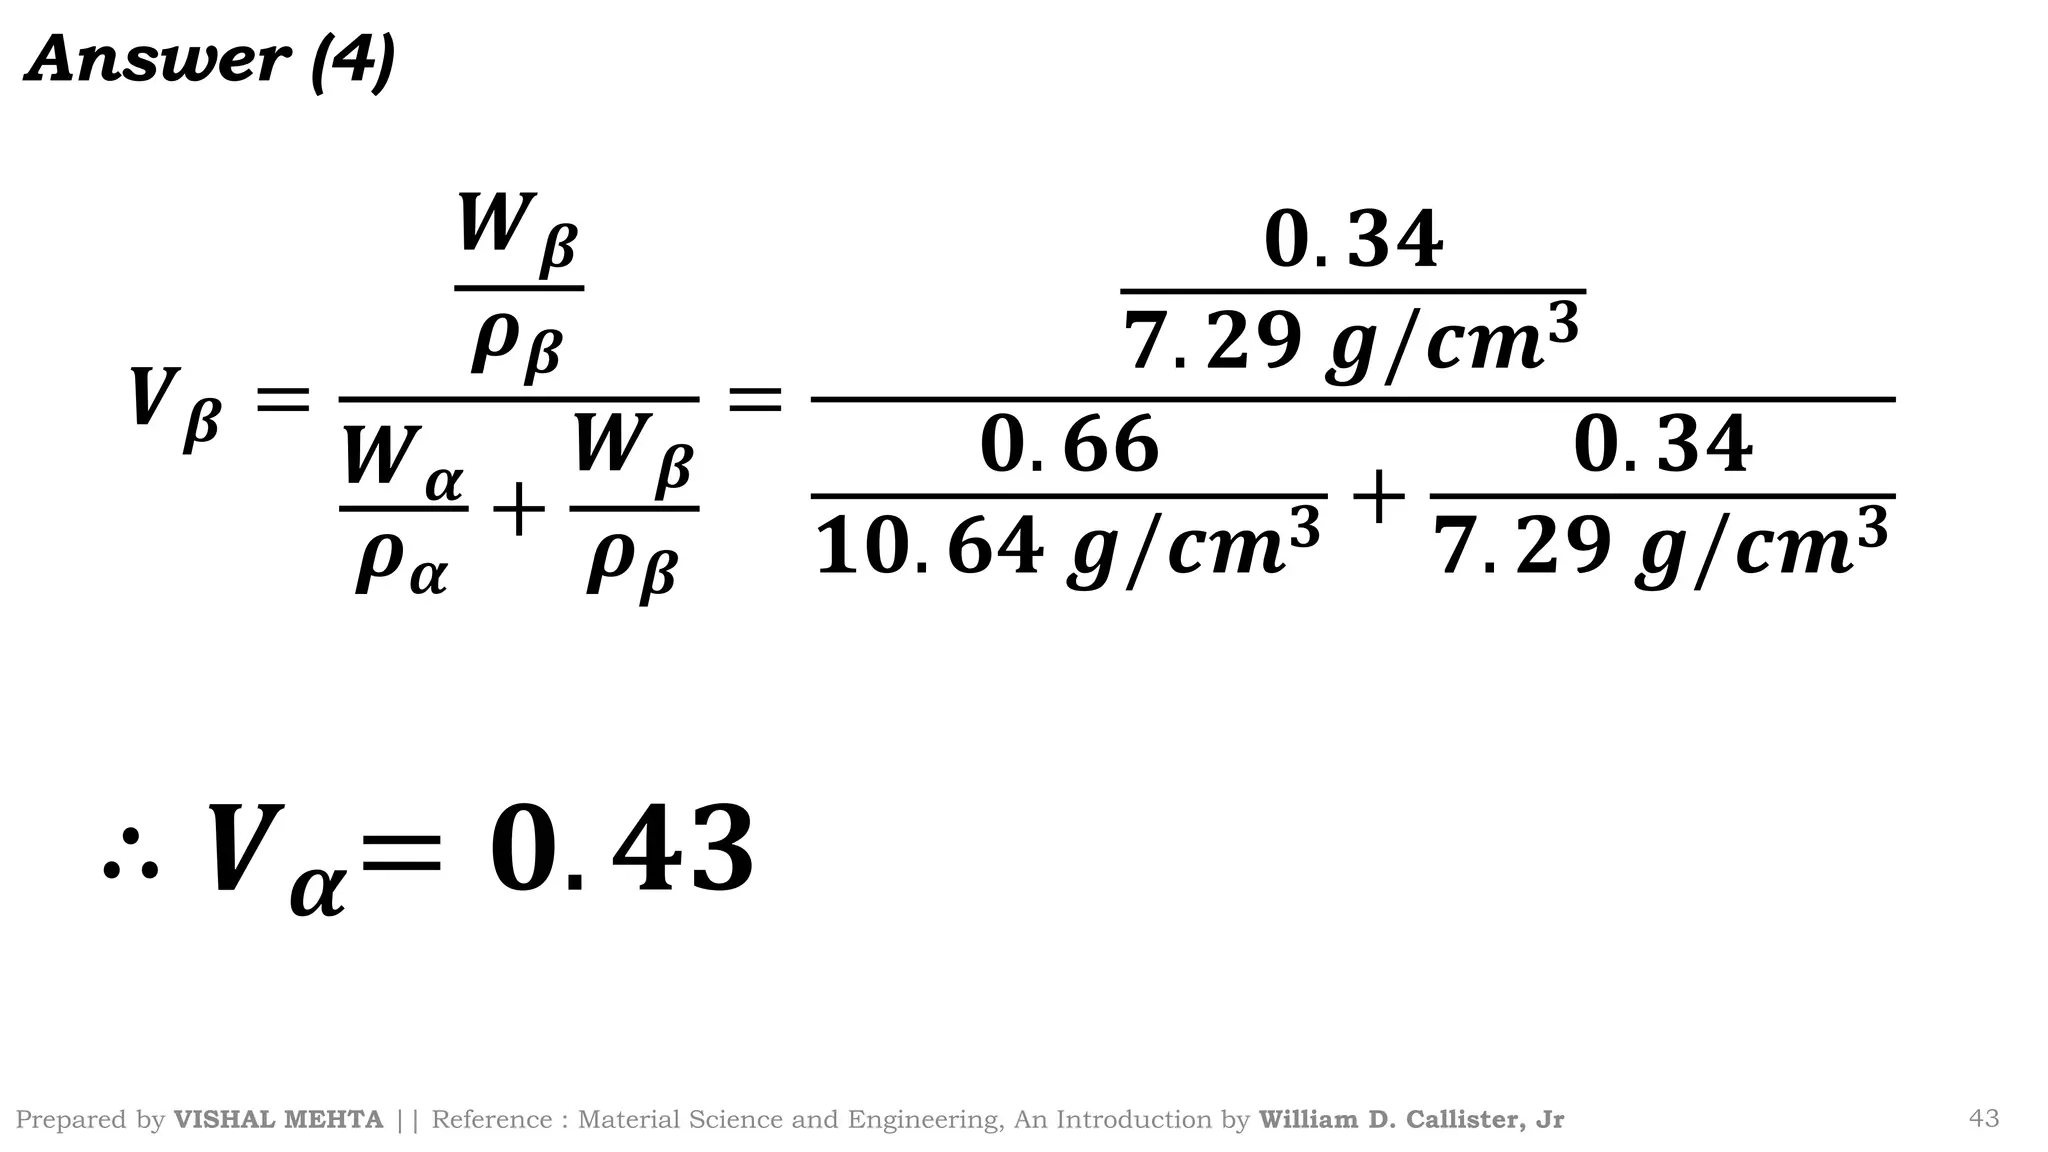
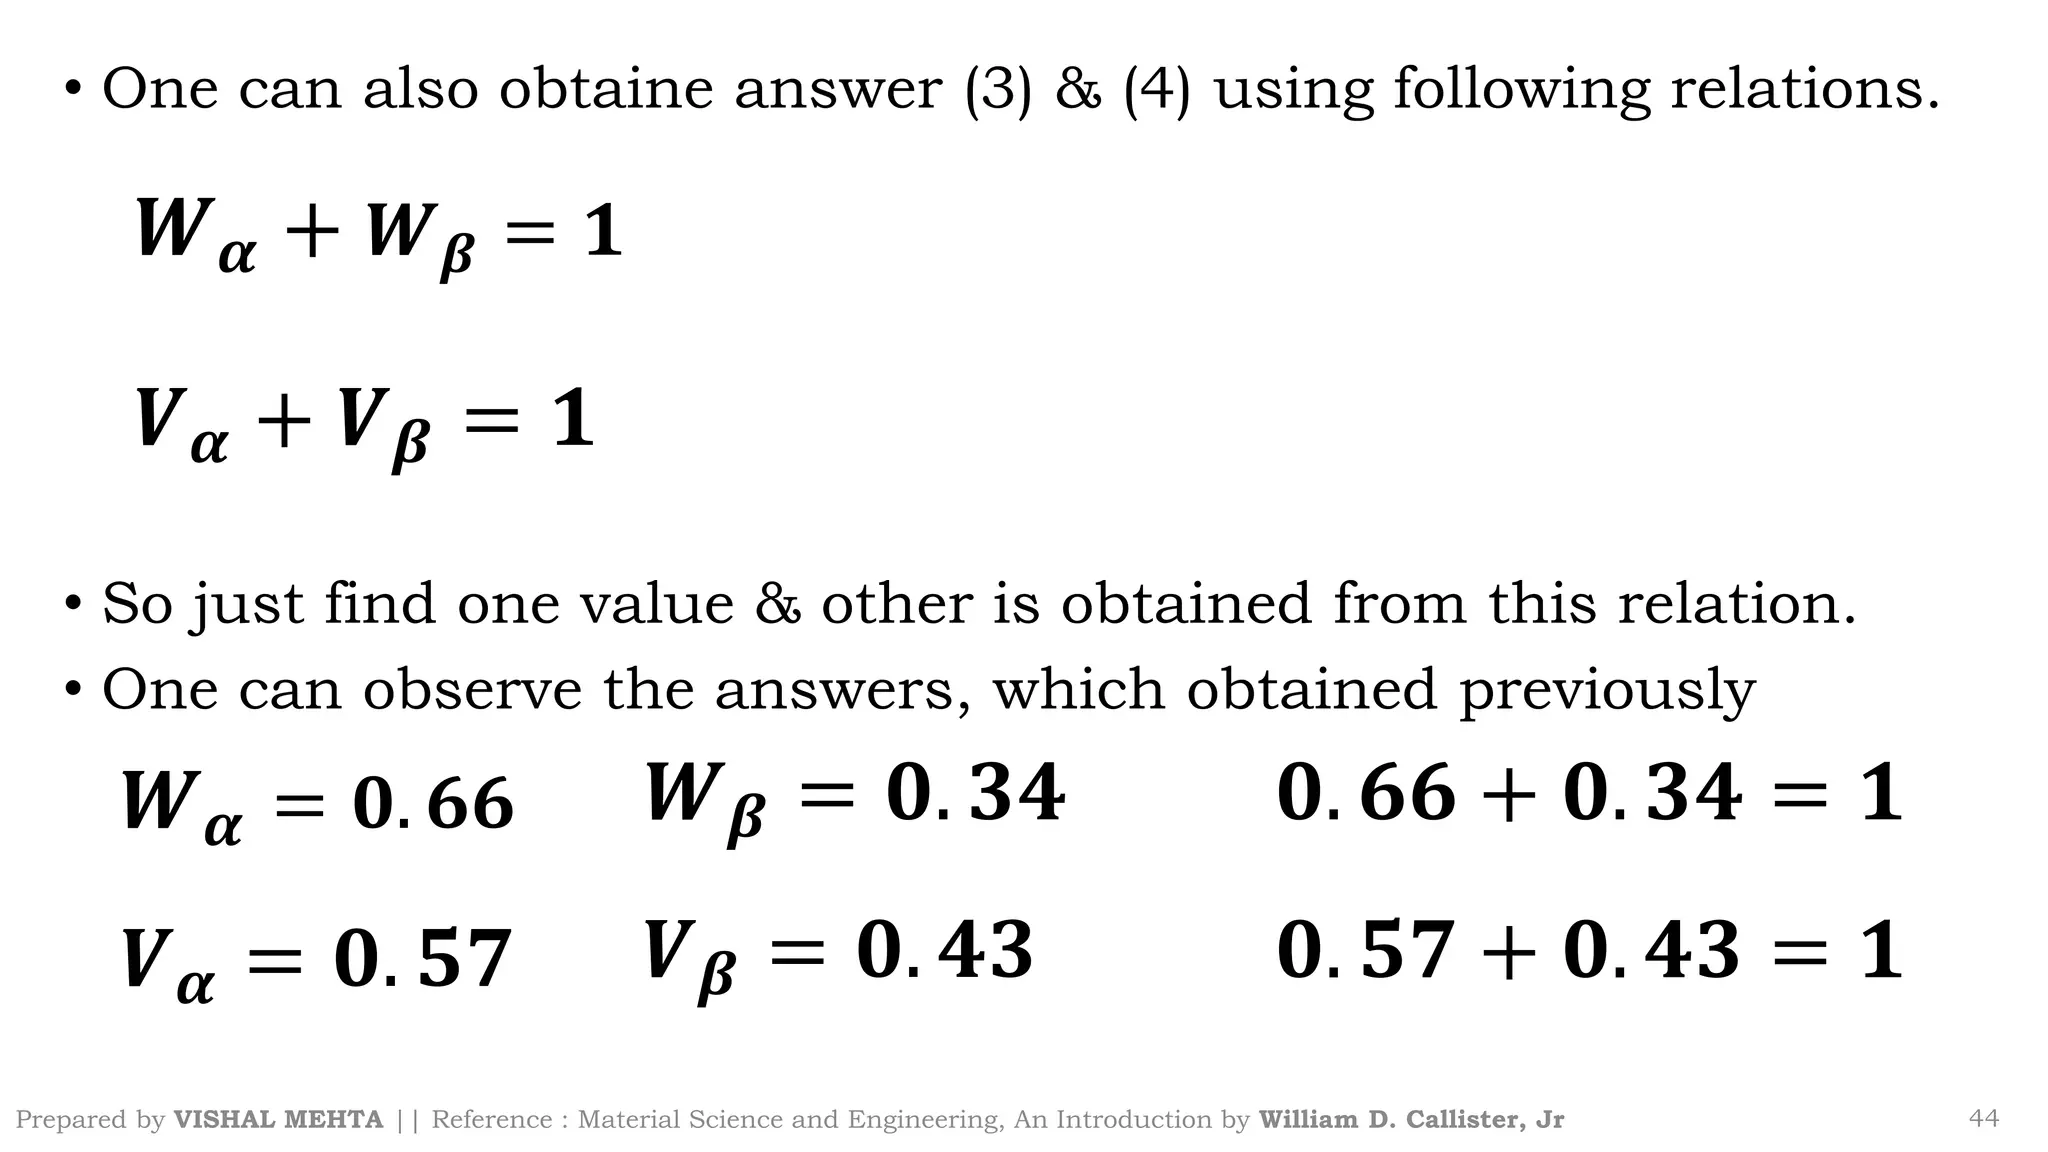
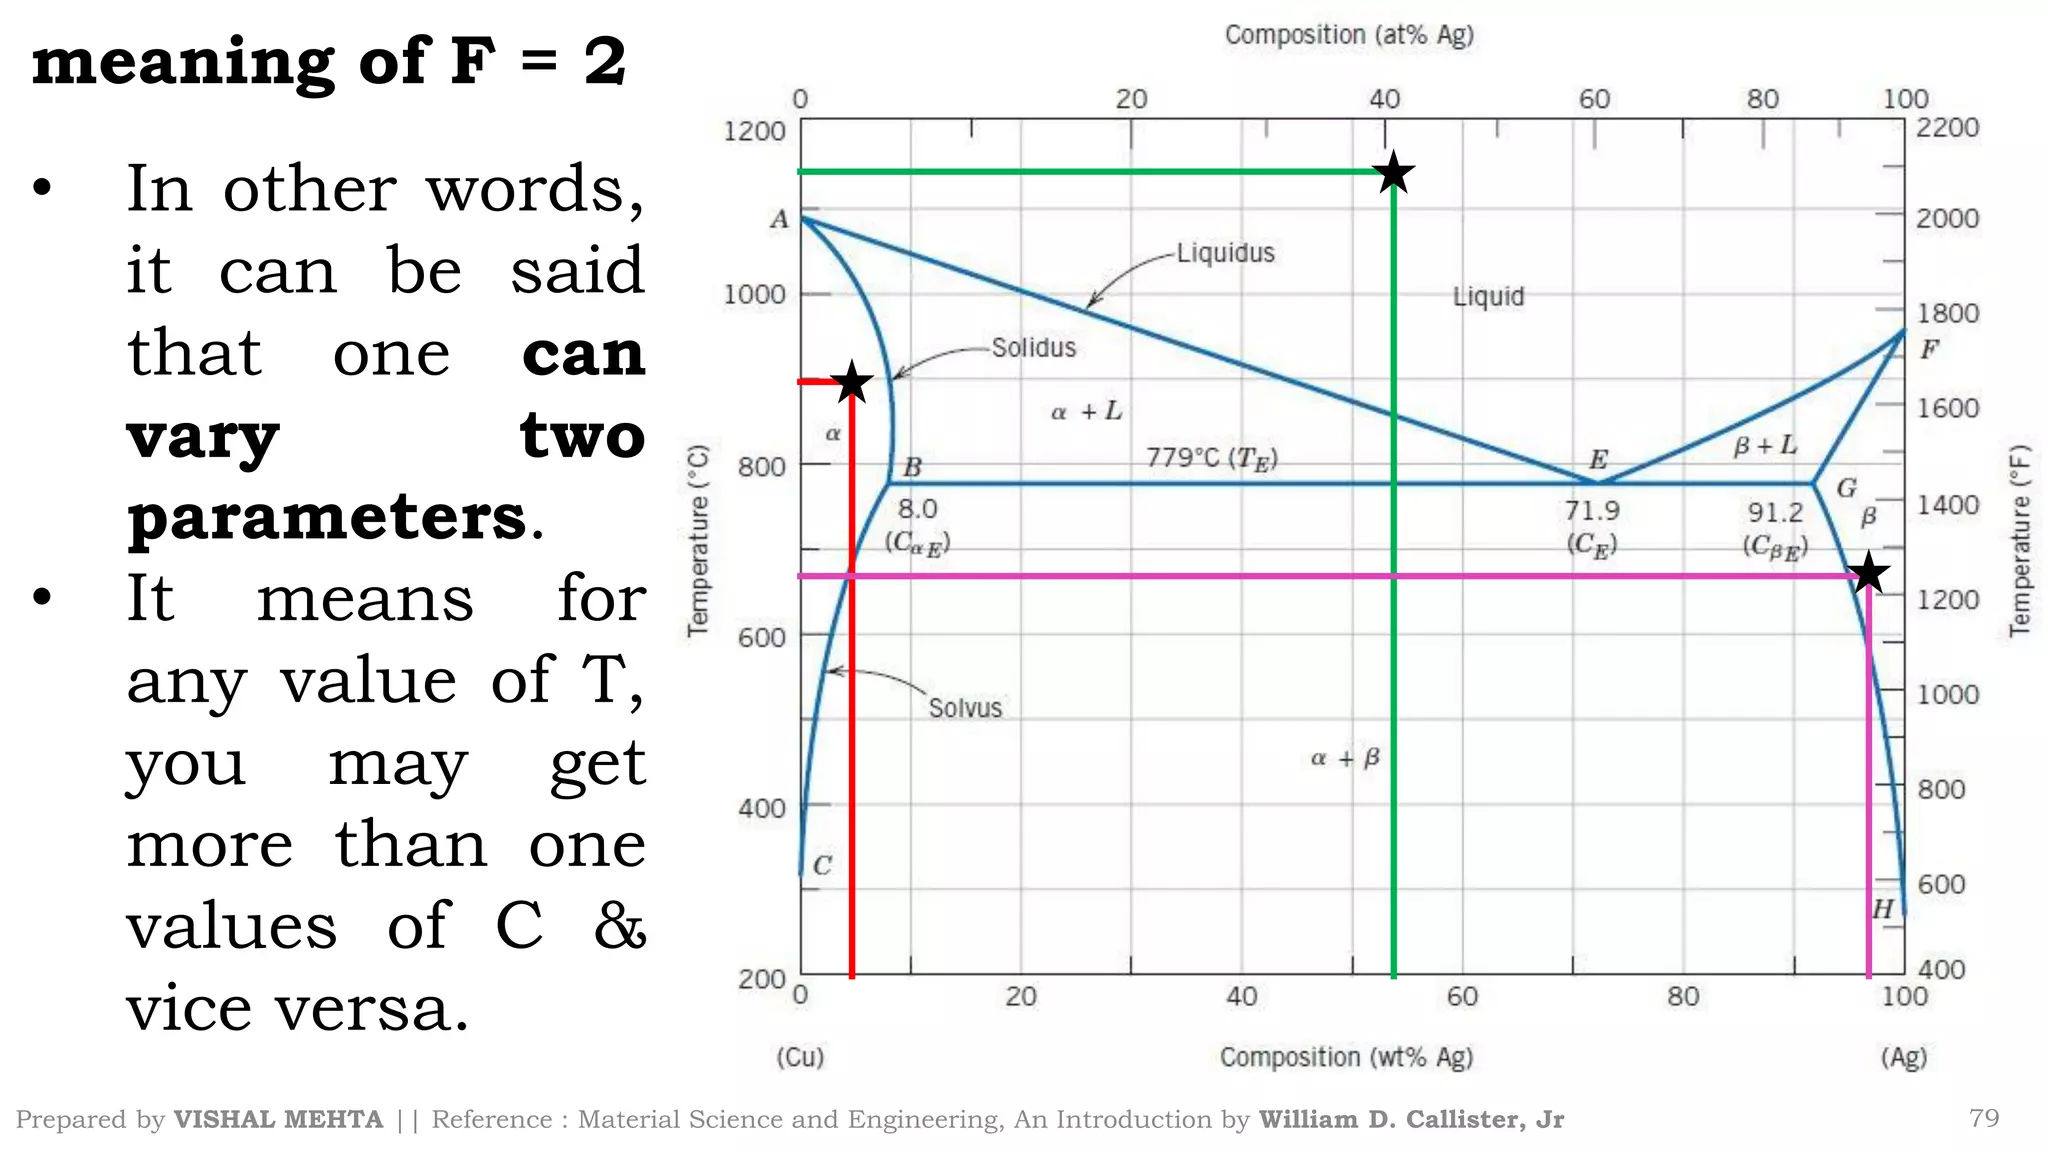
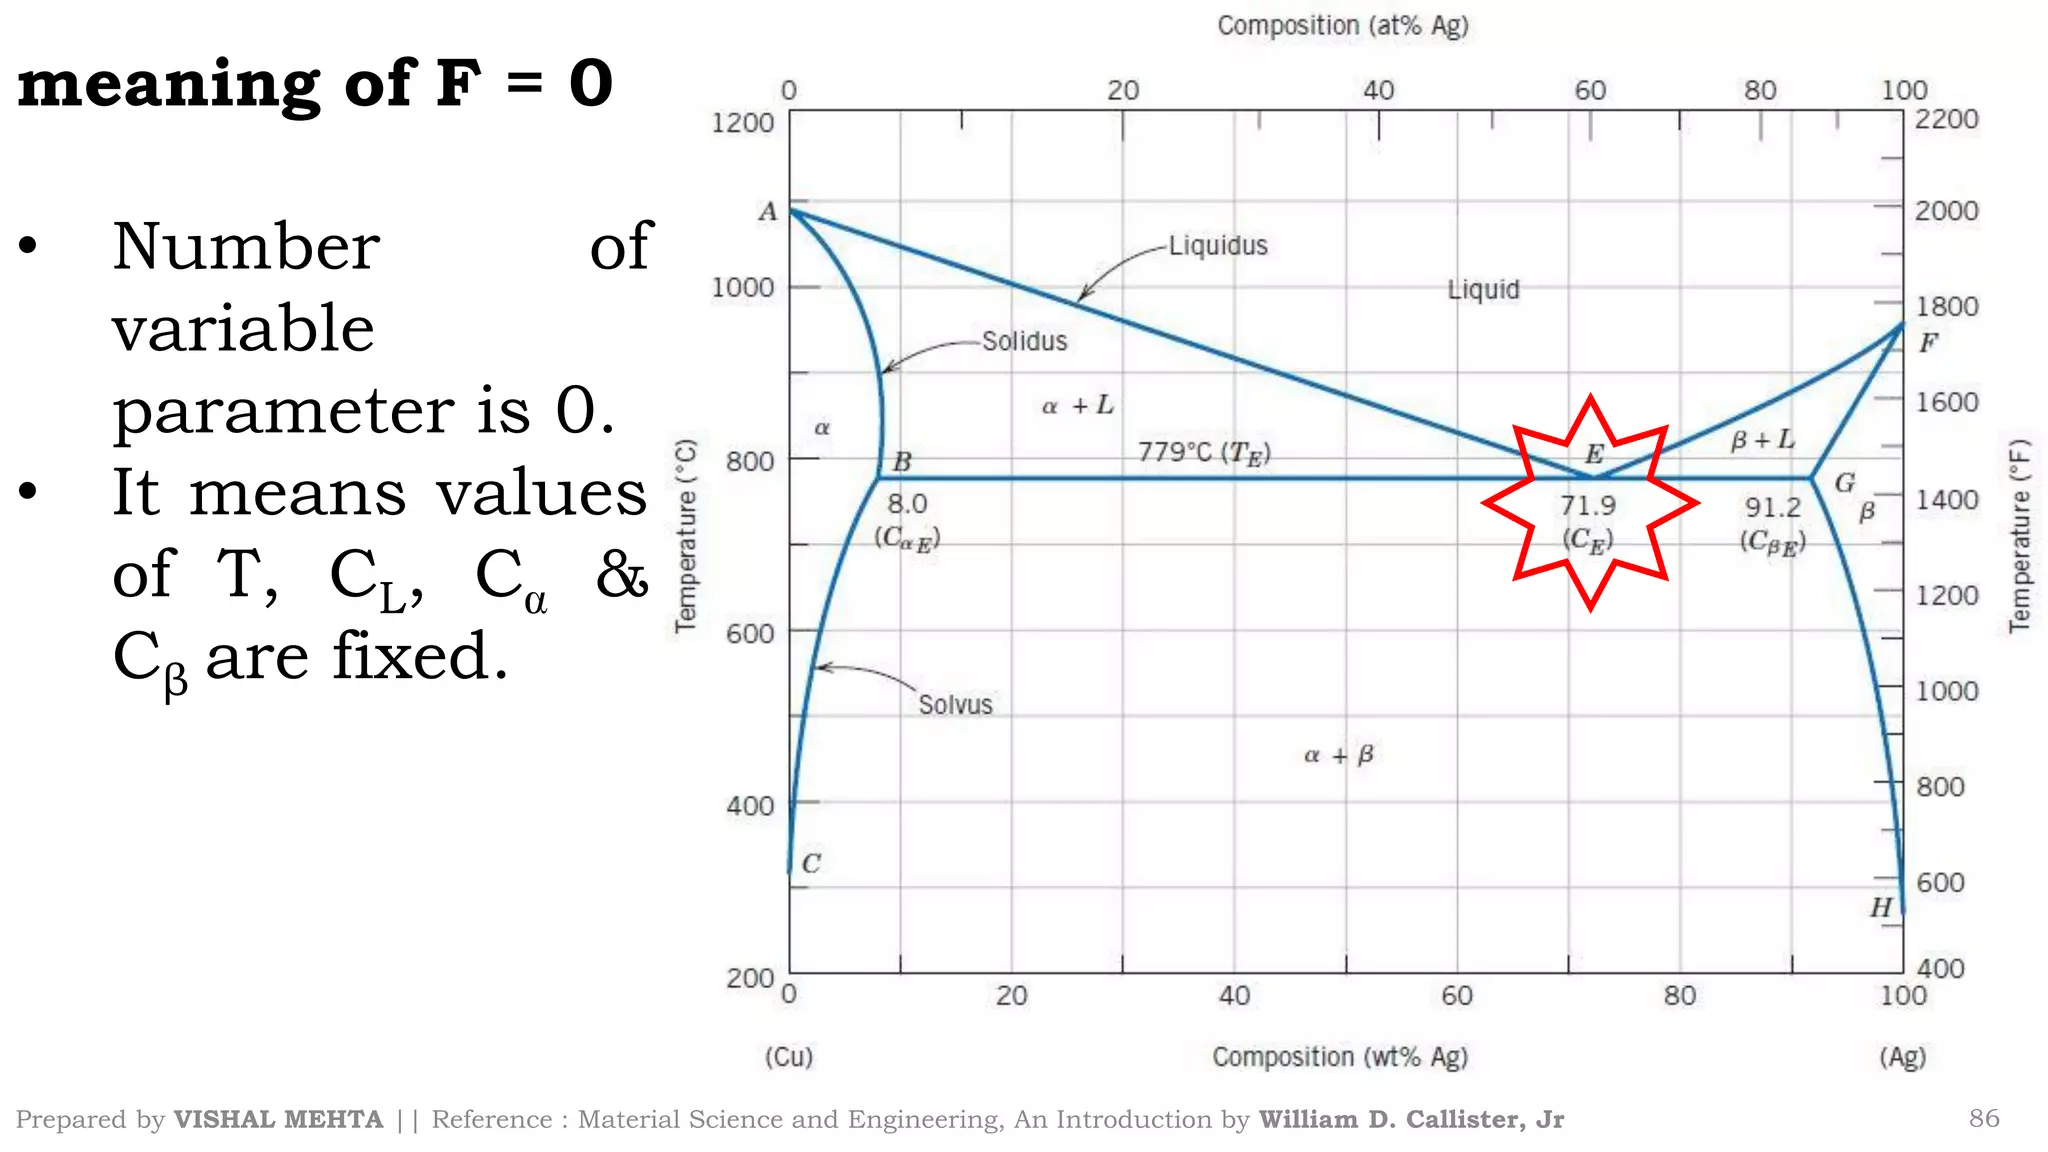
The document summarizes key concepts regarding binary eutectic systems using copper-silver as an example system. It defines terms like eutectic mixture, eutectic reaction, invariant point, liquidus line, solidus line, and solvus line. The copper-silver phase diagram is used to illustrate these concepts, including that at the eutectic point of 71.9% Cu and 779°C, the liquid transforms into solid copper and silver phases upon cooling in a eutectic reaction.
This document provides an introduction to phase diagrams, including:
- Binary phase diagrams show the equilibrium phases of alloys consisting of two components across a range of temperatures and compositions.
- Solubility limits define the maximum concentration of one component (solute) that can dissolve in another (solvent) to form a solid solution. Exceeding the limit results in a new phase.
- Phases are homogeneous, distinct regions that have uniform physical and chemical properties. Phase diagrams map the equilibrium phases that exist at different temperatures and compositions for a material system.
Phase diagrams for Different Alloy
By
P.SENTHAMARAIKANNAN,
ASSISTANT PROFESSOR ,
DEPARTMENT OF MECHANICAL ENGINEERING,
KAMARAJ COLLEGE OF ENGINEERING AND TECHNOLOGY,
VIRUDHUNAGAR, TAMILNADU,
INDIA
This document discusses different types of phase diagrams that can be used to represent alloy systems. It describes four main types:
1) Complete solid solubility - The metals are soluble in both the liquid and solid states, forming a substitutional solid solution.
2) No solid solubility - The metals are soluble only in the liquid state and insoluble in the solid state, resulting in separate metal phases.
3) Partial solid solubility - The metals are soluble in the liquid state but only partially soluble in the solid state, allowing for intermediate phases.
4) Congruent melting - One phase changes isothermally into another phase without changing composition, represented as a vertical line on the phase diagram
The document discusses phase diagrams, including:
1) Phase diagrams show the phases present in a material at different temperatures and compositions.
2) Binary eutectic systems have a specific eutectic composition that results in the lowest melting temperature. At the eutectic point, the liquid phase transforms directly into two solid phases upon cooling.
3) The copper-silver phase diagram is a binary eutectic system. It has a eutectic point at 779°C and 71.9% silver composition, where the liquid transforms into solid copper and silver phases.
The document discusses time-temperature-transformation (TTT) diagrams and the phase transformations they describe. TTT diagrams show the percentage of a phase transformation completed over temperature and time for a given alloy composition. They can indicate the microstructural phases like pearlite, bainite, and martensite that form during heating and cooling processes. The document explains how TTT diagrams are constructed from isothermal experiments and describes the various diffusion-controlled and diffusionless transformations that occur for a eutectoid steel depending on the cooling rate.
The process of transformation of a substance from liquid to solid state in which the crystal lattice forms and crystals appear.
•Volume shrinkage or volume contraction
The document discusses the iron-carbon phase diagram, which maps the different crystal structures that iron alloys adopt at various temperatures and carbon concentrations. It defines various structures including ferrite, austenite, cementite, pearlite, and martensite. The diagram shows three important reaction lines - the peritectic, eutectic, and eutectoid reactions. It explains how the microstructure of steels with different carbon levels transforms during heating and cooling, resulting in different microstructures like pearlite or ferrite/cementite mixtures. The phase diagram is important for understanding the properties of steels and their heat treatment.
Martensitic transformations are diffusionless, solid-state structural changes driven by shear displacements. They occur rapidly in many metal, ceramic, and polymer systems. Important examples include the transformation of austenite to martensite in steels during quenching, and the shape memory effect exploited in medical devices like stents. The Bain model originally proposed the mechanism as a combination of homogeneous lattice deformation and atomic shuffles, but has inconsistencies. Modern understanding involves dislocation or shear-based mechanisms constrained by the crystallography of the parent and product phases.
This document provides an overview of phase diagrams and key concepts related to phase diagrams, including:
- Common components of phase diagrams like phases, solubility limits, and microstructure.
- How to interpret phase diagrams to determine phases present, phase compositions, and relative amounts.
- Common reactions shown on phase diagrams like eutectic, eutectoid, and peritectic reactions.
- Examples of specific binary alloy phase diagrams like Cu-Ni, Pb-Sn, Al-Si, and Fe-Fe3C.
- How to use phase diagrams to understand alloy microstructure and properties.
This document discusses phase diagrams and related concepts. It covers:
- What phase diagrams are and how they are used to show phase structure under different conditions.
- The Gibbs phase rule and how it relates to phase diagrams.
- Examples of binary phase diagrams and how they show equilibrium between phases.
- Equilibrium and non-equilibrium solidification processes depicted on phase diagrams.
- Intermediate phases and reactions shown on iron-carbon alloy diagrams.
- Additional concepts like lever rule, eutectic and eutectoid systems, and development of microstructure.
1. Solid solutions occur when atoms of a solute dissolve into the crystal lattice of a solvent in the solid state. There are two main types of solid solutions: substitutional and interstitial.
2. In a substitutional solid solution, atoms of the solute substitute for atoms of the solvent in the lattice. This can be ordered, with solute and solvent atoms arranged in specific sites, or disordered.
3. In an interstitial solid solution, atoms of the solute occupy the spaces between atoms of the solvent in the lattice. This only occurs when the solute atom is much smaller than the solvent.
Phase transformations can occur in materials through changes in temperature, composition, or external pressure. These transformations involve changes in the crystal structure or phases of the material on an atomic scale.
Three key phase transformations discussed in the document are the transformation of austenite to pearlite or bainite in steels through diffusion-dependent or diffusionless processes, the transformation of austenite to martensite through rapid cooling, and shape memory effects seen in alloys like nickel-titanium.
The properties of the material, like its strength and hardness, depend on the microstructure resulting from the phase transformation, such as pearlite, bainite, or martensite, which can be controlled through heat
The document discusses dislocations in crystalline materials. It notes that dislocations play an important role in plastic deformation and other deformation processes like creep, fatigue and fracture. Dislocations are also important in crystal growth. Understanding dislocations and their behavior is crucial for understanding material properties and behavior.
This document provides information about phase diagrams:
[1] Phase diagrams graphically show the phases present in a material system at different temperatures and compositions. They can indicate properties like the number, type, and amount of phases.
[2] There are several common types of phase diagrams including complete solid solution, eutectic, and peritectic diagrams. Cooling curves are also used to experimentally determine phase boundaries.
[3] The phase rule relates the number of phases, components, and degrees of freedom in a system. Lever rule calculations use tie lines on phase diagrams to determine the composition and relative amounts of coexisting phases.
The document discusses liquid crystals and liquid crystal polymers. It notes that liquid crystals have properties between solids and liquids, with some positional and orientational order. They can exist in nematic, smectic, and cholesteric phases. Liquid crystal phases are important in biological systems like cell membranes and the brain. Liquid crystal polymers are highly resistant to heat and chemicals. They have applications in displays, body armor like Kevlar, and as heat sensors.
Mumbai University.
Mechanical Engineering
SEM III
Material Technology
MOdule 3
TTT diagram, CCT diagram Hardenability concepts and tests, Graphitization of Iron- Grey iron, white iron, Nodular and malleable irons, their microstructures, properties and applications
Development of Microstructure in eutectic Alloys and Practice problems on Binary Eutectic system
Reference: Material Science and Engineering, William Callister
The document is a lecture on materials science and crystallography given by Hari Prasad. It begins by outlining the learning objectives which include differences between crystalline and non-crystalline structures, crystal systems, atomic packing factors, and unit cells. It then defines key concepts such as space lattices, unit cells, crystal systems, coordination number, and lattice parameters. Examples are provided of different crystal structures including simple cubic, body centered cubic, face centered cubic, and hexagonal close packed. Miller indices and how to determine plane intercepts are also discussed.
Ceramics are inorganic, non-metallic materials made from a combination of metallic and non-metallic elements. They are frequently silicates, oxides, nitrides or carbides. Ceramics are typically insulative to heat and electricity, and resistant to high temperatures and harsh environments. Ceramic crystal structures are predominantly ionic in nature, with cations and anions arranged in repeating patterns depending on their size and charge. Ceramics exhibit extreme hardness, corrosion resistance, and heat resistance but are also brittle with low ductility. They are classified based on their composition into traditional ceramics, advanced ceramics, oxides, non-oxides, and composites.
This document provides an overview of phase diagrams and their components. It discusses that a phase diagram shows the phases that are present at equilibrium under different temperature and composition conditions. It outlines the key components of phase diagrams, including phase boundaries, triple points, solidus and liquidus lines. It also describes the different types of phase diagrams - unary, binary, and ternary - as well as common binary phase diagrams like eutectic, peritectic, and solid solution types. The document emphasizes that phase diagrams are important for understanding phase transformations and determining properties of materials at different temperatures and compositions.
Types of corrosion and Prevention of corrosionHemal Machhi
This document discusses different types of corrosion that commonly occur in metals, their features, and preventive measures. It outlines 9 main types of corrosion - atmospheric, erosion, selective, uniform, pitting, fretting, stress, intergranular, and corrosion fatigue. It then explains features and examples of each type. The document concludes by covering various prevention methods like material selection, design considerations, use of inhibitors, cathodic protection, galvanization, and protective coatings.
Solid solution strengthening is a method to strengthen metals by dissolving alloying elements into the base metal's crystal lattice as substituional or interstitial solid solutions. There are three main factors that influence the degree of strengthening from solid solution strengthening: 1) The size difference between solute and solvent atoms, with larger differences creating more stress fields and strengthening; 2) The concentration of solute atoms, with higher concentrations creating more obstacles to dislocation movement; 3) The nature of distortion caused by the solute, with non-spherical interstitial distortions strengthening more than spherical substituional distortions. Solid solution strengthening increases the yield strength of metals.
The iron-carbon phase diagram shows the equilibrium phases that exist at different temperatures for iron-carbon alloys. It includes three main phase transformations: the peritectic reaction where liquid transforms to austenite above 1400°C, the eutectic reaction where liquid transforms to austenite and cementite at 1130°C, and the eutectoid reaction where austenite transforms to ferrite and cementite at 723°C. The diagram is used to understand the microstructures that form during cooling of steels based on their carbon content, such as mixtures of ferrite and pearlite for eutectoid steels or ferrite/cementite for hypoeutect
Characteristics of Pearlite, Bainite and MartensiteSyed Ali Afzal
- Pearlite is a diffusion-dependent eutectoid mixture of ferrite and cementite plates that forms during slow cooling of steel with around 0.76% carbon. It has a tensile strength of around 120,000 psi.
- Bainite is a diffusional transformation of austenite to ferrite and cementite that forms as needles or plates depending on temperature. Upper bainite resembles pearlite while lower bainite forms black needle structures.
- Martensite is a non-equilibrium body-centered tetragonal structure that forms via a diffusionless transformation from austenite during rapid quenching, trapping carbon atoms interstitially. It is very hard but
The document discusses the iron-iron carbide (Fe-Fe3C) phase diagram in detail. It describes:
- The different phases in the diagram, including ferrite, austenite, cementite, and their properties.
- Polymorphic transformations between ferrite, austenite and ferrite phases with changing temperature.
- The eutectoid reaction occurring at 727°C and 0.76% C, forming pearlite which is a lamellar structure of ferrite and cementite.
- The microstructures of hypoeutectoid, eutectoid and hypereutectoid steel compositions as they cool, forming proeutect
The document contains a series of questions and answers related to materials science and engineering. Some key topics covered include polymers, metals, ceramics, crystal structures, and materials characterization techniques. The questions are paired with short, concise answers about important concepts, discoveries, properties, and terms.
1. The document is a project report on thermoelectric refrigeration written by Debasis Ray for his degree examination in physics.
2. It provides background on the historical discoveries of the Seebeck, Peltier, and Thomson effects that form the basis of thermoelectric cooling.
3. Thermoelectric coolers have no moving parts, provide precise temperature control, and can operate in any orientation, making them suitable for applications in electronics, medical, aerospace, and other industries.
This document summarizes a physics-of-failure study on aluminum electrolytic capacitors. It describes the internal structure of aluminum electrolytic capacitors, including the anode and cathode foils and electrolyte. Failure modes like short circuits and open circuits are discussed. Thermal overstress is shown to cause evaporation of the electrolyte, increasing equivalent series resistance and decreasing capacitance. An experiment shows these effects, with capacitance decreasing and ESR increasing over time when a capacitor is subjected to temperatures above its rated limit.
The document outlines a lecture on phase diagrams, including:
1) Definitions of key terms like phase, solubility limit, and phase diagrams.
2) Descriptions of different types of phase diagrams including binary isomorphous and eutectic systems.
3) Details on the important iron-carbon phase diagram, including the various phases like ferrite, cementite, and pearlite and how microstructure changes with carbon content and heat treatment.
The document discusses different types of phase diagrams and phase transformations. It describes how phases are distinct physical portions of a chemical system that can coexist in equilibrium. A phase diagram graphs the equilibrium phases present at different temperatures and compositions for an alloy system. It summarizes key features of binary phase diagrams including eutectic, peritectic, and eutectoid reactions. Microstructures like lamellar eutectics form through solidification at the eutectic composition. Examples of phase diagrams discussed include the Pb-Sn, Cu-Zn, and Fe-C systems.
The document discusses different types of phase diagrams and phase transformations. It describes how phases are distinct physical portions of a chemical system that can be mechanically separated. Phase diagrams show the temperature and composition limits of stable phases in an alloy system using data accumulated from many alloys. Common phase diagrams include binary systems that show the relationship between temperature, composition, and equilibrium phases. Phase diagrams are useful for predicting microstructures that form from phase transformations as temperature changes. Eutectic systems have a composition that solidifies at the lowest temperature into a two-phase mixture. Lamellar eutectic microstructures form in these alloys. The document discusses interpreting phase diagrams to determine phases present, phase compositions, and amounts using tie
The document describes a non-chemical cooling water treatment system called VRTX that uses controlled hydrodynamic cavitation to control bacteria like Legionella. It works by passing water through a mechanical unit that subjects it to rapid changes in pressure and vacuum, hydrodynamic cavitation, and collision forces that rupture bacterial cell walls. Laboratory and field tests showed it can effectively eradicate bacteria in cooling water systems. The system produces calcium carbonate precipitates that prevent scale buildup and keeps corrosion rates low. It provides a non-chemical alternative to traditional cooling water treatment methods.
This document summarizes research on forming and moving colloidal particle chains under AC electric fields for applications in drug delivery and microsurgery. Key findings include:
1) Flexible but not durable colloidal chains were successfully formed using a new sealing and heating method.
2) A mass production plate was developed that exponentially increased chain production.
3) Chains exhibited partially correlated internal motion under Brownian motion influences of the surrounding solution.
Future work aims to optimize chain formation, develop mathematical models of electric field hydrodynamic effects on chain behavior, and characterize propulsion of flexible durable chains under varied experimental conditions.
1) The document discusses the theoretical approaches, mechanisms, and results of studying the kinetics and corrosion properties of LaY2Ni9 metal hydride used for hydrogen storage.
2) It describes the methods used to calculate parameters like the exchange current density and equilibrium potential and models degradation rate.
3) The results show that increasing the discharge rate decreases the potential jump but increases the exchange current density, while the equilibrium potential is unaffected. The highest degradation rate was found at the mid-range discharge rate.
This document discusses nuclear battery technology. It begins with objectives like developing small, reliable power sources. It outlines the report's phases and literature review. It introduces nuclear batteries, which use radioactive isotope decay rather than a chain reaction. Conversion techniques are thermal (based on temperature differences) or non-thermal. Thermal examples include thermionic and radioisotope thermoelectric generators. Non-thermal include direct charging and betavoltaics. Advantages are long life, high energy density, and use of nuclear waste. Applications include spacecraft and pacemakers.
Literature Review Basics and Understanding Reference Management.pptxDr Ramhari Poudyal
Three-day training on academic research focuses on analytical tools at United Technical College, supported by the University Grant Commission, Nepal. 24-26 May 2024
Introduction- e - waste – definition - sources of e-waste– hazardous substances in e-waste - effects of e-waste on environment and human health- need for e-waste management– e-waste handling rules - waste minimization techniques for managing e-waste – recycling of e-waste - disposal treatment methods of e- waste – mechanism of extraction of precious metal from leaching solution-global Scenario of E-waste – E-waste in India- case studies.
Harnessing WebAssembly for Real-time Stateless Streaming PipelinesChristina Lin
Traditionally, dealing with real-time data pipelines has involved significant overhead, even for straightforward tasks like data transformation or masking. However, in this talk, we’ll venture into the dynamic realm of WebAssembly (WASM) and discover how it can revolutionize the creation of stateless streaming pipelines within a Kafka (Redpanda) broker. These pipelines are adept at managing low-latency, high-data-volume scenarios.
KuberTENes Birthday Bash Guadalajara - K8sGPT first impressionsVictor Morales
K8sGPT is a tool that analyzes and diagnoses Kubernetes clusters. This presentation was used to share the requirements and dependencies to deploy K8sGPT in a local environment.
DEEP LEARNING FOR SMART GRID INTRUSION DETECTION: A HYBRID CNN-LSTM-BASED MODELgerogepatton
As digital technology becomes more deeply embedded in power systems, protecting the communication
networks of Smart Grids (SG) has emerged as a critical concern. Distributed Network Protocol 3 (DNP3)
represents a multi-tiered application layer protocol extensively utilized in Supervisory Control and Data
Acquisition (SCADA)-based smart grids to facilitate real-time data gathering and control functionalities.
Robust Intrusion Detection Systems (IDS) are necessary for early threat detection and mitigation because
of the interconnection of these networks, which makes them vulnerable to a variety of cyberattacks. To
solve this issue, this paper develops a hybrid Deep Learning (DL) model specifically designed for intrusion
detection in smart grids. The proposed approach is a combination of the Convolutional Neural Network
(CNN) and the Long-Short-Term Memory algorithms (LSTM). We employed a recent intrusion detection
dataset (DNP3), which focuses on unauthorized commands and Denial of Service (DoS) cyberattacks, to
train and test our model. The results of our experiments show that our CNN-LSTM method is much better
at finding smart grid intrusions than other deep learning algorithms used for classification. In addition,
our proposed approach improves accuracy, precision, recall, and F1 score, achieving a high detection
accuracy rate of 99.50%.
1. PHASE DIAGRAM
(Part – 2/3)
Prepared by
VISHAL MEHTA
Reference : Material Science and Engineering,
An Introduction by William D. Callister, Jr
2. CONTENTS
Eutectic Mixture
Binary Eutectic System
Eutectoid Reaction
Peritectic Reaction
Basic Comparison
Congruent Phase Transformation
The Gibbs Phase Rule
Prepared by VISHAL MEHTA || Reference : Material Science and Engineering, An Introduction by William D. Callister, Jr 2
3. EUTECTIC MIXTURE
A eutectic mixture is defined as a mixture of two or more
components which usually do not interact to form a new chemical
compound but, which at certain ratios, inhibit the crystallization
process of one another resulting in a system having a lower melting
point than either of the components
Prepared by VISHAL MEHTA || Reference : Material Science and Engineering, An Introduction by William D. Callister, Jr 3
4. EUTECTIC MIXTURE
A eutectic mixture is defined as a mixture of two or more
components which usually do not interact to form a new chemical
compound but, which at certain ratios, inhibit the crystallization
process of one another resulting in a system having a lower melting
point than either of the components
Prepared by VISHAL MEHTA || Reference : Material Science and Engineering, An Introduction by William D. Callister, Jr 4
Component 1
Melting Temp T1
5. EUTECTIC MIXTURE
A eutectic mixture is defined as a mixture of two or more
components which usually do not interact to form a new chemical
compound but, which at certain ratios, inhibit the crystallization
process of one another resulting in a system having a lower melting
point than either of the components
Prepared by VISHAL MEHTA || Reference : Material Science and Engineering, An Introduction by William D. Callister, Jr 5
Component 1
Melting Temp T1
Component 2
Melting Temp T2
6. EUTECTIC MIXTURE
A eutectic mixture is defined as a mixture of two or more
components which usually do not interact to form a new chemical
compound but, which at certain ratios, inhibit the crystallization
process of one another resulting in a system having a lower melting
point than either of the components
Prepared by VISHAL MEHTA || Reference : Material Science and Engineering, An Introduction by William D. Callister, Jr 6
Component 1
Melting Temp T1
Component 2
Melting Temp T2
Eutectic Mixture
of component 1&2
Melting Temp T12
7. EUTECTIC MIXTURE
A eutectic mixture is defined as a mixture of two or more
components which usually do not interact to form a new chemical
compound but, which at certain ratios, inhibit the crystallization
process of one another resulting in a system having a lower melting
point than either of the components
Prepared by VISHAL MEHTA || Reference : Material Science and Engineering, An Introduction by William D. Callister, Jr 7
Component 1
Melting Temp T1
Component 2
Melting Temp T2
Eutectic Mixture
of component 1&2
Melting Temp T12
T12 < T1 & T12 < T2
8. BINARY EUTECTIC SYSTEM
•To understand binary eutectic system, example
of copper-silver system is considered.
•The phase diagram of the copper–silver system
is common and relatively simple phase
diagram found for binary alloys.
•This is known as a binary eutectic phase
diagram.
•A number of features of this phase diagram are
important and worth noting.
Prepared by VISHAL MEHTA || Reference : Material Science and Engineering, An Introduction by William D. Callister, Jr 8
9. Prepared by VISHAL MEHTA || Reference : Material Science and Engineering, An Introduction by William D. Callister, Jr 9
BINARY EUTECTIC SYSTEM
10. Prepared by VISHAL MEHTA || Reference : Material Science and Engineering, An Introduction by William D. Callister, Jr 10
BINARY EUTECTIC SYSTEM
Three
single-phase
regions
are
found.
11. Prepared by VISHAL MEHTA || Reference : Material Science and Engineering, An Introduction by William D. Callister, Jr 11
BINARY EUTECTIC SYSTEM
Three
single-phase
regions
are
found.
𝜶
12. Prepared by VISHAL MEHTA || Reference : Material Science and Engineering, An Introduction by William D. Callister, Jr 12
BINARY EUTECTIC SYSTEM
Three
single-phase
regions
are
found.
𝜶
𝜷
13. Prepared by VISHAL MEHTA || Reference : Material Science and Engineering, An Introduction by William D. Callister, Jr 13
BINARY EUTECTIC SYSTEM
Three
single-phase
regions
are
found.
𝜶
𝜷
𝑳𝒊𝒒𝒖𝒊𝒅
14. Prepared by VISHAL MEHTA || Reference : Material Science and Engineering, An Introduction by William D. Callister, Jr 14
BINARY EUTECTIC SYSTEM
The phase
is a solid
solution rich
in copper; it
has silver as
the solute
component
and an FCC
crystal
structure.
15. Prepared by VISHAL MEHTA || Reference : Material Science and Engineering, An Introduction by William D. Callister, Jr 15
BINARY EUTECTIC SYSTEM
The β phase
is a solid
solution rich
in silver; it
has copper
as the solute
component
and an FCC
crystal
structure.
16. Prepared by VISHAL MEHTA || Reference : Material Science and Engineering, An Introduction by William D. Callister, Jr 16
BINARY EUTECTIC SYSTEM
Pure copper
and
pure silver
are also
considered
to be and β
phases,
respectively.
17. Prepared by VISHAL MEHTA || Reference : Material Science and Engineering, An Introduction by William D. Callister, Jr 17
BINARY EUTECTIC SYSTEM
Three
two-phase
regions
are
found.
18. Prepared by VISHAL MEHTA || Reference : Material Science and Engineering, An Introduction by William D. Callister, Jr 18
BINARY EUTECTIC SYSTEM
Three
two-phase
regions
are
found.
𝜶 + 𝑳
19. Prepared by VISHAL MEHTA || Reference : Material Science and Engineering, An Introduction by William D. Callister, Jr 19
BINARY EUTECTIC SYSTEM
Three
two-phase
regions
are
found.
𝜶 + 𝑳
𝜷 + 𝑳
20. Prepared by VISHAL MEHTA || Reference : Material Science and Engineering, An Introduction by William D. Callister, Jr 20
BINARY EUTECTIC SYSTEM
Three
two-phase
regions
are
found.
𝜶 + 𝑳
𝜷 + 𝑳
𝜶 + 𝜷
21. Prepared by VISHAL MEHTA || Reference : Material Science and Engineering, An Introduction by William D. Callister, Jr 21
BINARY EUTECTIC SYSTEM
• The solid solubility
limit line separating
single solid phase
region & two solid
phase region is
termed as SOLVUS
LINE.
• Here CB & HG are
solvus lines.
SOLVUS LINE
22. Prepared by VISHAL MEHTA || Reference : Material Science and Engineering, An Introduction by William D. Callister, Jr 22
BINARY EUTECTIC SYSTEM
• The solubility limit
line separating single
solid phase region &
two phase solid+liquid
region is termed as
SOLIDUS LINE.
• Here BA & GF are
solidus lines.
SOLIDUS LINE
23. Prepared by VISHAL MEHTA || Reference : Material Science and Engineering, An Introduction by William D. Callister, Jr 23
BINARY EUTECTIC SYSTEM
Horizontal isotherm
line BEG may also
be considered a
solidus line; it
represents the
lowest temperature
at which a liquid
phase may exist for
any copper–silver
alloy that is at
equilibrium.
24. Prepared by VISHAL MEHTA || Reference : Material Science and Engineering, An Introduction by William D. Callister, Jr 24
BINARY EUTECTIC SYSTEM
• The solubility limit
line separating single
liquid phase region &
two phase solid+liquid
region is termed as
LIQUIDUS LINE.
• Here AE & EF are
liquidus lines.
LIQUIDUS LINE
25. Prepared by VISHAL MEHTA || Reference : Material Science and Engineering, An Introduction by William D. Callister, Jr 25
BINARY EUTECTIC SYSTEM
1085°C is Melting
temperature of Cu
As silver is added
to copper, the
temperature at
which the alloys
become totally
liquid decreases
along the liquidus
line, line AE;
thus, the melting
temperature
of copper is
lowered by silver
additions.
26. Prepared by VISHAL MEHTA || Reference : Material Science and Engineering, An Introduction by William D. Callister, Jr 26
BINARY EUTECTIC SYSTEM
961.8°C is Melting
temperature of Ag
As copper is added
to silver, the
temperature at
which the alloys
become totally
liquid decreases
along the liquidus
line, line EF; thus,
the melting
temperature
of silver is lowered
by copper additions.
27. Prepared by VISHAL MEHTA || Reference : Material Science and Engineering, An Introduction by William D. Callister, Jr 27
BINARY EUTECTIC SYSTEM
• Both liquidus lines meet
at the point E on the
phase diagram, through
which also passes the
horizontal isotherm line
BEG. Point E is called
an invariant point,
which is designated by
the composition CE &
temperature TE
E is invariant point
28. Prepared by VISHAL MEHTA || Reference : Material Science and Engineering, An Introduction by William D. Callister, Jr 28
BINARY EUTECTIC SYSTEM
• Both liquidus lines meet
at the point E on the
phase diagram, through
which also passes the
horizontal isotherm line
BEG. Point E is called
an invariant point,
which is designated by
the composition CE &
temperature TE
• For the copper–silver
system,
• CE is 71.9 wt%
• TE is 779°C
29. Prepared by VISHAL MEHTA || Reference : Material Science and Engineering, An Introduction by William D. Callister, Jr 29
BINARY EUTECTIC SYSTEM
• For an alloy of
composition CE, upon
cooling, liquid phase is
transformed into two
solid phases & β at
temperature TE
• The opposite reaction
occurs upon heating.
• This is called a eutectic
reaction (eutectic
means easily melted)
• Horizontal solidus line
at TE is called eutectic
isotherm
Eutectic isotherm
30. Prepared by VISHAL MEHTA || Reference : Material Science and Engineering, An Introduction by William D. Callister, Jr 30
BINARY EUTECTIC SYSTEM
• Eutectics Reaction
• TE is eutectic
temperature
• CE is eutectic
composition
• C E is eutectic
composition of at TE
• CβE is eutectic
composition of β at TE
Eutectic isotherm
31. Prepared by VISHAL MEHTA || Reference : Material Science and Engineering, An Introduction by William D. Callister, Jr 31
BINARY EUTECTIC SYSTEM
• Eutectics Reaction for copper-silver system
32. EXAMPLE PROBLEM
•For a 40 wt% Sn–60 wt% Pb alloy at 150oC (300F),
•(1) What phase(s) is (are) present?
•(2) What is (are) the composition(s) of the phase(s)?
•(3) Calculate the relative amount of each phase
present in terms of mass fraction and (b) volume
fraction.
•(4) Calculate the relative amount of each phase
present in terms of volume fraction.
•Take the densities of Pb and Sn to be 11.23 and
7.24 g/cm3, respectively.
Prepared by VISHAL MEHTA || Reference : Material Science and Engineering, An Introduction by William D. Callister, Jr 32
33. Prepared by VISHAL MEHTA || Reference : Material Science and Engineering, An Introduction by William D. Callister, Jr 33
Sn-Pb
system
Obtain point
B which
represent
40 wt% Sn–
60 wt% Pb
alloy at
150oC (300F)
34. Prepared by VISHAL MEHTA || Reference : Material Science and Engineering, An Introduction by William D. Callister, Jr 34
Sn-Pb
system
Answer (1)
Obtained
point is in
+β region,
both & β
phases will
Coexist.
35. Prepared by VISHAL MEHTA || Reference : Material Science and Engineering, An Introduction by William D. Callister, Jr 35
Answer (2)
Since two
phases are
present, it
becomes
necessary to
construct a
tie line
through
point B
36. Prepared by VISHAL MEHTA || Reference : Material Science and Engineering, An Introduction by William D. Callister, Jr 36
Answer (2)
𝑆𝑜,
𝐶𝛼 𝑖𝑠
10 wt% Sn–
90 wt% Pb
&
𝐶𝛽 𝑖𝑠
98 wt%Sn–
2 wt% Pb
37. Prepared by VISHAL MEHTA || Reference : Material Science and Engineering, An Introduction by William D. Callister, Jr 37
Answer (3)
Since the
alloy consists
of two
phases, it is
necessary to
employ the
lever rule.
One can
observe
C ,Cβ & C1
in diagram.
38. Prepared by VISHAL MEHTA || Reference : Material Science and Engineering, An Introduction by William D. Callister, Jr 38
Answer (3)
So mass
fraction of
phase is,
𝑊
𝛼 =
𝐶𝛽 − 𝐶1
𝐶𝛽 − 𝐶𝛼
=
98 − 40
98 − 10
= 0.66
39. Prepared by VISHAL MEHTA || Reference : Material Science and Engineering, An Introduction by William D. Callister, Jr 39
Answer (3)
So mass
fraction of
β phase is,
𝑊𝛽 =
𝐶1 − 𝐶𝛼
𝐶𝛽 − 𝐶𝛼
=
40 − 10
98 − 10
= 0.34
40. Prepared by VISHAL MEHTA || Reference : Material Science and Engineering, An Introduction by William D. Callister, Jr 40
Answer (4)
Volume fractions of phase & β phase are,
𝑽𝜶 =
𝑾𝜶
𝝆𝜶
𝑾𝜶
𝝆𝜶
+
𝑾𝜷
𝝆𝜷
𝑽𝜷 =
𝑾𝜷
𝝆𝜷
𝑾𝜶
𝝆𝜶
+
𝑾𝜷
𝝆𝜷
But we don’t have values of 𝝆𝜶 & 𝝆𝜷
41. Prepared by VISHAL MEHTA || Reference : Material Science and Engineering, An Introduction by William D. Callister, Jr 41
𝜌𝛼 =
100
𝐶𝑆𝑛(𝛼)
𝜌𝑆𝑛
+
𝐶𝑃𝑏(𝛼)
𝜌𝑃𝑏
=
100
10
7.24𝑔/𝑐𝑚3 +
90
11.23𝑔/𝑐𝑚3
= 10.64 𝑔/𝑐𝑚3
𝜌𝛽 =
100
𝐶𝑆𝑛(𝛽)
𝜌𝑆𝑛
+
𝐶𝑃𝑏(𝛽)
𝜌𝑃𝑏
=
100
98
7.24𝑔/𝑐𝑚3 +
2
11.23𝑔/𝑐𝑚3
= 7.29 𝑔/𝑐𝑚3
(values of 𝜌𝑆𝑛 & 𝜌𝑃𝑏 are given in question)
Answer (4)
42. Prepared by VISHAL MEHTA || Reference : Material Science and Engineering, An Introduction by William D. Callister, Jr 42
Answer (4)
𝑽𝜶 =
𝑾𝜶
𝝆𝜶
𝑾𝜶
𝝆𝜶
+
𝑾𝜷
𝝆𝜷
=
𝟎. 𝟔𝟔
𝟏𝟎. 𝟔𝟒 𝒈/𝒄𝒎𝟑
𝟎. 𝟔𝟔
𝟏𝟎. 𝟔𝟒 𝒈/𝒄𝒎𝟑 +
𝟎. 𝟑𝟒
𝟕. 𝟐𝟗 𝒈/𝒄𝒎𝟑
∴ 𝑽𝜶= 𝟎. 𝟓𝟕
43. Prepared by VISHAL MEHTA || Reference : Material Science and Engineering, An Introduction by William D. Callister, Jr 43
Answer (4)
𝑽𝜷 =
𝑾𝜷
𝝆𝜷
𝑾𝜶
𝝆𝜶
+
𝑾𝜷
𝝆𝜷
=
𝟎. 𝟑𝟒
𝟕. 𝟐𝟗 𝒈/𝒄𝒎𝟑
𝟎. 𝟔𝟔
𝟏𝟎. 𝟔𝟒 𝒈/𝒄𝒎𝟑 +
𝟎. 𝟑𝟒
𝟕. 𝟐𝟗 𝒈/𝒄𝒎𝟑
∴ 𝑽𝜶= 𝟎. 𝟒𝟑
44. • One can also obtaine answer (3) & (4) using following relations.
• So just find one value & other is obtained from this relation.
• One can observe the answers, which obtained previously
Prepared by VISHAL MEHTA || Reference : Material Science and Engineering, An Introduction by William D. Callister, Jr 44
𝑾𝜶 + 𝑾𝜷 = 𝟏
𝑽𝜶 + 𝑽𝜷 = 𝟏
𝑾𝜶 = 𝟎. 𝟔𝟔
𝑽𝜶 = 𝟎. 𝟓𝟕
𝑾𝜷 = 𝟎. 𝟑𝟒
𝑽𝜷 = 𝟎. 𝟒𝟑
𝟎. 𝟔𝟔 + 𝟎. 𝟑𝟒 = 𝟏
𝟎. 𝟓𝟕 + 𝟎. 𝟒𝟑 = 𝟏
45. EUTECTOID REACTION
Prepared by VISHAL MEHTA || Reference : Material Science and Engineering, An Introduction by William D. Callister, Jr 45
When there is a
transformation
form one solid
phase to two
other solid phases
or reverse is
called Eutectoid
Reaction.
Cu-Zn system
46. EUTECTOID REACTION
Prepared by VISHAL MEHTA || Reference : Material Science and Engineering, An Introduction by William D. Callister, Jr 46
In simple words,
one can under
stand that Upon
cooling, a solid
phase transforms
into two other
solid phases
( γ and є ).
And the reverse
reaction occurs
upon heating.
It is called
Eutectic Reaction
Cu-Zn system
47. EUTECTOID REACTION
Prepared by VISHAL MEHTA || Reference : Material Science and Engineering, An Introduction by William D. Callister, Jr 47
In simple words,
one can under
stand that Upon
cooling, a solid
phase transforms
into two other
solid phases
( γ and є ).
And the reverse
reaction occurs
upon heating.
It is called
Eutectic Reaction
Cu-Zn system
48. Prepared by VISHAL MEHTA || Reference : Material Science and Engineering, An Introduction by William D. Callister, Jr 48
Cu-Zn system
49. Prepared by VISHAL MEHTA || Reference : Material Science and Engineering, An Introduction by William D. Callister, Jr 49
Cu-Zn system
50. Prepared by VISHAL MEHTA || Reference : Material Science and Engineering, An Introduction by William D. Callister, Jr 50
Cu-Zn system
Eutectoid Reaction
51. PERITECTIC REACTION
Prepared by VISHAL MEHTA || Reference : Material Science and Engineering, An Introduction by William D. Callister, Jr 51
When there is a
transformation
form solid &
liquid phase to
other different
solid phase or
reverse is called
Peritectic
Reaction.
Cu-Zn system
52. Prepared by VISHAL MEHTA || Reference : Material Science and Engineering, An Introduction by William D. Callister, Jr 52
In simple words,
one can under
stand that Upon
cooling, a + L
phase transforms
into two other
solid phase є.
And the reverse
reaction occurs
upon heating.
It is called
Peritectic Reaction
Cu-Zn system
PERITECTIC REACTION
53. Prepared by VISHAL MEHTA || Reference : Material Science and Engineering, An Introduction by William D. Callister, Jr 53
Cu-Zn system
PERITECTIC REACTION
In simple words,
one can under
stand that Upon
cooling, a + L
phase transforms
into two other
solid phase є.
And the reverse
reaction occurs
upon heating.
It is called
Peritectic Reaction
54. Prepared by VISHAL MEHTA || Reference : Material Science and Engineering, An Introduction by William D. Callister, Jr 54
Cu-Zn system
55. Prepared by VISHAL MEHTA || Reference : Material Science and Engineering, An Introduction by William D. Callister, Jr 55
Cu-Zn system
56. Prepared by VISHAL MEHTA || Reference : Material Science and Engineering, An Introduction by William D. Callister, Jr 56
Cu-Zn system
Peritectic Reaction
57. Prepared by VISHAL MEHTA || Reference : Material Science and Engineering, An Introduction by William D. Callister, Jr 57
Which one is
Eutectic Reaction ?
What is
Eutectic Reaction?
58. Prepared by VISHAL MEHTA || Reference : Material Science and Engineering, An Introduction by William D. Callister, Jr 58
Which one is
Eutectic Reaction ?
What is
Eutectic Reaction?
59. Prepared by VISHAL MEHTA || Reference : Material Science and Engineering, An Introduction by William D. Callister, Jr 59
Which one is
Eutectic Reaction ?
What is
Eutectic Reaction?
Which one is
Eutectoid Reaction ?
What is
Eutectoid Reaction?
How to
identify the
Reaction ?
60. Prepared by VISHAL MEHTA || Reference : Material Science and Engineering, An Introduction by William D. Callister, Jr 60
Which one is
Eutectic Reaction ?
What is
Eutectic Reaction?
Which one is
Eutectoid Reaction ?
What is
Eutectoid Reaction?
Which one is
Peritectic Reaction ?
What is
Peritectic Reaction?
How to
identify the
Reaction ?
61. Prepared by VISHAL MEHTA || Reference : Material Science and Engineering, An Introduction by William D. Callister, Jr 61
Which one is
Eutectic Reaction ?
What is
Eutectic Reaction?
Which one is
Eutectoid Reaction ?
What is
Eutectoid Reaction?
Which one is
Peritectic Reaction ?
What is
Peritectic Reaction?
How to
identify the
Reaction ?
62. Prepared by VISHAL MEHTA || Reference : Material Science and Engineering, An Introduction by William D. Callister, Jr 62
Which one is
Eutectic Reaction ?
What is
Eutectic Reaction?
Which one is
Eutectoid Reaction ?
What is
Eutectoid Reaction?
Which one is
Peritectic Reaction ?
What is
Peritectic Reaction?
How to
identify the
Reaction ?
Confused ?
63. BASIC COMPARISION
Prepared by VISHAL MEHTA || Reference : Material Science and Engineering, An Introduction by William D. Callister, Jr 63
EUTECTIC REACTION EUTECTOID REACTION PERITECTIC REACTION
Liquid phase
Type-1
solid phase
Type-2
solid phase
Type-1 solid phase
Type-2
solid phase
Type-3
solid phase
Type-1
solid phase
Liquid
phase
Type-2 solid phase
Note : There is no specific meaning of type 1, 2 & 3. It is just randomly used to differentiate the solid phases.
64. CONGRUENT PHASE TRANSFORMATION
•Phase transformations may be classified according
to whether or not there is any change in
composition for the phases involved.
•Those for which there are no compositional
alterations are said to be congruent
transformations.
•It means phase changes without any change in
wt% composition.
Prepared by VISHAL MEHTA || Reference : Material Science and Engineering, An Introduction by William D. Callister, Jr 64
65. CONGRUENT PHASE TRANSFORMATION
Prepared by VISHAL MEHTA || Reference : Material Science and Engineering, An Introduction by William D. Callister, Jr 65
Type – 1 phase
with
composition
X wt% metal A
Y wt% metal B
66. CONGRUENT PHASE TRANSFORMATION
Prepared by VISHAL MEHTA || Reference : Material Science and Engineering, An Introduction by William D. Callister, Jr 66
Type – 1 phase
with
composition
X wt% metal A
Y wt% metal B
Congruent
Phase
Transformation
67. CONGRUENT PHASE TRANSFORMATION
Prepared by VISHAL MEHTA || Reference : Material Science and Engineering, An Introduction by William D. Callister, Jr 67
Type – 1 phase
with
composition
X wt% metal A
Y wt% metal B
Type – 2 phase
with same
composition
X wt% metal A
Y wt% metal B
Congruent
Phase
Transformation
68. CONGRUENT PHASE
TRANSFORMATION
Prepared by VISHAL MEHTA || Reference : Material Science and Engineering, An Introduction by William D. Callister, Jr 68
A portion of the nickel–titanium
phase diagram on which is
shown a congruent melting point
for the γ - phase solid solution at
1310OC and 44.9 wt% Ti.
69. CONGRUENT PHASE
TRANSFORMATION
Prepared by VISHAL MEHTA || Reference : Material Science and Engineering, An Introduction by William D. Callister, Jr 69
A portion of the nickel–titanium
phase diagram on which is
shown a congruent melting point
for the γ - phase solid solution at
1310OC and 44.9 wt% Ti.
70. CONGRUENT PHASE
TRANSFORMATION
Prepared by VISHAL MEHTA || Reference : Material Science and Engineering, An Introduction by William D. Callister, Jr 70
A portion of the nickel–titanium
phase diagram on which is
shown a congruent melting point
for the γ - phase solid solution at
1310OC and 44.9 wt% Ti.
Congruent
Phase
Transformation
L γ
71. THE GIBBS PHASE RULE
Prepared by VISHAL MEHTA || Reference : Material Science and Engineering, An Introduction by William D. Callister, Jr 71
Josiah Willard Gibbs
the nineteenth-century physicist
72. THE GIBBS PHASE RULE
Prepared by VISHAL MEHTA || Reference : Material Science and Engineering, An Introduction by William D. Callister, Jr 72
Josiah Willard Gibbs
the nineteenth-century physicist
73. THE GIBBS PHASE RULE
P + F = C + N
P = number of phases present
F = number of degrees of freedom or the
number of externally controlled
variables (e.g., temperature, pressure,
composition)
C = number of components in the system
N = number of noncompositional
variables (e.g., temperature and
pressure)
• This rule represents a criterion for the
number of phases that will coexist within a
system at equilibrium
Prepared by VISHAL MEHTA || Reference : Material Science and Engineering, An Introduction by William D. Callister, Jr 73
Josiah Willard Gibbs
the nineteenth-century physicist
74. Prepared by VISHAL MEHTA || Reference : Material Science and Engineering, An Introduction by William D. Callister, Jr 74
THE GIBBS PHASE RULE
Continue…
75. Prepared by VISHAL MEHTA || Reference : Material Science and Engineering, An Introduction by William D. Callister, Jr 75
THE GIBBS PHASE RULE
Continue…
Consider that we want
to find the number of
degrees of freedom or
the number of
externally controlled
variables for the single
phase field of Cu-Ag
system
76. Prepared by VISHAL MEHTA || Reference : Material Science and Engineering, An Introduction by William D. Callister, Jr 76
THE GIBBS PHASE RULE
Continue…
• Now Gibbs phase rule is P + F = C + N
• Here
• P = number of phases present
• As we have considered single phase field, P = 1
• F = ?
• C = number of components in system
• As it is binary system, C = 2
• N = number of noncompositional variables (e.g.,
temperature and pressure)
• Here we need to check that temperature & pressure are
variable or not.
• If both are variable, N = 2. If any one of two is variable, N = 1.
77. Prepared by VISHAL MEHTA || Reference : Material Science and Engineering, An Introduction by William D. Callister, Jr 77
THE GIBBS PHASE RULE
Continue…
• It has been discussed in initial phase of this
chapter that for binary system Temperature and
composition are variable parameters, and pressure
is held constant—normally 1 atm. (slide no 17 & 24 of Part-1)
• So here only temperature is variable, N = 1.
• Gibbs phase rule is P + F = C + N
• So 1 + F = 2 + 1
• F = 2
78. Prepared by VISHAL MEHTA || Reference : Material Science and Engineering, An Introduction by William D. Callister, Jr 78
THE GIBBS PHASE RULE
Continue…
• What is the meaning of F = 2 ?
• This means that to completely describe the
characteristics of any alloy that exists within one
of these phase fields, we must specify two
parameters; these are composition and
temperature, which locate, respectively, the
horizontal and vertical positions of the alloy on the
phase diagram.
79. Prepared by VISHAL MEHTA || Reference : Material Science and Engineering, An Introduction by William D. Callister, Jr 79
meaning of F = 2
• In other words,
it can be said
that one can
vary two
parameters.
• It means for
any value of T,
you may get
more than one
values of C &
vice versa.
80. Prepared by VISHAL MEHTA || Reference : Material Science and Engineering, An Introduction by William D. Callister, Jr 80
THE GIBBS PHASE RULE
Continue…
• Now for the same example & same system,
consider two phase field (instead of single phase).
• So, P = 2
• Gibbs phase rule is P + F = C + N
• So 2 + F = 2 + 1
• F = 1
81. Prepared by VISHAL MEHTA || Reference : Material Science and Engineering, An Introduction by William D. Callister, Jr 81
THE GIBBS PHASE RULE
Continue…
• What is the meaning of F = 1 ?
• F = 1 means it is necessary to specify either
temperature or the composition of one of the
phases to completely define the system.
82. Prepared by VISHAL MEHTA || Reference : Material Science and Engineering, An Introduction by William D. Callister, Jr 82
meaning of F = 1
• Number of variable parameter
is 1
• So, if you know any one value
of three, remaining two values
you can find.
• For example if you know T1,
you will get other two values of
C & Cβ.
• Or if you know C , you can
find other two values.
83. Prepared by VISHAL MEHTA || Reference : Material Science and Engineering, An Introduction by William D. Callister, Jr 83
meaning of F = 1
• In other words, it can be
said that one can vary
only one parameter and
other two will be changed.
• It means for any value of
T1, you will get one specific
value of C & one specific
value of Cβ.
• (point can be any where
on tie line/isotherm)
84. Prepared by VISHAL MEHTA || Reference : Material Science and Engineering, An Introduction by William D. Callister, Jr 84
THE GIBBS PHASE RULE
Continue…
• Now for the same example & same system,
consider three phase field (instead of two phase).
• So, P = 3
• Gibbs phase rule is P + F = C + N
• So 3 + F = 2 + 1
• F = 0
85. Prepared by VISHAL MEHTA || Reference : Material Science and Engineering, An Introduction by William D. Callister, Jr 85
THE GIBBS PHASE RULE
Continue…
• What is the meaning of F = 0 ?
• This means that the compositions of all three
phases as well as the temperature are fixed.
86. Prepared by VISHAL MEHTA || Reference : Material Science and Engineering, An Introduction by William D. Callister, Jr 86
meaning of F = 0
• Number of
variable
parameter is 0.
• It means values
of T, CL, C &
Cβ are fixed.
87. Prepared by VISHAL MEHTA || Reference : Material Science and Engineering, An Introduction by William D. Callister, Jr 87
END OF PART – 2 ….
PLEASE CHECK PART – 3 ….