Downloaded 454 times


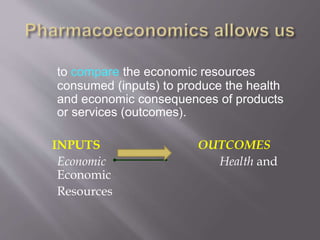
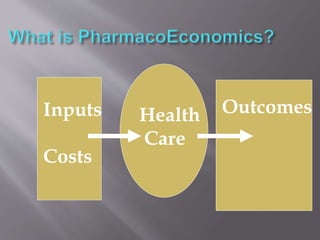


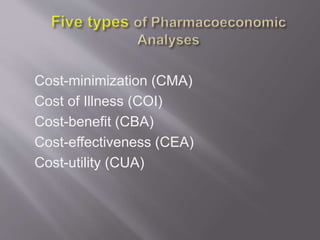
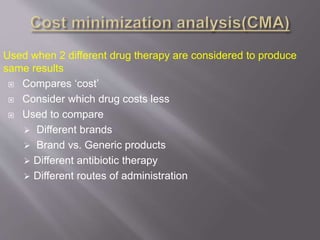
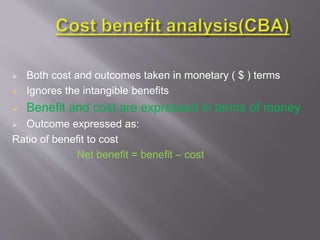
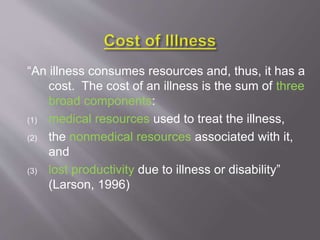
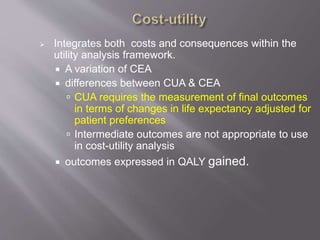
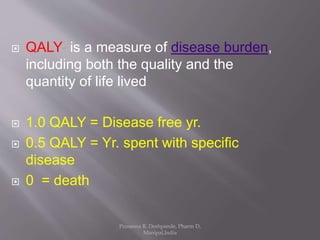
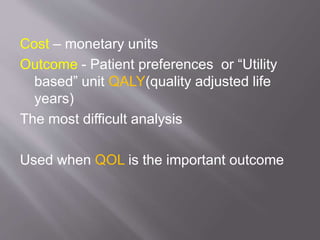
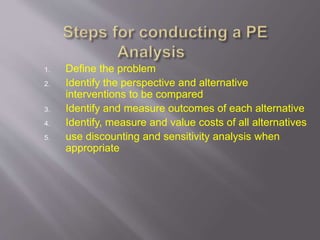


This document discusses the history, definition, methodologies and limitations of pharmacoeconomics. It begins with the origins and definition of pharmacoeconomics in the 1970s-1980s as the study of the costs and outcomes of pharmaceutical products and services. It describes different pharmacoeconomic methodologies including cost-minimization analysis, cost-benefit analysis, cost-effectiveness analysis, cost-utility analysis. It outlines the steps to evaluate an economic analysis and highlights limitations including difficulty in implementation and bias. The document provides an overview of pharmacoeconomics as a tool to inform decision-making and optimize the allocation of healthcare resources.


