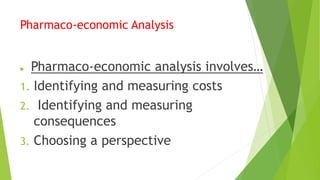
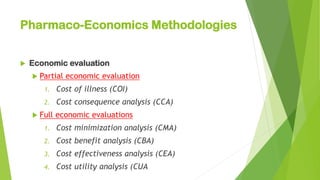
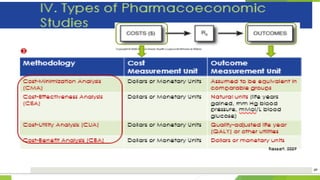
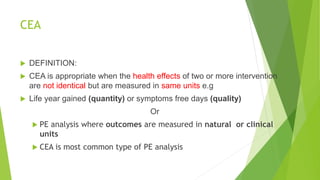
Pharmacoeconomics is a branch of health economics focused on comparing the value and costs of different pharmaceutical products and therapies to identify the most efficient use of resources. It encompasses the assessment of drug therapies based on cost-effectiveness, benefits, and outcomes, addressing concerns for healthcare funding as drug costs rise. Key methodologies in pharmacoeconomic analysis include cost-minimization, cost-effectiveness, cost-utility, and cost-benefit analyses, with evaluations often taking various perspectives such as that of patients, providers, payers, and society.


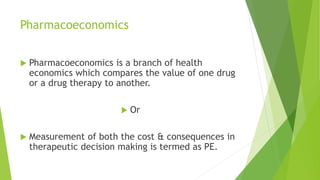


![ Definition :
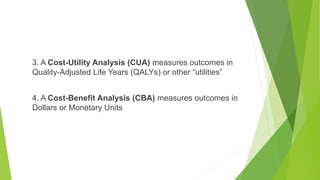
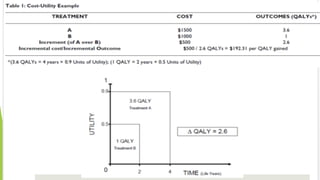
CUA is the most useful form of economic evaluation & is appropriate
when the health effects of 2 or more interventions can be measured
in terms of over all impact on quality & quantity of life.(QALY’S)
Or
A PE analysis which measures outcomes based on years of life that
are adjusted by “utility” weights (patient preferences) range [0, 1]
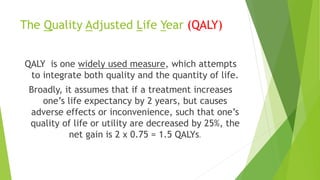
Most common utility is the Quality-Adjusted Life Year (QALY)
1.0 QALY = 1 year of life in perfect health
0.0 QALY = death
0.0 < QALY < 1.0: a year when health is diminished by disease
or treatment](https://image.slidesharecdn.com/pharmacoeconomics2-240625121415-44188b6a/85/Pharmacoeconomics-2-pdf-a-76-320.jpg)


![PERI-PROSTHETIC FRACTURE NAIL-PLATE CONSTRUCT [NPC].pptx](https://cdn.slidesharecdn.com/ss_thumbnails/drarunkumardrmohamedashrafperiprostheticfrasturenail-plateconstructnpc-260209164459-7e9d15a1-thumbnail.jpg?width=640&height=640&fit=bounds)


