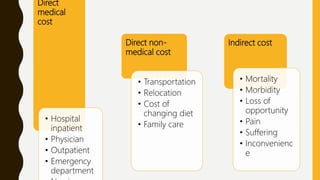
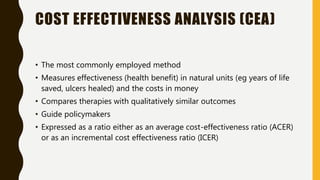
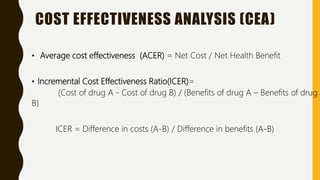
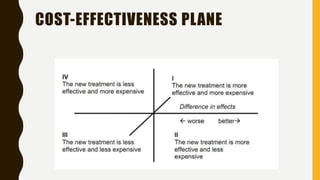
PHARMACOECONOMICS
PARAMETERS
STATISTICS
D R . P R E R N A S I N G H
J U N I O R R E S I D E N T ( 2 N D Y E A R )
D E PA R T M E N T O F P H A R M A C O LO G Y
J N M C A M U
WHAT IS PHARMACOECONOMICS?
• Pharmacoeconomics is a branch of health economics which compares
the value of one drug therapy to another
• Term first coined in 1986 by Townsend
• Economic evaluation of pharmaceuticals
• Essential to find the optimal therapy at the lowest price
WHY PHARMACOECONOMICS?
Cost of drug therapy is increasing
• New drugs
• Drug preferred over interventions
• Irrational prescribing
• Increased technology
• Increased life expectancy and standard of living
• 1979 – 85% drugs were under price control
• Now only 15 % are under price control
NEEDFUL IN:
Industry - deciding among specific research and development alternatives
Government – program benefits
Private sector – insurance benefit coverage
PHARMACOECONOMIC ANALYSIS
•Involves:
oChoosing a perspective
oIdentifying and measuring costs
oIdentifying and measuring consequences
PERSPECTIVES
 Patient perspective – Portion of cost not covered by Insurance
Out of pocket expense, indirect cost,
Consequence: clinical effect
 Provider perspective – eg. Hospitals- Direct costs
 Payer perspective – eg. Insurance companies, employers, or the
government
Direct cost
 Society perspective - All direct and indirect costs
Mortality morbidity
COST
• The value of the resources consumed by a program or drug therapy
• Not only drug cost
• Direct and indirect cost
• Direct- fixed: not influenced by treatment level - electricity, rent
variable
COST
Direct
medical
cost
• Hospital
inpatient
• Physician
• Outpatient
• Emergency
department
Direct non-
medical cost
• Transportation
• Relocation
• Cost of
changing diet
• Family care
Indirect cost
• Mortality
• Morbidity
• Loss of
opportunity
• Pain
• Suffering
• Inconvenienc
e
INDIRECT COST ESTIMATION
• Willingness to pay method(WTP)
UNRELIABLE: subjective
CONSEQUENCE
• Effects, outputs, or outcomes of the program or drug therapy
• Comparing direct, indirect, and intangible costs with the
consequences of medical treatment alternatives
Economic outcome
• Medical events occur as a result of disease or treatment (e.g.,
safety and efficacy end points)
Clinical outcome
• Consequences of disease or treatment on patient functional
status such as physical function, social function, general health
and well-being, and life satisfaction
Humanistic outcome
• Desired effect of a drug
Positive outcome
• ADR or toxicity of a drug
Negative outcome
• Proxy for final outcome
• Lipid lowering agent decreasing LDL
Intermediate outcome
• Reduced MI rate with lipid lowering agents
Final outcome
M E T H O D S O F P H A R M A C O E C O N O M I C S
COMPONENTS OF PHARMACOECONOMICS
Pharmacoeconomics
Economic
Cost of illness
Cost minimization
Cost benefit
Cost effectiveness
Cost utility
Humanistic
Quality of life
Patient preference
Patient satisfaction
COST OF ILLNESS EVALUATION
Burden of illness
• Estimates overall cost of a particular disease for a defined population
– Measuring direct and indirect costs attributable to a specific disease
– Not used to compare competing treatment alternatives but to
provide an estimation of the financial burden of a disease
– Provide baseline to compare prevention or treatment against
COST MINIMIZATION ANALYSIS (CMA)
• Most basic technique
• Determination of the least costly alternative
• Alternatives should be equivalent in safety and efficacy
• Consider physician visit, number of hospital days
• If drugs A and B are antiulcer agents equivalent in efficacy and adverse
drug reactions (ADRs), then the costs of using these drugs could be
compared using CMA
• Generic drug
COST BENEFIT ANALYSIS
• Benefits from a treatment compared with cost of providing it
• Compare different programs: neonatal care vs cardiac rehabilitation
• Expressed as benefit-to-cost ratio
• Ratio >1 treatment is of value- benefit overweigh cost
• Ratio <1 not economically beneficial
• Valuing benefits in monetary terms is difficult
COST BENEFIT ANALYSIS
SERVICE A
• Service cost: Rs 100
• Benefit to hospital: Rs 1000
SERVICE B
• Service cost: Rs1Lac
• Benefit to hospital: Rs10lac
Both have B:C ratio 10
COST EFFECTIVENESS ANALYSIS (CEA)
• The most commonly employed method
• Measures effectiveness (health benefit) in natural units (eg years of life
saved, ulcers healed) and the costs in money
• Compares therapies with qualitatively similar outcomes
• Guide policymakers
• Expressed as a ratio either as an average cost-effectiveness ratio (ACER)
or as an incremental cost effectiveness ratio (ICER)
COST EFFECTIVENESS ANALYSIS (CEA)
• Average cost effectiveness (ACER) = Net Cost / Net Health Benefit
• Incremental Cost Effectiveness Ratio(ICER)=
(Cost of drug A - Cost of drug B) / (Benefits of drug A – Benefits of drug
B)
ICER = Difference in costs (A-B) / Difference in benefits (A-B)
COST-EFFECTIVENESS PLANE
COST UTILITY ANALYSIS (CUA)
• Drugs/ interventions with different outcomes can be compared
• Most appropriate for life extending therapy or serious ADR therapy
(cancer chemotherapy)
• Modalities decreasing morbidity: arthritis
• Cost is measured in rupees and outcome in patient weighted utilities
Quality adjusted life year gained
One year of health in a disease free patient = 1 QALY
DISEASE : lower value
COST UTILITY ANALYSIS (CUA)
With treatment X
Estimated survival = 10 years
Estimate quality of life = 0.7
QALY = 10x 0.7= 7
With treatment Y
Estimated survival = 5 years
Estimate quality of life = 0.5
QALY = 5x 0.5= 2.5
QALY gained form treatment X 7-2.5 = 4.5 QALY
COST UTILITY ANALYSIS (CUA)
• Results of CUA expressed in C:U ratio
• Translated to Cost per QALY gained
• Preferred treatment is one with low ratio
APPLICATION OF PHARMACOECONOMICS
• Policy decision making
• Support clinical decision
LIMITS OF PHARMACOECONOMICS
• Young science, slowly developing
• Process open to bias, in the choice of comparator drug, the assumptions
made, or in the selective reporting of results
• Studies are conducted or funded by pharmaceutical companies who are
interested in the results
• Misused as a marketing play
THANK
YOU!

Pharmaeconomics

  • 1.
    PHARMACOECONOMICS PARAMETERS STATISTICS D R .P R E R N A S I N G H J U N I O R R E S I D E N T ( 2 N D Y E A R ) D E PA R T M E N T O F P H A R M A C O LO G Y J N M C A M U
  • 2.
    WHAT IS PHARMACOECONOMICS? •Pharmacoeconomics is a branch of health economics which compares the value of one drug therapy to another • Term first coined in 1986 by Townsend • Economic evaluation of pharmaceuticals • Essential to find the optimal therapy at the lowest price
  • 3.
    WHY PHARMACOECONOMICS? Cost ofdrug therapy is increasing • New drugs • Drug preferred over interventions • Irrational prescribing • Increased technology • Increased life expectancy and standard of living • 1979 – 85% drugs were under price control • Now only 15 % are under price control
  • 4.
    NEEDFUL IN: Industry -deciding among specific research and development alternatives Government – program benefits Private sector – insurance benefit coverage
  • 5.
    PHARMACOECONOMIC ANALYSIS •Involves: oChoosing aperspective oIdentifying and measuring costs oIdentifying and measuring consequences
  • 6.
    PERSPECTIVES  Patient perspective– Portion of cost not covered by Insurance Out of pocket expense, indirect cost, Consequence: clinical effect  Provider perspective – eg. Hospitals- Direct costs  Payer perspective – eg. Insurance companies, employers, or the government Direct cost  Society perspective - All direct and indirect costs Mortality morbidity
  • 7.
    COST • The valueof the resources consumed by a program or drug therapy • Not only drug cost • Direct and indirect cost • Direct- fixed: not influenced by treatment level - electricity, rent variable
  • 8.
    COST Direct medical cost • Hospital inpatient • Physician •Outpatient • Emergency department Direct non- medical cost • Transportation • Relocation • Cost of changing diet • Family care Indirect cost • Mortality • Morbidity • Loss of opportunity • Pain • Suffering • Inconvenienc e
  • 9.
    INDIRECT COST ESTIMATION •Willingness to pay method(WTP) UNRELIABLE: subjective
  • 10.
    CONSEQUENCE • Effects, outputs,or outcomes of the program or drug therapy
  • 11.
    • Comparing direct,indirect, and intangible costs with the consequences of medical treatment alternatives Economic outcome • Medical events occur as a result of disease or treatment (e.g., safety and efficacy end points) Clinical outcome • Consequences of disease or treatment on patient functional status such as physical function, social function, general health and well-being, and life satisfaction Humanistic outcome
  • 12.
    • Desired effectof a drug Positive outcome • ADR or toxicity of a drug Negative outcome
  • 13.
    • Proxy forfinal outcome • Lipid lowering agent decreasing LDL Intermediate outcome • Reduced MI rate with lipid lowering agents Final outcome
  • 14.
    M E TH O D S O F P H A R M A C O E C O N O M I C S
  • 15.
    COMPONENTS OF PHARMACOECONOMICS Pharmacoeconomics Economic Costof illness Cost minimization Cost benefit Cost effectiveness Cost utility Humanistic Quality of life Patient preference Patient satisfaction
  • 16.
    COST OF ILLNESSEVALUATION Burden of illness • Estimates overall cost of a particular disease for a defined population – Measuring direct and indirect costs attributable to a specific disease – Not used to compare competing treatment alternatives but to provide an estimation of the financial burden of a disease – Provide baseline to compare prevention or treatment against
  • 17.
    COST MINIMIZATION ANALYSIS(CMA) • Most basic technique • Determination of the least costly alternative • Alternatives should be equivalent in safety and efficacy • Consider physician visit, number of hospital days • If drugs A and B are antiulcer agents equivalent in efficacy and adverse drug reactions (ADRs), then the costs of using these drugs could be compared using CMA • Generic drug
  • 18.
    COST BENEFIT ANALYSIS •Benefits from a treatment compared with cost of providing it • Compare different programs: neonatal care vs cardiac rehabilitation • Expressed as benefit-to-cost ratio • Ratio >1 treatment is of value- benefit overweigh cost • Ratio <1 not economically beneficial • Valuing benefits in monetary terms is difficult
  • 19.
    COST BENEFIT ANALYSIS SERVICEA • Service cost: Rs 100 • Benefit to hospital: Rs 1000 SERVICE B • Service cost: Rs1Lac • Benefit to hospital: Rs10lac Both have B:C ratio 10
  • 20.
    COST EFFECTIVENESS ANALYSIS(CEA) • The most commonly employed method • Measures effectiveness (health benefit) in natural units (eg years of life saved, ulcers healed) and the costs in money • Compares therapies with qualitatively similar outcomes • Guide policymakers • Expressed as a ratio either as an average cost-effectiveness ratio (ACER) or as an incremental cost effectiveness ratio (ICER)
  • 21.
    COST EFFECTIVENESS ANALYSIS(CEA) • Average cost effectiveness (ACER) = Net Cost / Net Health Benefit • Incremental Cost Effectiveness Ratio(ICER)= (Cost of drug A - Cost of drug B) / (Benefits of drug A – Benefits of drug B) ICER = Difference in costs (A-B) / Difference in benefits (A-B)
  • 22.
  • 23.
    COST UTILITY ANALYSIS(CUA) • Drugs/ interventions with different outcomes can be compared • Most appropriate for life extending therapy or serious ADR therapy (cancer chemotherapy) • Modalities decreasing morbidity: arthritis • Cost is measured in rupees and outcome in patient weighted utilities Quality adjusted life year gained One year of health in a disease free patient = 1 QALY DISEASE : lower value
  • 24.
    COST UTILITY ANALYSIS(CUA) With treatment X Estimated survival = 10 years Estimate quality of life = 0.7 QALY = 10x 0.7= 7 With treatment Y Estimated survival = 5 years Estimate quality of life = 0.5 QALY = 5x 0.5= 2.5 QALY gained form treatment X 7-2.5 = 4.5 QALY
  • 25.
    COST UTILITY ANALYSIS(CUA) • Results of CUA expressed in C:U ratio • Translated to Cost per QALY gained • Preferred treatment is one with low ratio
  • 26.
    APPLICATION OF PHARMACOECONOMICS •Policy decision making • Support clinical decision
  • 27.
    LIMITS OF PHARMACOECONOMICS •Young science, slowly developing • Process open to bias, in the choice of comparator drug, the assumptions made, or in the selective reporting of results • Studies are conducted or funded by pharmaceutical companies who are interested in the results • Misused as a marketing play
  • 28.

Editor's Notes

  • #3 Identify measure and compare the cost of drug therapy to society and healthcare system
  • #8 Cost and consequence depend on it Assessed on single or multiple perspective For example, if comparing the value of alteplase (tissue plasminogen activator, or t- PA) with that of streptokinase from a patient or societal perspective, t-PA may be the best-value alternative because a 1% reduction in mortality rates is observed in this large population. Yet, from a small community hospital's perspective, streptokinase may represent a better value because it provides similar outcomes for less money. Patient: ultimate consumer so paramount Provider : indirect cost not imp. Society broadest of all
  • #9 Direct: paid for the health service (including staff costs, capital costs, and drug acquisition costs). Direct nonmedical costs. Indirect: cost experienced by patient (family, friends).
  • #10 Direct medical cost: products to treat or diagnose prevent disease Indirect: reduced productivity Mortality: year lost due to premature productivity Morbidity: lost productivity
  • #11 Patients are asked how much money they would be willing to spend to reduce the likelihood of illness.
  • #19 Measuring direct and indirect costs attributable to a specific disease such as diabetes, mental disorders, or cancer
  • #20 If drugs A and B are antiulcer agents equivalent in efficacy and adverse drug reactions (ADRs), then the costs of using these drugs could be compared using CMA
  • #23 Like compare h2 blocker and ppi for peptic ulcer
  • #29 Cost utility ratio CUA is employed less frequently than other economic evaluation methods because of a lack of agreement on measuring utilities, difficulty comparing QALYs across patients and populations, and difficulty quantifying patient preferences