Download to read offline
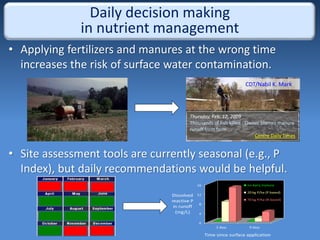
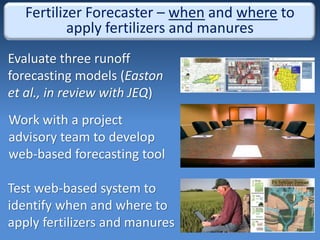
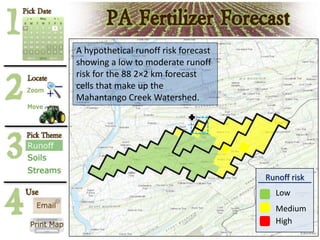
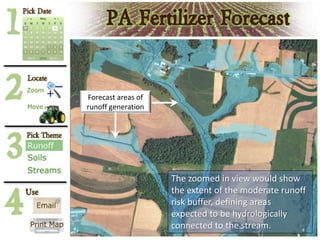
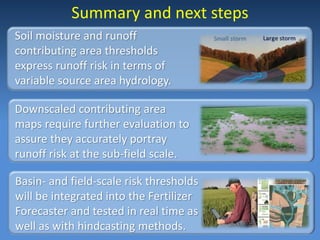

This document summarizes the development of a web-based tool called the Fertilizer Forecaster that will provide daily recommendations on when and where to apply fertilizers and manures to minimize the risk of surface water contamination from runoff. The tool uses forecasts of soil moisture and runoff risk from three hydrological models. The researchers are evaluating methods to accurately represent variable source areas of runoff at the sub-field scale to provide localized runoff risk assessments. They will integrate soil moisture, runoff risk thresholds into the Fertilizer Forecaster and test it in real-time and with past weather data.


