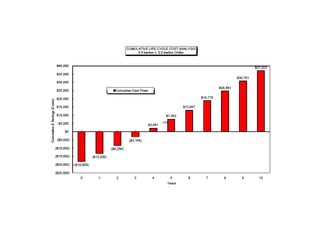
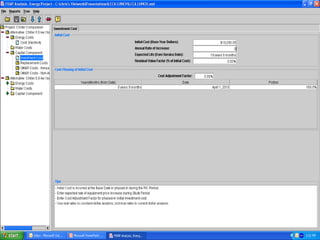
Performing a

Life Cycle Cost Analysis
What is a Life Cycle Cost Analysis?
• Compare the cost of different equipment, fuel
  types, and etc from inertia installation to end
  of service life.
• Comparison includes first installation cost, life
  time maintenance cost, life fuel cost,
  replacement cost.
Why Perform a Life Cycle Cost Analysis
• The owner asks you compare the costs of
  different HVAC systems. Packaged RTU’s vs.
  central plant fed AHU’s.
• Justify additional cost of Energy Saving
  Technology (energy recovery device, heat
  pump chiller, solar, and etc.)
• Owner is required by law to perform a LCCA
  (government projects)
Terminology
• Net Present Value (NPV) – Value of Money at Year “0”
• Adjusted Internal Rate of Return (AIRR) - % return on
  investment
• Savings to Investment Ration (SIR) – dollar for dollar
  return
• Simple Payback method (SPP) – first cost over savings
• Time Value of Money (TVOM) – Change in the value of
  money over time. The US Dollar loses value over time.
• Cash Flow Diagram
Simple Payback Method
• Easy method to determine return on
  investment for simple projects.
• SPP = Initial Cost / Annual Savings
• Example: $3000 to install an energy recovery
  wheel in a restroom exhaust system. Will save
  $800 in annual energy costs.
• SPP= $3000/$800 = 3 yrs 9 months
Detailed Analysis Consists
•   First Cost (Installation cost)
•   Maintenance Cost
•   Energy Cost
•   Inflation
•   Discount Rate (Owner’s Cost to Borrow
    Money)
Cash Flow Diagram
Which Chiller Should Be Installed?
•   100 Ton Chiller at 0.9 kw/ton or
•   100 Ton Chiller at 0.6 kw/ton at $18k premium
•   Electricity Costs: $0.08 / kwh with 3% Annual Inflation.
•   Assume Service Costs are the same with both Chillers.
•   The Customer’s Discount Rate is 5%.
•   Either chiller will run 2000 hrs per year.
•   Which chiller is most cost effective after 10 years?
•   What is the Net Present Value (NPV) of the
    investment?
Annual Energy Costs
      0.9 kw/ton Chiller               0.6 kw/ton Chiller
• Annual Energy Consumption      • Annual Energy Consumption
  is 2000 hrs x 100 tons x 0.9     is 2000 hrs x 100 tons x 0.6
  kw/ton = 180,000 kwh             kw/ton = 120,000 kwh
COST OF ENERGY CONSUMPTION
         OVER TIME
       ENERGY           ANNUAL ENERGY COST
                                                   ANNUAL ENERGY
YEAR    COST       0.9 KW/TON        0.6 KW/TON
                                                  COST DIFFERENCE
       ($ / KWH)    CHILLER           CHILLER


 1      $0.08       $14,400            $9,600          $4,800

 2      $0.08       $14,832            $9,888          $4,944

 3      $0.08       $15,277            $10,185         $5,092

 4      $0.09       $15,735            $10,490         $5,245

 5      $0.09       $16,207            $10,805         $5,402

 6      $0.09       $16,694            $11,129         $5,565

 7      $0.10       $17,194            $11,463         $5,731

 8      $0.10       $17,710            $11,807         $5,903

 9      $0.10       $18,241            $12,161         $6,080

 10     $0.10       $18,789            $12,526         $6,263
SIMPLE PAYBACK ANALYSIS
• SPP = FIRST COST / ANNUAL SAVINGS

• SPP = $18,000 / $4800/YR

• SPP = 3.8 YEARS
$6262

                                          $6080

                                  $5245
                  $4944   $5092
          $4800


$18,000
Convert Future Savings into Present
              Day Values
• Determine the Net Present Value of the
  Investment (NPV)
• Use Owner’s discount rate (cost to borrow
  money)
• NPV = Present Value (PV) savings or loss minus
  PV of First Cost Investment
ANNUAL ENERGY COST                  DISCOUNT
     YEAR                                                                 PRESENT VALUE
                          DIFFERENCE                       FACTOR


       1                        $4,800                      0.9524              $4,572
       2                        $4,944                      0.9070              $4,484
       3                        $5,092                      0.8638              $4,399
       4                        $5,245                      0.8227              $4,315
       5                        $5,402                      0.7835              $4,233
       6                        $5,565                      0.7462              $4,152
       7                        $5,731                      0.7107              $4,073
       8                        $5,903                      0.6768              $3,995
       9                        $6,080                      0.6446              $3,919
       10                       $6,263                      0.6139              $3,845

                                                                               $41,988


NPV = $41988 - $18,000 = $23,984


SIR = $41988 / $18000 = 2.33


Adjusted Internal Rate of Return (AIRR) = [(1+d)x(SIR)^(1/n)]-1 = [(1+.05)x(2.33)^(1/10)]-1 = 0.14 OR 14%
Performing A Life Cycle Cost Analysis

Performing A Life Cycle Cost Analysis

  • 1.
  • 2.
    What is aLife Cycle Cost Analysis? • Compare the cost of different equipment, fuel types, and etc from inertia installation to end of service life. • Comparison includes first installation cost, life time maintenance cost, life fuel cost, replacement cost.
  • 3.
    Why Perform aLife Cycle Cost Analysis • The owner asks you compare the costs of different HVAC systems. Packaged RTU’s vs. central plant fed AHU’s. • Justify additional cost of Energy Saving Technology (energy recovery device, heat pump chiller, solar, and etc.) • Owner is required by law to perform a LCCA (government projects)
  • 4.
    Terminology • Net PresentValue (NPV) – Value of Money at Year “0” • Adjusted Internal Rate of Return (AIRR) - % return on investment • Savings to Investment Ration (SIR) – dollar for dollar return • Simple Payback method (SPP) – first cost over savings • Time Value of Money (TVOM) – Change in the value of money over time. The US Dollar loses value over time. • Cash Flow Diagram
  • 5.
    Simple Payback Method •Easy method to determine return on investment for simple projects. • SPP = Initial Cost / Annual Savings • Example: $3000 to install an energy recovery wheel in a restroom exhaust system. Will save $800 in annual energy costs. • SPP= $3000/$800 = 3 yrs 9 months
  • 6.
    Detailed Analysis Consists • First Cost (Installation cost) • Maintenance Cost • Energy Cost • Inflation • Discount Rate (Owner’s Cost to Borrow Money)
  • 7.
  • 8.
    Which Chiller ShouldBe Installed? • 100 Ton Chiller at 0.9 kw/ton or • 100 Ton Chiller at 0.6 kw/ton at $18k premium • Electricity Costs: $0.08 / kwh with 3% Annual Inflation. • Assume Service Costs are the same with both Chillers. • The Customer’s Discount Rate is 5%. • Either chiller will run 2000 hrs per year. • Which chiller is most cost effective after 10 years? • What is the Net Present Value (NPV) of the investment?
  • 9.
    Annual Energy Costs 0.9 kw/ton Chiller 0.6 kw/ton Chiller • Annual Energy Consumption • Annual Energy Consumption is 2000 hrs x 100 tons x 0.9 is 2000 hrs x 100 tons x 0.6 kw/ton = 180,000 kwh kw/ton = 120,000 kwh
  • 10.
    COST OF ENERGYCONSUMPTION OVER TIME ENERGY ANNUAL ENERGY COST ANNUAL ENERGY YEAR COST 0.9 KW/TON 0.6 KW/TON COST DIFFERENCE ($ / KWH) CHILLER CHILLER 1 $0.08 $14,400 $9,600 $4,800 2 $0.08 $14,832 $9,888 $4,944 3 $0.08 $15,277 $10,185 $5,092 4 $0.09 $15,735 $10,490 $5,245 5 $0.09 $16,207 $10,805 $5,402 6 $0.09 $16,694 $11,129 $5,565 7 $0.10 $17,194 $11,463 $5,731 8 $0.10 $17,710 $11,807 $5,903 9 $0.10 $18,241 $12,161 $6,080 10 $0.10 $18,789 $12,526 $6,263
  • 11.
    SIMPLE PAYBACK ANALYSIS •SPP = FIRST COST / ANNUAL SAVINGS • SPP = $18,000 / $4800/YR • SPP = 3.8 YEARS
  • 12.
    $6262 $6080 $5245 $4944 $5092 $4800 $18,000
  • 13.
    Convert Future Savingsinto Present Day Values • Determine the Net Present Value of the Investment (NPV) • Use Owner’s discount rate (cost to borrow money) • NPV = Present Value (PV) savings or loss minus PV of First Cost Investment
  • 15.
    ANNUAL ENERGY COST DISCOUNT YEAR PRESENT VALUE DIFFERENCE FACTOR 1 $4,800 0.9524 $4,572 2 $4,944 0.9070 $4,484 3 $5,092 0.8638 $4,399 4 $5,245 0.8227 $4,315 5 $5,402 0.7835 $4,233 6 $5,565 0.7462 $4,152 7 $5,731 0.7107 $4,073 8 $5,903 0.6768 $3,995 9 $6,080 0.6446 $3,919 10 $6,263 0.6139 $3,845 $41,988 NPV = $41988 - $18,000 = $23,984 SIR = $41988 / $18000 = 2.33 Adjusted Internal Rate of Return (AIRR) = [(1+d)x(SIR)^(1/n)]-1 = [(1+.05)x(2.33)^(1/10)]-1 = 0.14 OR 14%