Downloaded 634 times


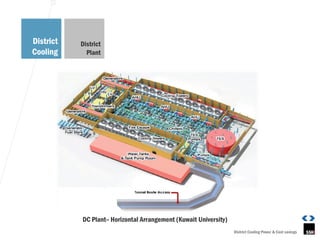


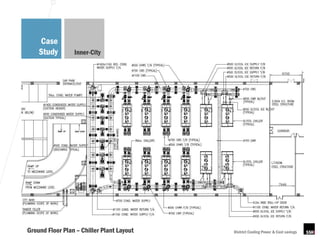


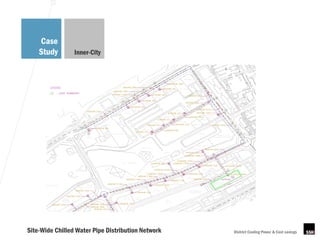


District cooling involves providing cooling to multiple buildings from a central plant via pipes. It started in the 1930s and provides energy savings compared to individual building cooling systems. A case study examines a residential area in Kuwait, finding the district cooling plant would save 50% on peak power and 40% annually on energy versus individual air-cooled systems. An inner-city case study in Kuwait also finds savings on energy and costs over a 30-year period from a district cooling system serving office, commercial and residential buildings.


