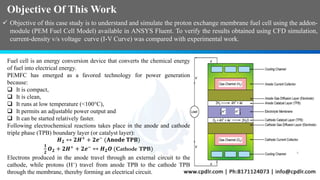
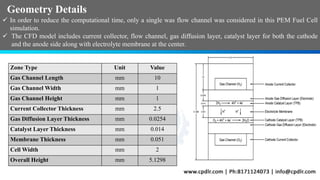
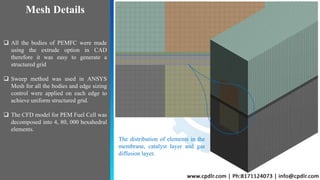
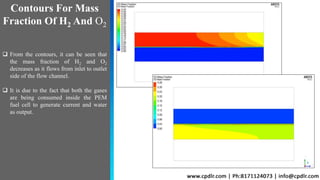
CFD SIMULATION OF PROTON EXCHANGE
MEMBRANE FUEL CELL IN ANSYS FLUENT
Objective Of This Work
Fuel cell is an energy conversion device that converts the chemical energy
of fuel into electrical energy.
PEMFC has emerged as a favored technology for power generation
because:
 It is compact,
 It is clean,
 It runs at low temperature (<100°C),
 It permits an adjustable power output and
 It can be started relatively faster.
Following electrochemical reactions takes place in the anode and cathode
triple phase (TPB) boundary layer (or catalyst layer):
𝑯 𝟐 ↔ 𝟐𝑯+ + 𝟐𝒆− (𝐀𝐧𝐨𝐝𝐞 𝐓𝐏𝐁)
𝟏
𝟐
𝑶 𝟐 + 𝟐𝑯+ + 𝟐𝒆− ↔ 𝑯 𝟐 𝑶 (Cathode TPB)
Electrons produced in the anode travel through an external circuit to the
cathode, while protons (H+) travel from anode TPB to the cathode TPB
through the membrane, thereby forming an electrical circuit.
 Objective of this case study is to understand and simulate the proton exchange membrane fuel cell using the addon-
module (PEM Fuel Cell Model) available in ANSYS Fluent. To verify the results obtained using CFD simulation,
current-density v/s voltage curve (I-V Curve) was compared with experimental work.
Geometry Details
 In order to reduce the computational time, only a single was flow channel was considered in this PEM Fuel Cell
simulation.
 The CFD model includes current collector, flow channel, gas diffusion layer, catalyst layer for both the cathode
and the anode side along with electrolyte membrane at the center.
Zone Type Unit Value
Gas Channel Length mm 10
Gas Channel Width mm 1
Gas Channel Height mm 1
Current Collector Thickness mm 2.5
Gas Diffusion Layer Thickness mm 0.0254
Catalyst Layer Thickness mm 0.014
Membrane Thickness mm 0.051
Cell Width mm 2
Overall Height mm 5.1298
Mesh Details
 All the bodies of PEMFC were made
using the extrude option in CAD
therefore it was easy to generate a
structured grid
 Sweep method was used in ANSYS
Mesh for all the bodies and edge sizing
control were applied on each edge to
achieve uniform structured grid.
 The CFD model for PEM Fuel Cell was
decomposed into 4, 80, 000 hexahedral
elements.
The distribution of elements in the
membrane, catalyst layer and gas
diffusion layer.
Name Selection For
Cell And Face Zones
anode_inlet
cathode_inlet
anode_outlet
cathode_outlet
anode_ch
cathode_ch
 All the 9 bodies were assigned a name
using name selection in ANSYS Mesh
as shown in the figure. This will help
us to identify different zones of PEM
Fuel Cell during assignment of zone
types and materials.
 The two opposite faces of flow
channels (both anode and cathode)
represents the inlets and outlets for H2
and O2 gases as shown in figure.
 The two walls of anode’s and cathode’s
current collector shown in green and
yellow color are also assigned a name
so that cell voltage can be applied
across them.
 The open circuit voltage was set to 1.07
Volts.
 The operating conditions and
temperature was set to 1 atm and
323.15K.
 The inlet velocity of anode was set to
0.3m/s with mass fraction of H2 and
H2O as 0.3 and 0.7 respectively.
 The inlet velocity of cathode was set to
0.5m/s with mass fraction of O2 and
H2O as 0.212 and 0.079 respectively.
 The outlet pressure was set to 0 Pa
gauge pressure.
 The electric potential for cathode
terminal was varied between 0.4-0.9
Volts whereas it was set to 0 Volts for
anode terminal.
Results For Given
Parameters And
Boundary Conditions
0
0.1
0.2
0.3
0.4
0.5
0.6
0.7
0.8
0.9
1
0 0.3 0.6 0.9 1.2 1.5
Voltage(Volts)
Current Density (A/cm2)
Current Density Vs Voltage Curve (I-V Curve)
Current Density (A/cm2) Cell Voltage (V)
0.004363 0.9
0.018533 0.85
0.228261 0.7
0.594253 0.6
1.106217 0.5
1.358629 0.4
 From the contours, it can be seen that
the mass fraction of H2 and O2
decreases as it flows from inlet to outlet
side of the flow channel.
 It is due to the fact that both the gases
are being consumed inside the PEM
fuel cell to generate current and water
as output.
Contours For Mass
Fraction Of H2 And O2
 The distribution of mass fraction of O2 on a plane through the cross section is shown.
 The current distribution is shown on a plane cutting the cathode current collector.
Contours For Mass Fraction Of O2 and Current Distribution

Pem fuel cell simulation using Ansys

  • 1.
    CFD SIMULATION OFPROTON EXCHANGE MEMBRANE FUEL CELL IN ANSYS FLUENT
  • 2.
    Objective Of ThisWork Fuel cell is an energy conversion device that converts the chemical energy of fuel into electrical energy. PEMFC has emerged as a favored technology for power generation because:  It is compact,  It is clean,  It runs at low temperature (<100°C),  It permits an adjustable power output and  It can be started relatively faster. Following electrochemical reactions takes place in the anode and cathode triple phase (TPB) boundary layer (or catalyst layer): 𝑯 𝟐 ↔ 𝟐𝑯+ + 𝟐𝒆− (𝐀𝐧𝐨𝐝𝐞 𝐓𝐏𝐁) 𝟏 𝟐 𝑶 𝟐 + 𝟐𝑯+ + 𝟐𝒆− ↔ 𝑯 𝟐 𝑶 (Cathode TPB) Electrons produced in the anode travel through an external circuit to the cathode, while protons (H+) travel from anode TPB to the cathode TPB through the membrane, thereby forming an electrical circuit.  Objective of this case study is to understand and simulate the proton exchange membrane fuel cell using the addon- module (PEM Fuel Cell Model) available in ANSYS Fluent. To verify the results obtained using CFD simulation, current-density v/s voltage curve (I-V Curve) was compared with experimental work.
  • 3.
    Geometry Details  Inorder to reduce the computational time, only a single was flow channel was considered in this PEM Fuel Cell simulation.  The CFD model includes current collector, flow channel, gas diffusion layer, catalyst layer for both the cathode and the anode side along with electrolyte membrane at the center. Zone Type Unit Value Gas Channel Length mm 10 Gas Channel Width mm 1 Gas Channel Height mm 1 Current Collector Thickness mm 2.5 Gas Diffusion Layer Thickness mm 0.0254 Catalyst Layer Thickness mm 0.014 Membrane Thickness mm 0.051 Cell Width mm 2 Overall Height mm 5.1298
  • 4.
    Mesh Details  Allthe bodies of PEMFC were made using the extrude option in CAD therefore it was easy to generate a structured grid  Sweep method was used in ANSYS Mesh for all the bodies and edge sizing control were applied on each edge to achieve uniform structured grid.  The CFD model for PEM Fuel Cell was decomposed into 4, 80, 000 hexahedral elements. The distribution of elements in the membrane, catalyst layer and gas diffusion layer.
  • 5.
    Name Selection For CellAnd Face Zones anode_inlet cathode_inlet anode_outlet cathode_outlet anode_ch cathode_ch  All the 9 bodies were assigned a name using name selection in ANSYS Mesh as shown in the figure. This will help us to identify different zones of PEM Fuel Cell during assignment of zone types and materials.  The two opposite faces of flow channels (both anode and cathode) represents the inlets and outlets for H2 and O2 gases as shown in figure.  The two walls of anode’s and cathode’s current collector shown in green and yellow color are also assigned a name so that cell voltage can be applied across them.
  • 6.
     The opencircuit voltage was set to 1.07 Volts.  The operating conditions and temperature was set to 1 atm and 323.15K.  The inlet velocity of anode was set to 0.3m/s with mass fraction of H2 and H2O as 0.3 and 0.7 respectively.  The inlet velocity of cathode was set to 0.5m/s with mass fraction of O2 and H2O as 0.212 and 0.079 respectively.  The outlet pressure was set to 0 Pa gauge pressure.  The electric potential for cathode terminal was varied between 0.4-0.9 Volts whereas it was set to 0 Volts for anode terminal. Results For Given Parameters And Boundary Conditions 0 0.1 0.2 0.3 0.4 0.5 0.6 0.7 0.8 0.9 1 0 0.3 0.6 0.9 1.2 1.5 Voltage(Volts) Current Density (A/cm2) Current Density Vs Voltage Curve (I-V Curve) Current Density (A/cm2) Cell Voltage (V) 0.004363 0.9 0.018533 0.85 0.228261 0.7 0.594253 0.6 1.106217 0.5 1.358629 0.4
  • 7.
     From thecontours, it can be seen that the mass fraction of H2 and O2 decreases as it flows from inlet to outlet side of the flow channel.  It is due to the fact that both the gases are being consumed inside the PEM fuel cell to generate current and water as output. Contours For Mass Fraction Of H2 And O2
  • 8.
     The distributionof mass fraction of O2 on a plane through the cross section is shown.  The current distribution is shown on a plane cutting the cathode current collector. Contours For Mass Fraction Of O2 and Current Distribution