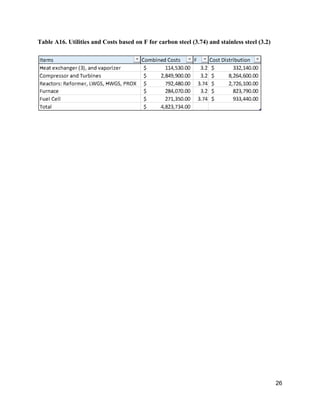
The document describes a process design for a proton exchange membrane (PEM) fuel cell power plant that produces hydrogen from heptane to deliver electricity to a 300 office building. Simulations were run using ASPEN software to model and optimize the plant design, which includes an auto-reformer, water-gas shift reactors, a preferential oxidation reactor, and heat exchangers. An economic analysis was conducted to determine the total capital costs and profitability of the plant over 25 years. The current plant design is not able to fully power the processing needs and falls short of the electrical demand, requiring further optimization to improve efficiency and meet all power requirements.
Chap 1(a) molecular-diffusion_in_gas(2)Charice Wan
The document discusses principles of molecular diffusion in gases. It covers topics such as equimolar counter diffusion, diffusion through cross-sectional areas like spheres, and calculating diffusion coefficients. Examples and problems are provided to demonstrate how to calculate flux and diffusion rates in various scenarios, including diffusion between binary gas mixtures and evaporation from surfaces. Methods for estimating gas diffusivity are also presented.
This document discusses various methods for estimating capital costs for chemical engineering projects. It describes different types of cost estimates ranging from order-of-magnitude to detailed estimates. It also covers adjusting costs based on changes in equipment capacity and time. Methods like Lang factors, module cost approach, and total plant cost estimates are outlined. Factors like materials, pressure, and temperature that influence capital costs are also addressed.
Biomass gasification for hydrogen productionMd Tanvir Alam
Biomass gasification can be used to produce hydrogen fuel through thermal conversion processes. Gasification involves heating biomass with limited oxygen to produce syngas containing hydrogen, carbon monoxide, and other gases. Several pathways exist to convert biomass to hydrogen through gasification. Research has demonstrated hydrogen yields of up to 60% by volume from biomass gasification using fluidized beds and catalysts. Economic analyses show biomass gasification can competitively produce hydrogen compared to natural gas reforming. With environmental and economic benefits, biomass gasification is a promising option for renewable hydrogen production.
This presentation explains how to improve energy efficiency of industrial furnaces. It was prepared for energy auditor training in Nepal in the context of GIZ/NEEP programme. For further information go to EEC webpage: http://www.eec-fncci.org
Gas absorption is a process used to separate gases by contacting a gas mixture with a liquid solvent. The key principles are the solubility of the absorbed gas and the rate of mass transfer as the gas dissolves into the liquid. Absorption is usually carried out counter-currently in vertical columns. The solvent is fed at the top while the gas enters at the bottom, allowing the absorbed substances to be washed out in the downward flowing liquid. Proper selection of solvent considers factors like gas solubility, volatility, cost, and viscosity. Rate of absorption is determined by volumetric mass transfer coefficients, which can be calculated from operating line and equilibrium curve diagrams.
Fireball Formation and Combustion of Coal in a BoilerZalak Shah
The document discusses coal combustion in boilers and fireball formation. It describes the combustion process and reactions, factors that influence combustion efficiency like excess air and temperature. Pulverized coal is used to increase surface area and combustion efficiency. A fireball forms when pulverized coal and air are mixed and ignited in the boiler furnace. Controls and optimization techniques help maintain combustion efficiency and reduce harmful emissions like NOx.
A case study on total Energy Conservation opportunities in a Solar power assi...Ambika Prasanna Dhal
This document summarizes a case study on energy conservation opportunities at a solar power-assisted building. It analyzes the current energy consumption at GIET campus and identifies opportunities to reduce usage. An energy audit was conducted to assess lighting, HVAC, motor, and other loads. Conservation measures like efficient lighting, fans, and motors were implemented. While energy usage increased 10% with a new building from 2012-2014, electricity costs decreased 5.61% due to conservation efforts. The study concludes energy conservation can reduce costs and environmental impacts through efficient technologies and operations.
Energy audit by Qazi Arsalan Hamid-Dy Manager Technical KESCQazi Arsalan Hamid
An energy audit involves collecting data on energy usage within a facility or system. This includes surveying equipment and operations to identify how energy is used. The audit takes a systems approach, defining the boundaries of what is audited, measuring energy inputs and outputs, and understanding how energy flows within and between subsystems. The goal is to analyze current energy consumption, identify areas for improvement, and recommend cost-effective strategies to reduce usage and lower energy bills. Implementing such strategies can provide financial and environmental benefits through direct and indirect energy savings.
The steam power plant is an important source to produce the electricity. The major portion of electricity demand is fulfilled by this power plant. It is also called a thermal power plant. It provides the electricity required to different areas. In this article we will study the construction, working, efficiency, advantages, and disadvantages of steam power plants It is the power plant which is used to generate electricity by the use of steam turbine. The major components of these power plants are boiler, steam turbine, condenser, and water feed pump.
This experiment studied the effects of cooling load and inlet water temperature on a cooling tower's performance. In experiment 1, cooling load was varied at 0.5 kW, 1 kW, and 1.5 kW while water flow rate and air flow were held constant. Higher cooling loads resulted in larger cooling ranges between inlet and outlet water temperatures. Experiment 2 varied water flow rate from 0.8 LPM to 1.6 LPM at a 1 kW cooling load. Higher water flow rates produced smaller cooling ranges and lower heat loads transferred. The results show that increasing cooling load or decreasing water flow rate improves a cooling tower's heat removal capabilities.
Gas Compression Stages – Process Design & OptimizationVijay Sarathy
The following tutorial demonstrates how to estimate the required number of compression stages and optimize the individual pressure ratio in a multistage centrifugal compression system.
1839 - Sir William Grove, first electrochemical H2/O2
reaction to generate energy
• 1950s - GE developed the solid-ion exchange H2 fuel cell
used by NASA
• 1960s- GE produced the fuel cell-based electrical power
system for NASA Gemini and Apollo space capsules
• 1960s other fuel cells discovered – phosphoric acid, SOFC,
molten carbonate
• 1970s – Vehicle manufacturers began to experiment FCEV.
• 1990 – The California Air Resource Board introduced the
Zero Emission Vehicle (ZEV) Mandate.
• 2000 – Fuel cell buses were deployed as part of the
HyFleet/CUTE project
• 2007 – fuel cell started to be sold commercially as APU
• 2008 – Honda begins leasing the FCX fuel cell electric
vehicle.
• 2009 – Large scale of residential CHP programme in Japan.
Biomass is an alternative power source that can be generated from organic waste materials like food scraps, garden waste, wood, and manure. The document discusses how biomass power works, providing examples of its use in landfills in Auckland and Wellington, New Zealand to generate electricity. It suggests schools could also use biomass power by collecting organic waste to fuel an on-site biogas plant and burn wood pellets to heat boilers, providing a cheap, sustainable energy option.
The document discusses the Hardgrove Grindability Index (HGI) test method for determining the grindability of coal. It describes how the HGI test works, factors that influence grindability values, and the effects of coal blending on HGI values. Experimentally determined HGI values for coal blends sometimes differed from calculated weighted average values, with the difference generally within ±2 HGI units. The optimal coal blends for different applications can be identified based on considering both HGI values and other coal properties.
This presentation introduces the principle of an air source heat pump, the key parts of the heat pump system and shows some examples of how heat pumps saves your money and protects the environment.
Selection and Design of Condensers
0 INTRODUCTION/PURPOSE
1 SCOPE
2 FIELD OF APPLICATION
3 DEFINITIONS
4 CHOICE OF COOLANT
5 LAYOUT CONSIDERATIONS
5.1 Distillation Column Condensers
5.2 Other Process Condensers
6 CONTROL
6.1 Distillation Columns
6.2 Water Cooled Condensers
6.3 Refrigerant Condensers
7 GENERAL DESIGN CONSIDERATIONS
7.1 Heat Transfer Resistances
7.2 Pressure Drop
7.3 Handling of Inerts
7.4 Vapor Inlet Design
7.5 Drainage of Condensate
8 SUMMARY OF TYPES AVAILABLE
8.1 Direct Contact Condensers
8.2 Shell and Tube Exchangers
8.3 Air Cooled Heat Exchangers
8.4 Spiral Plate Heat Exchangers
8.5 Internal Condensers
8.6 Plate Heat Exchangers
8.7 Plate-Fin Heat Exchangers
8.8 Other Compact Designs
9 BIBLIOGRAPHY
FIGURES
1 DIRECT CONTACT CONDENSER WITH INDIRECT COOLER FOR RECYCLED CONDENSATE
2 SPRAY CONDENSER
3 TRAY TYPE CONDENSER
4 THREE PASS TUBE SIDE CONDENSER WITH INTERPASS LUTING FOR CONDENSATE DRAINAGE
5 CROSS FLOW CONDENSER WITH SINGLE PASS COOLANT
The presentation discusses the various factors which affect the performance of Power Boilers including the quality of coal, airheater performance, air ingress etc.
India relies heavily on coal for energy but has limited oil and gas reserves. It aims to increase access to electricity and transition to more renewable resources like solar and wind over the long term. Currently, coal contributes over half of India's primary energy while oil and natural gas make up most of the remainder. The document outlines India's current energy sources and consumption patterns as well as strategies to improve efficiency, expand electricity access, develop renewable energy, and transition its energy mix to be more sustainable.
The document outlines the startup sequence for a CFBC burner. It involves 14 steps: 1) satisfying pre-interlocks, 2) satisfying main interlocks, 3) satisfying purge interlocks, 4) starting purge for 5 minutes, 5) purge completing, 6) resetting MFTs, 7) satisfying gas firing permissives, 8) burners becoming ready for start, 9) starting burner A through 10 automatic commands, and 10) burner A gas firing starting. It provides details on the conditions that must be met at each step.
Carbon residue is a test performed on lubricating oils and fuels to determine their potential to form carbon deposits. The test involves heating an oil sample in a small tube and measuring the carbon residue left behind. A higher carbon residue number indicates the oil or fuel is more likely to leave deposits that can clog engines or damage components over time.
1) The document describes a lab experiment to determine the calorific value of LP gas using Boy's gas calorimeter. The calorific value represents the amount of energy released during combustion.
2) The procedure involves collecting water circulated through the calorimeter after burning gas for 5 minutes. Temperature measurements are used to calculate the heat absorbed and determine the higher calorific value.
3) Calorific values are important in engineering applications to compare fuels, enhance efficiency, and reduce costs. They allow selection of the most suitable fuel and optimization of power plant, vehicle, and machine designs.
The document discusses cooling towers, including:
1. Types of cooling towers like natural draft, mechanical draft, forced draft, induced draft, cross flow and counter flow towers.
2. Parameters for assessing cooling tower performance including range, approach, effectiveness and cooling capacity.
3. Energy efficiency opportunities like selecting an appropriately sized tower, using efficient fill media to reduce pumping needs, and optimizing fans and motors.
Presentation on Alternative Refrigerants related to mechanical engineering for application in mechanical systems (air conditoning and refrigerators etc) and chemical engineering
The document discusses different types of heat exchangers: direct contact, direct transfer (recuperative), and storage (regenerative). Direct transfer type heat exchangers like shell and tube, plate and frame transfer heat continuously through a dividing wall without mixing fluids. Storage type heat exchangers temporarily store heat and transfer it between fluids. Common applications of shell and tube heat exchangers include food/beverage, marine, air processing, and chemicals. Plate heat exchangers are used for milk pasteurization and brine cooling. Storage heat exchangers are used in steel melting and blast furnaces.
This document discusses vapor compression refrigeration systems from Sana'a University in Yemen. It covers topics like coefficient of performance, the basic refrigeration cycle with four main components (evaporator, compressor, condenser, expansion valve), processes within the cycle, effects of evaporator and condenser temperatures, examples of cycle analysis, use of flash tanks and accumulators, and multistage compression systems. The document is presented by Dr. Abduljalil Al-Abidi from the Mechanical Engineering department and focuses on vapor compression refrigeration taught to students.
(HTS) High Temperature Shift Catalyst (VSG-F101) - Comprehensiev OverviewGerard B. Hawkins
The document discusses improvements in high temperature shift catalysts. It describes the characteristics and operational issues of traditional HTS catalysts and how the new VULCAN Series VSG-F101 catalyst has addressed these issues through modifications to its microstructure and composition. The VSG-F101 has shown improved activity, strength, and resistance to thermal and mechanical stresses during plant upsets compared to previous catalysts.
1) The document compares the performance of hydrogen fuel cells and direct methanol fuel cells through experimental testing.
2) Open circuit voltages for hydrogen, 3% methanol, 2% methanol, and 1% methanol fuel cells were measured as 0.635 V, 0.157 V, 0.102 V, and 0.092 V respectively.
3) Characteristic curves were generated for the different fuel cell types, and the coefficients determined provided a relationship between voltage and current.
Microbial fuel cells generate electricity from organic matter through microbial activity. They consist of an anode and cathode separated by a proton exchange membrane. At the anode, microbes degrade organic compounds and transfer electrons to the anode. Protons pass through the membrane to the cathode. Electrons flow through an external circuit to the cathode, where they react with oxygen and protons to form water. Ionic strength, temperature, electrode spacing and material affect performance, with higher ionic strength and temperatures increasing power density up to certain points. Microbial fuel cells produce electricity from waste sources while treating wastewater.
This document summarizes a seminar presentation on a six-stroke engine. It describes how a six-stroke engine works, providing six piston movements per cycle through the use of a second piston or by capturing waste heat for an additional power stroke. The document outlines the history of six-stroke engine development and describes several notable six-stroke engine designs, including those that use steam or air from waste heat for a second power stroke and those that use an opposed secondary piston. It also discusses modifications made to convert a four-stroke engine to a six-stroke design.
1. This document describes a program to calculate activity coefficients (γmix) using the Non Random Two Liquids (NRTL) model.
2. It outlines the procedure to execute calculations in two steps: first using the Gij_matrix function to calculate interaction parameters Gij, and then the Gamma_NRTL function to calculate individual activity coefficients γ(i) using matrices for mole fractions, interaction parameters and temperature parameters as inputs.
3. The user selects a cell range for the inputs, inserts the functions, and presses CTRL+SHIFT+ENTER to execute the calculations.
Here's a project on College Stationery Management System. The front end of this application is made on Visual Basic .NET and back end is Microsoft Access 2007. You can refer this project to develop your own projects as well. This system includes Human Computer Interaction features wherein the system generates automated speech at particular selection of tools. Students pursuing BCA, BSc(IT). BSc(CS), B.Tech and other related courses can refer this project. You can also visit www.CodingAlpha.com to view the Source Code. Alternatively, Mail me on tushar.soni@outlook.com if you need the source code.
Please Comment or Like if you find this project interesting. Thanks.
a seminar report on multi-mode 2/4 stroke internal combustion enginehardik9343
The document summarizes a seminar presented by Mohammed Husain Esmail Masalawala on multi-mode 2/4-stroke internal combustion engines. The seminar addressed increasing demand for internal combustion engines, scarcity of fuel, and pollution issues. It explored areas of interest like power, efficiency, and emissions. It discussed engine types including suction ignition, compressed ignition, homogeneous compressed charged, hybrid, and boosted engines. The seminar proposed a concept of a multi-mode engine and discussed technological requirements, results, implementation areas, and concluded with highlighting the need for more efficient engines.
Fuel cells provide a possible solution to issues with battery technologies by efficiently converting chemical energy from hydrogen into electricity. Fuel cells strip electrons from hydrogen molecules to produce electricity and then recombine the electrons and protons to form water. While fuel cells have benefits like higher efficiency and lower emissions than conventional power sources, challenges remain around developing hydrogen infrastructure and bringing down production costs.
The document discusses the six stroke engine, a new engine design that combines aspects of two-stroke and four-stroke engines. It has two cycles: an external combustion cycle and an internal combustion cycle, each with four events for a total of eight events. This results in two power strokes per cycle, improving efficiency. The six stroke engine is estimated to reduce fuel consumption by 40% and dramatically cut emissions. It also allows the use of multiple fuel types. In conclusion, the six stroke engine could have a major environmental and economic impact if adopted by automakers.
The document provides an overview of fuel cell technology, including a brief history, the basics of how fuel cells work through electrolysis in reverse, the main types of fuel cells and their components and operating temperatures, benefits of fuel cells such as efficiency and reliability, and current and future applications in automotive, stationary power, and residential power units.
Fuel cells provide a promising alternative source of electricity. They convert chemical energy directly into electrical energy through an electrochemical reaction between hydrogen and oxygen, producing only water vapor and heat as byproducts. There are several types of fuel cells but proton-exchange membrane (PEM) fuel cells are well suited for transportation and small stationary power applications due to their high power density and low operating temperatures. A fuel cell consists of an anode and cathode separated by an electrolyte that allows protons to pass through but blocks electrons, forcing them into an external circuit where they can power devices before being reunited with oxygen at the cathode. While fuel cells have advantages over traditional combustion engines like higher efficiency and lack of emissions, challenges remain around infrastructure, cost and
- Hydrogen can be used as a fuel in fuel cells or internal combustion engines. It is the most abundant element in the universe and can be produced from water through electrolysis using renewable energy sources.
- Hydrogen fuel cell vehicles operate by using hydrogen and oxygen to produce electricity through an electrochemical reaction without combustion, emitting only water vapor. Several automakers have developed hydrogen fuel cell vehicle prototypes.
- For widespread adoption, infrastructure is needed for large-scale hydrogen production, storage, and distribution similar to today's gas stations. Challenges include the flammability of hydrogen and high costs of production compared to fossil fuels.
The document provides an overview of hydrogen fuel cells, including their history, types, basic functioning, and connections to electrochemistry, thermodynamics, the environment, and potential applications as an energy source. It discusses how hydrogen fuel cells work through redox reactions at the anode and cathode to produce electricity from hydrogen and oxygen, and are more efficient than combustion engines due to their electrochemical rather than combustion process. It also notes that hydrogen fuel cells can be powered through renewable energy sources like electrolysis of water using solar or hydro power.
The document discusses a six-stroke engine developed by mechanical engineering students at the College of Engineering in Trivandrum, India. The engine was created as a student project and later commercialized as the Velozeta six-stroke engine. It modifies a four-stroke Honda engine to add two additional strokes. During the fifth stroke, air is inducted through a secondary system to scavenge the cylinder. During the sixth stroke, the air and exhaust gases are pushed out. This additional induction and exhaust process improves scavenging and cooling over a conventional four-stroke engine. The students received a patent for their design and went on to form the company Velozeta to commercialize the six-stroke engine technology.
A description of how my optimization of carbon dioxide and propane mixture ratio as a working fluid helps reduce operating pressure by 33%, levelized cost of electricity (LCOE) by 6.36% and total power output from a diesel powered plant by 8% through waste heat recovery.
GENERATION OF POWER THROUGH HYDROGEN – OXYGEN FUEL CELLSinventy
This document summarizes a study that tested the ability of a hydrogen-oxygen fuel cell to generate electricity. The study used a small test rig to run experiments supplying hydrogen and oxygen gases to the fuel cell. The experiments measured voltage, current, power output, and other parameters over time. The results showed that the fuel cell was able to produce up to 13.44W of power at 11.20V by converting the chemical energy of hydrogen into electrical energy. Producing power from hydrogen in a fuel cell is presented as a clean and renewable alternative to fossil fuel-based power generation.
Study on Coupling Model of Methanol Steam Reforming and Simultaneous Hydrogen...IOSR Journals
1) A simplified mechanistic model was developed for coupling methanol steam reforming and hydrogen combustion in microchannels of a parallel plate reactor. The reforming reaction is endothermic and requires heat, which is provided by the exothermic hydrogen combustion reaction in an adjacent channel.
2) Kinetic expressions were used to model the reforming and combustion reactions. MATLAB simulations were performed to analyze parameters like temperature, velocity and conversion. Operative diagrams showed the temperature and velocities required for complete methanol conversion.
3) Efficiency curves were generated based on hydrogen produced versus consumed. With a molar ratio of 0.9664, the maximum efficiency was 86.8%, indicating over 80% efficiency is achievable via coupling of
The document summarizes a research project to design, construct, and test a 25 kW compact methanol reformer unit. A compact methanol reformer was designed by Haldor Topsøe A/S to produce hydrogen from methanol with integrated catalytic combustion. Forschungszentrum Jülich prepared a test facility and assembled the system, including a 1 kW PEM fuel cell from Siemens. Testing showed the reformer could produce 6.7 m3N/(kg cat hour) of hydrogen at 95% methanol conversion and respond to changes in demand within 20 seconds. Thin palladium membranes were also developed for hydrogen separation but required additional methane reforming to remove trace carbon monoxide from the permeate. The system successfully
STUDY OF 1.26 KW – 24 VDC PROTON EXCHANGE MEMBRANE FUEL CELL’S (PEMFC’S) PARA...ecij
The eternally intensifying exigency for electrical energy and the mount in the electricity expenditures due to the recent transience of the oil charges over and above to the desensitizing of the air standard resulting from the ejections of the obtaining energy transmutation devices have amplified exploration into substitute renewable proveniences of electrical energy. In today, there are six antithetical types of fuel cell
technologies attainable – molten carbonate fuel cells; phosphoric acid fuel cells; solid oxide fuel cells; alkaline fuel cells; polymer electrolyte membrane fuel cells and direct methanol-air fuel cells. Polymer electrolyte membrane (PEM) fuel cells – also known proton exchange membrane fuel cells, which are one of the uncomplicated types of fuel cell. PEMFC’s output power is unpredicted on nonlinearly on its output voltage and current. The output current of a proton exchange membrane fuel cell stack relies on the load located on that particular stack. This paper presents a 1.26 kW -24 Vdc PEMFC system and DC – DC boost converter topology used in 1.26 kW PEM fuel cell to fortify that the zenith obtainable output power
from a PEM membrane fuel cell is distributed to a load during a power outage bridging the start-up time and to optimize the health of the fuel cell membrane stack. A 1.26 kW – 24 Vdc PEMFC system is considered in this study as well as investigate how the output behaves.
STUDY OF 1.26 KW – 24 VDC PROTON EXCHANGE MEMBRANE FUEL CELL’S (PEMFC’S) PARA...ecij
The eternally intensifying exigency for electrical energy and the mount in the electricity expenditures due
to the recent transience of the oil charges over and above to the desensitizing of the air standard resulting
from the ejections of the obtaining energy transmutation devices have amplified exploration into substitute
renewable proveniences of electrical energy. In today, there are six antithetical types of fuel cell
technologies attainable – molten carbonate fuel cells; phosphoric acid fuel cells; solid oxide fuel cells;
alkaline fuel cells; polymer electrolyte membrane fuel cells and direct methanol-air fuel cells. Polymer
electrolyte membrane (PEM) fuel cells – also known proton exchange membrane fuel cells, which are one
of the uncomplicated types of fuel cell. PEMFC’s output power is unpredicted on nonlinearly on its output
voltage and current. The output current of a proton exchange membrane fuel cell stack relies on the load
located on that particular stack. This paper presents a 1.26 kW -24 Vdc PEMFC system and DC – DC
boost converter topology used in 1.26 kW PEM fuel cell to fortify that the zenith obtainable output power
from a PEM membrane fuel cell is distributed to a load during a power outage bridging the start-up time
and to optimize the health of the fuel cell membrane stack. A 1.26 kW – 24 Vdc PEMFC system is
considered in this study as well as investigate how the output behaves.
Study on Thermo-Electric Generator and hydrogen recirculation on Solid Oxide ...IRJET Journal
This document discusses improving the efficiency of solid oxide fuel cells (SOFCs) through waste heat recovery and hydrogen recirculation. It proposes using thermoelectric generators (TEGs) to convert the waste heat from SOFCs into electricity, which would then power electrolysis of the SOFCs' water byproduct to produce hydrogen. This hydrogen could be recirculated back into the SOFCs. The document also discusses using a multi-stage configuration with SOFCs and proton exchange membrane fuel cells (PEMFCs) to further improve efficiency. MATLAB simulations were used to analyze the efficiency gains from waste heat recovery and hydrogen recirculation in SOFC systems. The results suggest this approach could increase SOFC system
1 ijaems dec-2015-1-the effectiveness of using a non-platinum catalyst for a ...INFOGAIN PUBLICATION
The document discusses testing the effectiveness of using non-platinum catalyst materials in proton exchange membrane fuel cells (PEMFCs). Three membrane electrode assemblies (MEAs) were tested - two with platinum loadings and one with silver and ruthenium/iridium oxide instead of platinum. The non-platinum MEA achieved a maximum power density of 2.3x10⁻⁶ W/cm2 compared to 1.99x10⁻⁶ W/cm2 for the platinum MEA, demonstrating the potential of alternative catalyst materials to reduce PEMFC costs.
IRJET- Optimum Design of Photovoltaic / Regenerative Fuel Cell Power Syst...IRJET Journal
This document discusses the optimal design of a hybrid photovoltaic/regenerative fuel cell (PV/RFC) power system for a remote telecom station. The system uses a PV subsystem to generate electricity from solar irradiation. Surplus energy is used to produce hydrogen and oxygen through electrolysis. The hydrogen is stored and then used in a fuel cell to generate electricity during times when solar energy is insufficient to meet load demands. The document outlines the methodology for sizing the PV array, electrolyzer, fuel cell, and hydrogen storage tank. Calculations are provided for hydrogen and oxygen production and usage, as well as water balance. The goal is to size the system components so that hydrogen production matches consumption to reliably meet the station
The document describes a proposed process to produce 50,000 metric tons per year of dimethyl ether (DME) through the catalytic dehydration of methanol. Key aspects of the process include:
- Methanol and recycled methanol will be mixed, vaporized, and sent to a fixed bed reactor operating at 350°C to produce DME and water.
- The reactor effluent will be cooled and separated into DME product and a stream of methanol and water using two distillation columns.
- The project tasks involve developing a process flow diagram, performing material balances, equipment sizing and costing, estimating capital and operating costs, and evaluating the economic viability of the process.
This document summarizes a MATLAB-Simulink model of a PEM fuel cell stack. The model analyzes factors that affect fuel cell efficiency like flow rate, temperature, and pressure. It also observes the behavior of the fuel cell stack under varying load and fuel/oxidant flow rates. The model includes both a simplified model operating at nominal conditions and a more detailed model that incorporates additional parameters. Simulation results are presented comparing operation at nominal fuel utilization versus maximum utilization. The model provides a concise representation of a PEM fuel cell stack and allows analysis of key influences on its performance.
This document describes a study evaluating different steam cycle designs to provide heat and power for a CO2 capture system on an offshore oil and gas installation. Three steam cycle configurations were modeled - an extraction condensing turbine, backpressure turbine, and combination cycle. The backpressure cycle was found to provide all necessary steam and power for CO2 capture and compression with some excess capacity. Weight relationships for major equipment were developed to estimate how cycle components would scale with changes in gas turbine exhaust flow. The study aims to identify the best steam cycle design for offshore CO2 capture applications.
1. The document discusses simulation and analysis of a proton exchange membrane fuel cell (PEMFC) cooling system using various coolants and a porous metal foam. It aims to optimize output power, efficiency, environmental impacts, and cost.
2. Simulation results show that using both a nanofluid coolant and porous foam for heat dissipation is not effective, while using just water or porous foam can better cool the fuel cell.
3. Increasing current density decreases efficiencies and increases environmental impacts, but optimization shows efficiencies up to 45% and 57% for energy and exergy, respectively.
DESIGN AND DEVELOPMENT OF SOLAR WATER HEATING SYSTEM USING PHASE CHANGE MATERIALIRJET Journal
This document describes the design and development of a solar water heating system using phase change material (PCM) for thermal energy storage. It discusses selecting paraffin wax as a suitable PCM due to its melting temperature range of 45-55°C and high latent heat. The system was designed with a PCM-filled heat exchanger integrated into the solar water heating setup. Experimental results showed the PCM system increased average efficiency by 13% compared to a standard solar water heater without PCM, and kept water temperatures higher for longer periods after sunset. The prototype demonstrated the effectiveness of PCM for improving solar water heating system performance by storing thermal energy for use when solar radiation is unavailable.
Analysis of recoverable exhaust energy from a light duty gasoline engine by u...ijctet
This document reviews methods of recovering exhaust energy from internal combustion engines using heat pipes. It discusses how heat pipes effectively transfer heat from exhaust gases to a condenser region, enhancing engine thermal performance. The document examines several studies on recovering exhaust waste heat using Rankine cycle systems and heat pipes. These studies found that waste heat recovery can increase engine fuel efficiency by 3-34% and power output by up to 20%, depending on the system and engine operating conditions. Recovering just 6% of exhaust heat energy could result in a 10% reduction in fuel consumption. The document concludes that heat pipe waste heat recovery systems show promising potential but require further research.
Design and optimization of kemira leonard process for formic acid productionSanjanaSingh153
The document summarizes a study on the design and optimization of the Kemira-Leonard process for producing formic acid. Key aspects of the study included simulating the process in Aspen Plus, performing heat integration to reduce utility usage, sizing equipment and estimating capital costs, and conducting multi-objective optimization to minimize total capital and annual utility costs. The optimized process design was able to produce 98% formic acid at an annual capacity of 27,476 tonnes/year at minimized costs.
IRJET- Performance and Evaluation of Aqua Ammonia Air Conditioner System ...IRJET Journal
This document discusses the performance evaluation of an aqua-ammonia air conditioning system for automobiles that uses waste exhaust heat from the vehicle engine. The study examines how the generator and absorption refrigeration system can utilize the available waste heat. Results found that the cooling capacity was affected by the ammonia concentration and provided acceptable cooling between 1-1.5 tons. The coefficient of performance was highest at higher generator and evaporator temperatures but decreased with increasing condenser and absorber temperatures. Overall, the study shows that an aqua-ammonia vapor absorption system has the potential to provide air conditioning for vehicles using only waste exhaust heat from the engine.
This document compares three fuel processor configurations for producing hydrogen from methanol to power a PEM fuel cell: 1) steam reforming with external heat, 2) autothermal reforming, and 3) autothermal reforming using a palladium membrane reactor. It finds that steam reforming and autothermal reforming fuel processors coupled to a PEM fuel cell can achieve around 50% overall efficiency, with fuel processor volumes of around 29 liters and 22 liters, respectively, for 50 kW net power generation. The autothermal reforming membrane reactor reduces the fuel processor volume to 13 liters but with a more complex steam system and slightly lower overall efficiency.
This document compares three methanol-based fuel processor configurations for PEM fuel cell systems: 1) steam reforming followed by preferential oxidation for CO removal, 2) adiabatic autothermal reforming followed by preferential oxidation, and 3) adiabatic autothermal reforming in a palladium membrane reactor. The document finds that steam reforming and autothermal reforming fuel processors coupled with a PEM fuel cell achieve about 50% overall efficiency, with reactor volumes of around 29 liters and 22 liters, respectively. The autothermal reforming membrane reactor reduces the volume to 13 liters but with a more complex steam system and slightly lower efficiency.
This document is a seminar report submitted by Mukesh Kumar for partial fulfillment of a Bachelor of Technology degree in Mechanical Engineering. It discusses thermal power plants, including an overview of their operation and efficiency, descriptions of typical components like boilers and steam cycles, and examples of power plants located in India with a focus on those in Rajasthan. The document received certification from internal and external examiners for Mukesh Kumar's seminar work on the topic of thermal power plants.
1.
March 13, 2015
Professor Justin Opatkiewicz
Department of NanoEngineering, UC San Diego
9500 Gilman Drive La Jolla, CA 92093
Professor of Chemical Engineering
Dear Professor Justin Opatkiewicz:
In order for our group to deliver electricity to a 300 office suite building, a PEMFC (Proton Exchange
Membrane Fuel Cell) was modeled, utilizing hydrogen as fuel. A plant was designed that synthesized
hydrogen from a starting feed of liquid heptane. Simulations were ran through the ASPEN program in
order to evaluate an efficient design. Once a working plant model was established, the economics of the
plant was analyzed in order to model of the costs and profit of the plant.
Future modifications to the plant will help optimize the production of hydrogen to the fuel cell in a
more cost efficient manner. Modifications in the delivery of energy to the system and recycling streams
were considered to be valuable factors for future simulations, and are discussed although not modeled.
These factors will help enable a more cost efficient delivery of hydrogen to the fuel cell, thus providing
more profit.
Sincerely,
Group B4
Brandon Sanchez Janet Mok
Liliana Busanez Saman Hadavand
Department of NanoEngineering,
Chemical Engineering
Chemical Plant & Process Design:Ceng 124A
3. Abstract
The total cost of the plant was determined to be $4,823,734.00 +/ 30%. The net profit of
the plant was unprofitable, losing $239,010,00.00 over a 25 year span. The plant model requires
2895 kW of energy to operate. The total hydrogen produced for the fuel cell feed was 156.3
kmol/hr. The fuel cell outputs a total of 2765 kW of energy. The current density chosen to
operate at was 775 mA/cm2
with a corresponding power density of 0.275 W/cm2
. The surface
area of the fuel cell was then determined to be 1005 m2
.
2
5. Introduction
Fuel Cells are currently being used as potential successors to internal combustion engines
and stationary power generators like steam turbines and diesel engines because of their high
system efficiencies and low emissions. PEM fuel cells are used for stationary power supplying
electricity and are believed to be an ideal longterm alternative to other processes that waste
energy at conversion interfaces, including the use of platinum/catalyst that are more resistant to
carbon monoxide and minimize effects of poisoning for PEM fuel cells¹.
The Proton Exchange Membrane (PEM) fuel cell was used to provide electricity to a 300
office suite building . The fuel delivery module is what governs the delivery of the hydrogen to
the fuel cell stack and is needed in fuel cell installations. Hydrogen purity is critical in fuel cell
technologies². For the fuel cell performance and operation, the fuel cell stack operates by the
oxidation of hydrogen at the anodes of the individual cells:
(1)₂ 2H⁺ 2eH = +
where protons are produced in this oxidation and are transported through the PEM to the
cathode. Oxygen in air reacts with electrons and protons transfer through the cell to make water,
₂ 4H⁺ e H₂OO + + 4 = 2 (2)
The design of the PEM fuel cell consist of the autoreformer, the water gas shift reactor, and
PROX reactors. The heptane fuel is fed into the autoreformer to prepare the hydrogen fuel
containing carbon dioxide, and other impurities, as well as unreacted fuel. The equations used
inside the autoreformer are,
(3)EPTANE 7H O → 7CO 15HN − H + 2 + 2
(4)O 3H → H O METHANE C + 2 2 +
(5)O H O → CO HC + 2 2 + 2
4
6. (6)ETHANE 2H O → CO 4HM + 2 2 + 2
The Water Gas Shift reactor equilibrium reaction is
(reversible)O H₂O CO₂ H₂C + = + (7)
The kinetics model for the Water Gas Shift(WGS) reactor is shown in the equation
(8)k[CO](1 )− rco = η − β
(9)n k n k /(RT)l = l o − E
where is the effectiveness factor accounting for intraparticle mass transport limitation, [CO] is η
the gas phase concentration of CO, , is the equilibrium CO ][H ]/{[H O][CO]K }β = [ 2 2 2 T KT
constant for the WGS reaction, and .n(K ) 577.8/T .33l T = 4 − 4
The PROX (PFR) reactor is a packed catalyst bed where the main and side reactions are,
CO O₂ CO₂ (main reaction)2 + = 2 (10)
H₂ O₂ H₂ (side reaction)2 + = 2 (11)
The PROX reactor kinetics model is shown in the equation,
(12)1 /Q ) XCO = 1 − ( − η * k1 * k2 Total
1.66
(13).58 exp(− 522/T[K])k1 = 7 * 106
8
(14)6.2 y k2 = 2 * P0.4
CO,in
−0.6
* λ0.82
* mPt
where XCO is fractional conversion, is the effectiveness factor of 0.5, k1k2=12 std cm3
/min, P isη
the total pressure, yCO,in is the carbon monoxide mole fraction in the feed to PROX,
, mPt is the mass of Pt in the catalyst, and QTotal is the std cm3
/min of feed to theO ]/[CO]λ = 2 * [ 2
PROX.
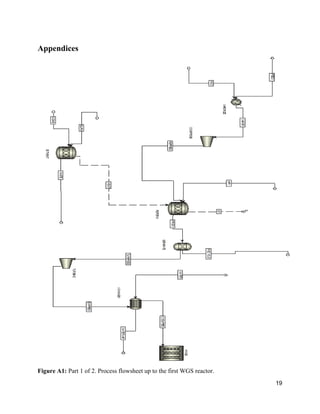
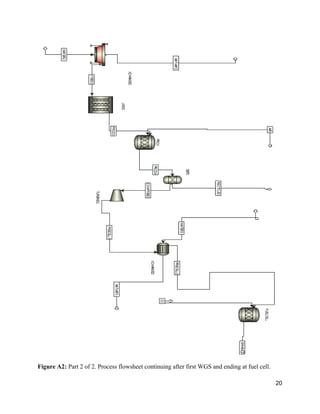
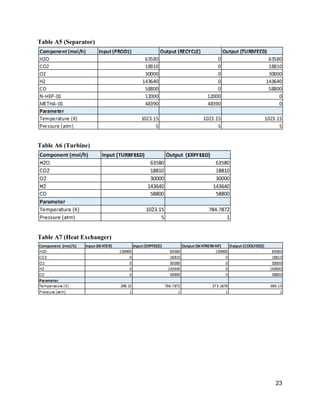
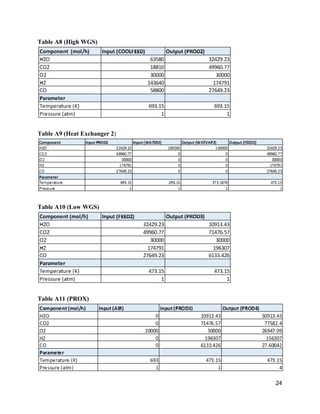
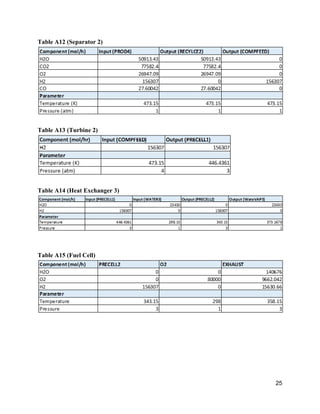
Heat Exchangers, turbines, compressors, and separators were used throughout our
simulation to cool the feed, expand the pressure in the feed, and compress or separate the gases
5
7. in the reactor. The Log Mean Temperature Difference (LMTD) was used to solve for the heat
exchanger area.
(15)
(16)AΔT Q = U LMTD
The utilities used for this simulation were a fuel cell, autoreformer for
gasoline(NHeptane), a High Water Gas Shift reactor, Low Water Gas Shift reactor, PROX
reactor, a compressor/turbine, and heat exchangers. The fuel cell cost $270/m2
, the autoreformer
cost $53/kg catalyst, high water gas shift reactor cost $14/kg catalyst, low water gas shift reactor
cost $22/kg catalyst, PROX reactor cost $150/kg catalyst, the compressor/turbine cost $600 each,
and the heat exchanger cost $4/kg. Costly testing can be minimized with 2dimensional
simulations to stimulate fuelcell system performance. Further research on fuel cell stacks
continue to be optimized¹.
A complete economic analysis was conducted for the stationary fuel cell design in order
to determine the most costefficient design with the proper sizing. The simulation was optimized
to use heat energy from different reactors to power the system as well as using recycle streams to
optimize materials. Equipment sizing, total capital equipment costs, and yearly annual costs were
determined using Aspen.
Results/Discussion
Our current fuel cell design does not supply the entire electrical load to our processing
plant. The fuel cell currently outputs 2765 kW of available energy. The sum of the processing
6
8. plant and auxiliary loads is 1995 kW. The average load for the office building is 900 kW.
Therefore, the current plant design required 2895 kW of energy, leaving a 130 kW of energy still
required for plant operation. Optimally, the fuel cell would power the entire processing plant,
leaving no electrical costs.
The entire process flowsheet is displayed in two parts as Figures A1 and A2 in the
appendix. The following sections involve discussing different segments of the plant beginning
from the liquid heptane feed to the fuel cell exhaust. Only major parameters of streams, i.e. H2
molar flow rates, and equipment will be noted, with the remaining parameters located in the
appendix tables.
Heptane Auto Reformer
Figure 1: Beginning of plant process flowsheet. Liquid heptane and water are vaporized and compressed to prepare for
the auto reformer. The furnace provides heat for the endothermic steam reformation of heptane by combusting heptane.
7
9. The process begins with a liquid heptane feed entering at 30 kmol/hr and 298 K mixing
with superheated steam in the vaporizer. The vaporizer flashes the stream to 885 K; the
parameters are illustrated in Table A1. The stream is then compressed to 5 atm, as illustrated in
Table A2.
The auto reformer operates at 1023 K and 5 atm. Eqn’s 36 illustrate the reactions taking
place within the reformer. An external furnace, illustrated in Table A3, was utilized by
combusting the heptane fuel and directing the heat to the auto reformer, thus providing energy
for the endothermic steam reformation of heptane. Once the steam reformation had enough
energy, the remaining reformation reactions were able to proceed. By redirecting the 2636 kW
generated from the furnace, we were able to produce 22 kW from the auto reformer. Reformer
stream results are illustrated in Table A4. 143.64 kmol/hr H2 is produced from the auto reformer,
with a 60% conversion of heptane with respect to Eqn 3. Using the sizing data provided at .51
l/kW of fuel cell output, the auto reformer volume was determined to be 1.41 m3
.
High Temperature WGS
8
10.
Figure 2: Process flowsheet continuing after auto reformer. Residual methane/heptane are removed from product
stream. Product is expanded from 5 atm to 1 atm and sent through heat exchanger to prepare for high temperature
WGS. Water is used as cooling liquid for heat exchanger.
After the auto reformer, the products are separated to be expanded and cooled to prepare
for the high temperature WGS. The separator takes out residual methane and heptane gas, at a
total of 60.4 kmol/hr. Recycle of these streams was not implemented in the flow sheet and is
discussed in the optimization section later on. The separator is illustrated in Table A5. The
turbine expands the product feed containing: H2O, CO2, O2, H2 and CO to 1 atm. The turbine is
illustrated in Table A6.
9
11. The expanded feed at 784.8 K was then sent through a heat exchanger at 314.8 kmol/hr.
Water was used as the cooling liquid at 298 K and 100 kmol/hr. The output feed was then cooled
to 693 K for the first WGS reactor. The first heat exchanger is illustrated in Table A7.
The first WGS reactor was modeled as a multitube plug flow reactor consisting of 100
tubes, each 100m long and 5m wide. The reactor operated at 693 K and 1 atm. Eq 7 illustrates
the reaction taking place within the reactor. Ergun pressure drop correlations were utilized in
order to model catalyst information from the project statement. 10 Mg of catalyst was used. The
approximate volume was calculated to be 13.3 m3
. The reactor produced 31.2 kmol/hr H2, which
is a 21.7% increase from the amount of H2 originally present. The first WGS reactor is illustrated
in Table A8.
Low Temperature WGS
Figure 3: Process flowsheet continuing after high temperature WGS. Product is cooled to prepare for low temperature
WGS. Water is used as cooling liquid for heat exchanger.
10
12. The products from the first WGS reactor were then sent to a heat exchanger. The second
heat exchanger cooled the feed to 473 K. Water at 100 kmol/hr and 298 K was used as the
cooling liquid. The second heat exchanger is illustrated in Table A9.
The second WGS reactor was also modeled as a multitube plug flow reactor, but
consisting of 50 tubes, each 100m long and 2m wide. Ergun pressure drop correlations were
utilized in order to model catalyst information from the project statement. 10 Mg of catalyst was
used. The approximate volume was calculated to be 12.2 m3
. 21.5 kmol/hr of H2 was produced,
which is a 12.3% increase from the amount of H2 originally present. The second WGS reactor is
illustrated in Table A10.
PROX
Figure 4: Process flowsheet continuing after low temperature WGS. Product stream and air are fed to PROX reactor.
Product is then separated to purge everything left over except hydrogen gas.
11
13. The PROX reactor operated at 473 K at 4 atm. 81.63 kg of catalyst was used. The volume
of the PROX reactor was calculated to be .1 m3
. The mixed product from the second WGS is fed
to the PROX along with air. 6.13 kmol/hr of CO entered the PROX to be reacted according to
Eqn. 8. CO left the PROX at 27.6 mol/hr, which is a 99.5% conversion of CO. H2 reacted with
oxygen according to Eqn. 9. The amount of H2 leaving the reactor was 156.3 kmol/hr. The
product from the PROX is separated in order to isolate H2 from the other components.
Fuel Cell
Figure 5: Process flowsheet continuing after PROX. H2 gas is expanded to 3 atm and cooled to prepare for fuel cell
feed. Water is used as cooling liquid for heat exchanger. Oxygen is fed to fuel cell to oxidize H2.
The pure H2 stream was expanded to 3 atm and 446.4 K. The second turbine is illustrated
in Table A13. The stream was then sent to the final heat exchanger using water entering at 23.43
12
14. kmol/hr and 298 K for cooling liquid. The H2 leaves the exchanger at 343 K and sent to the fuel
cell. The third heat exchanger is illustrated in Table A14. The amount of H2 entering the fuel
cell is 156.3 kmol/hr.
We chose to run the fuel cell at a current density of 750 mA/cm2
and a pressure of 3 atm
in order to maximize power density at .275 W/cm2
, according Figure A3. The fuel cell utilized
140.7 kmol/hr of hydrogen from the feed. In order to achieve the desired current density, a
surface area of 1005 m2
is required. The fuel cell outputs 2765 kW with our current design
parameters. The fuel cell is illustrated in Table A15.
Heat Exchangers
Three heat exchangers were utilized to cool vapor feeds for the high and low temperature
WGS reactors, and the fuel cell. All exchangers were modeled as shell and tube, with the hot
feed entering the shell side and cooling water entering the tube side. The energy required for the
heat exchangers was used to calculate the active heat transfer surface area using the LMTD
approach, according to Eqns 13 and 14. The surface areas for each exchanger 1,2 and 3 were
calculated to be 1.45, 5.84 and 4.96 m2
, respectively.
Optimization
Energy
Multiple units in the plant require energy that must be supplied externally in order to
operate. These pieces of equipment are: the feed vaporizer, feed gas compressor, all three heat
exchangers and the heptane auto reformer. The net sum of the energy required to operate these
pieces of equipment is 9172 kW according to our simulation results. The feed vaporizer and the
auto reformer require the majority of the energy, being 4563 and 2615 kW, respectively.
13
15. Fortunately, there are sources of thermal energy released from various locations throughout the
plant that may be directed and used to power the equipment, although not modeled in our
simulation.
Sources of energy generated from the plant, not including the fuel cell, come from: both
of the gas turbines, both of the WGS reactors, and the PROX reactor. The net amount of energy
generated from these pieces of equipment is 4563 kW. The majority of the energy is supplied
from the PROX reactor, being 3226 kW, which is expected from the multiple combustion
reactions. Because the feed vaporizer required 4563 kW to operate, it may be useful to direct all
the heat generated from the PROX reactor to supply energy to the vaporizer. Additional energy
can be supplied from the gas turbines which put out a total of 748 kW, and the WGS reactors
which put out a total of 567 kW.
Water was used as the cooling liquid in all shell and tube heat exchanger models. The
outlet streams of all three of the cooling streams were at 373 K, some being full vapor and some
being mixed phase. At our current design, these heated streams are not utilized in any way. It
would be useful to further optimize the plant by directing heat from these vapor streams to the
externally driven equipment. It could then be possible to reuse the condensed water to combine
with the heat exchanger inlet cooling streams, thus reducing the total amount of water used.
Recycle
There are multiple places in the plant that can utilize recycle streams, although not
modeled in our simulation. These streams are: the residual methane/heptane stream separated
from the auto reformer products and the fuel cell exhaust stream. The heptane and methane
steam reforming reactions and the methane water gas shift reaction can be manipulated by
14
16. recycling methane and heptane into the reformer feed. This design would be in consideration of
Le Chatelier's principle. In knowing that the auto reformer operates at equilibrium, addition of
methane and heptane may push the reactions towards producing more H2. Further optimization
of this recycle design could reduce the total amount of heptane feed required in the plant.
The fuel cell exhaust contains: unreacted hydrogen from the feed, oxygen and water
produced from the reduction of hydrogen. Further optimization of the plant would consider
recycling this water to other stages in the plant, possibly for the cooling liquid for the heat
exchangers. It may be possible to optimize the plant is such a way that the heat exchangers
primarily use the water produced from the fuel cell, and only use external water if needed. The
unreacted hydrogen should be rerouted to other fuel cells on site or any processing plant in the
vicinity that could utilize the excess hydrogen gas.
Economic Analysis
Using the cost curve method, which relates capital cost to capacity, Table 7.2 is applied
to rough estimate the capital cost giving $4,823,734 ± 30% for the plant. Equipment will be
made from 304 stainless steel and carbon steel. The equipment list provides the item combined
costs, and lang factors, included for the material type for the cost distribution of equipment
summing up to this capital cost (Table A16).
Costs factors in the analysis include fixed factory expenses such as equipment
depreciation, utilities, and maintenance as well as direct costs such as material and labor.
However, because this analysis is intended to model manufacturing costs, number of components
that contribute to the original equipment manufacturer are not included in the modeling. The
following is not included in this analysis: onetime costs such as research, design, engineering,
15
17. warranties, advertising, and sales tax. The plant was determined to be unprofitable after taxes
and revenue based off sale of electricity at $32.29 cents per kW hour as priced in Hawaii3
.
Overall, the net profit was determined to be $239,010,000 over the 25 year plant operation.
The sale of electricity was based according to the U.S. Energy Information
Administration and average retail price of electricity to customers in commercial sector from
December 2014 which has shown to decline from December 2013. So therefore, a decrease in is
observed energy prices are not accounted for or compared to 2015 rates, and an average retail
price of electricity is used. To take full advantage of energy markets, partnerships, as well as
experienced energy managers would offer strategic approaches.4
Modeling results for PEM fuel system capital costs are broadly consistent with
manufacturer values provided by PEMFC technology and application in the global market today.
According to Fuel Cell Industry Review 2013, investment total capital is at $1.2 billion, where
production capacity is increasing according to agreements with energy industry and companies.
Our plants capacity and capital investment costs does not include promotion of company
agreements and government incentives that would otherwise contribute to greater revenue and
profits.5
Our PEMFC system with electrical output At 2.765 MWh, have utility costs that dominate the
total plant costs since heat or electricity generation is needed for or process. Primary cost drivers are the
compressors and turbines, reactors, and furnace for heat supply, in that order. Besides the costs for
system, the PEM stack consists of reactor size used to calculate stack costs, where the lifetime of the
stack can be increased at the expense of increased cost through system oversizings.6
This cost analysis
aims to develop economic models for our system, including for capital cost, manufacturing cost and
investment cost by taking into account process units and utilities of the system.
16
19. inlet cooling streams which would reduce the total amount of water used. The design could also be
optimized by utilizing recycle streams, although not modeled in the simulation. Further optimization of
this recycle design could reduce the total amount of heptane feed required in the plant, and optimize the
plant is such a way that the heat exchangers primarily use the water produced from the fuel cell, and
only use external water if necessary.
References
[1] Weider, John W., et al. “Engineering a Membrane Electrode Assembly” The Electrochemical
Society Interface (2003): 4143. Print.
[2] Energy.gov. U.S. Department of Energy, Hydrogen and Fuel Cell Technology Basics, 2013.
Web. 10 Mar. 2015.
[3] U.S. Energy Information Administration, Form EIA826, Monthly Electric Sales and
Revenue Report with State Distributions Report
[4] ARAMARK Energy Services, “Best Practices in Energy Procurement” Managed Heat Rate
[5] FuelCellToday, The Fuel Cell Industry Review 2013, Johnson Matthey PLC trading
[6] Kamarudin, S.K.“Technical design and economic evaluation of a PEM fuel cell system”
ScienceDirect 157.2 (2006): 641–649. Print.
18