Download as PDF, PPTX
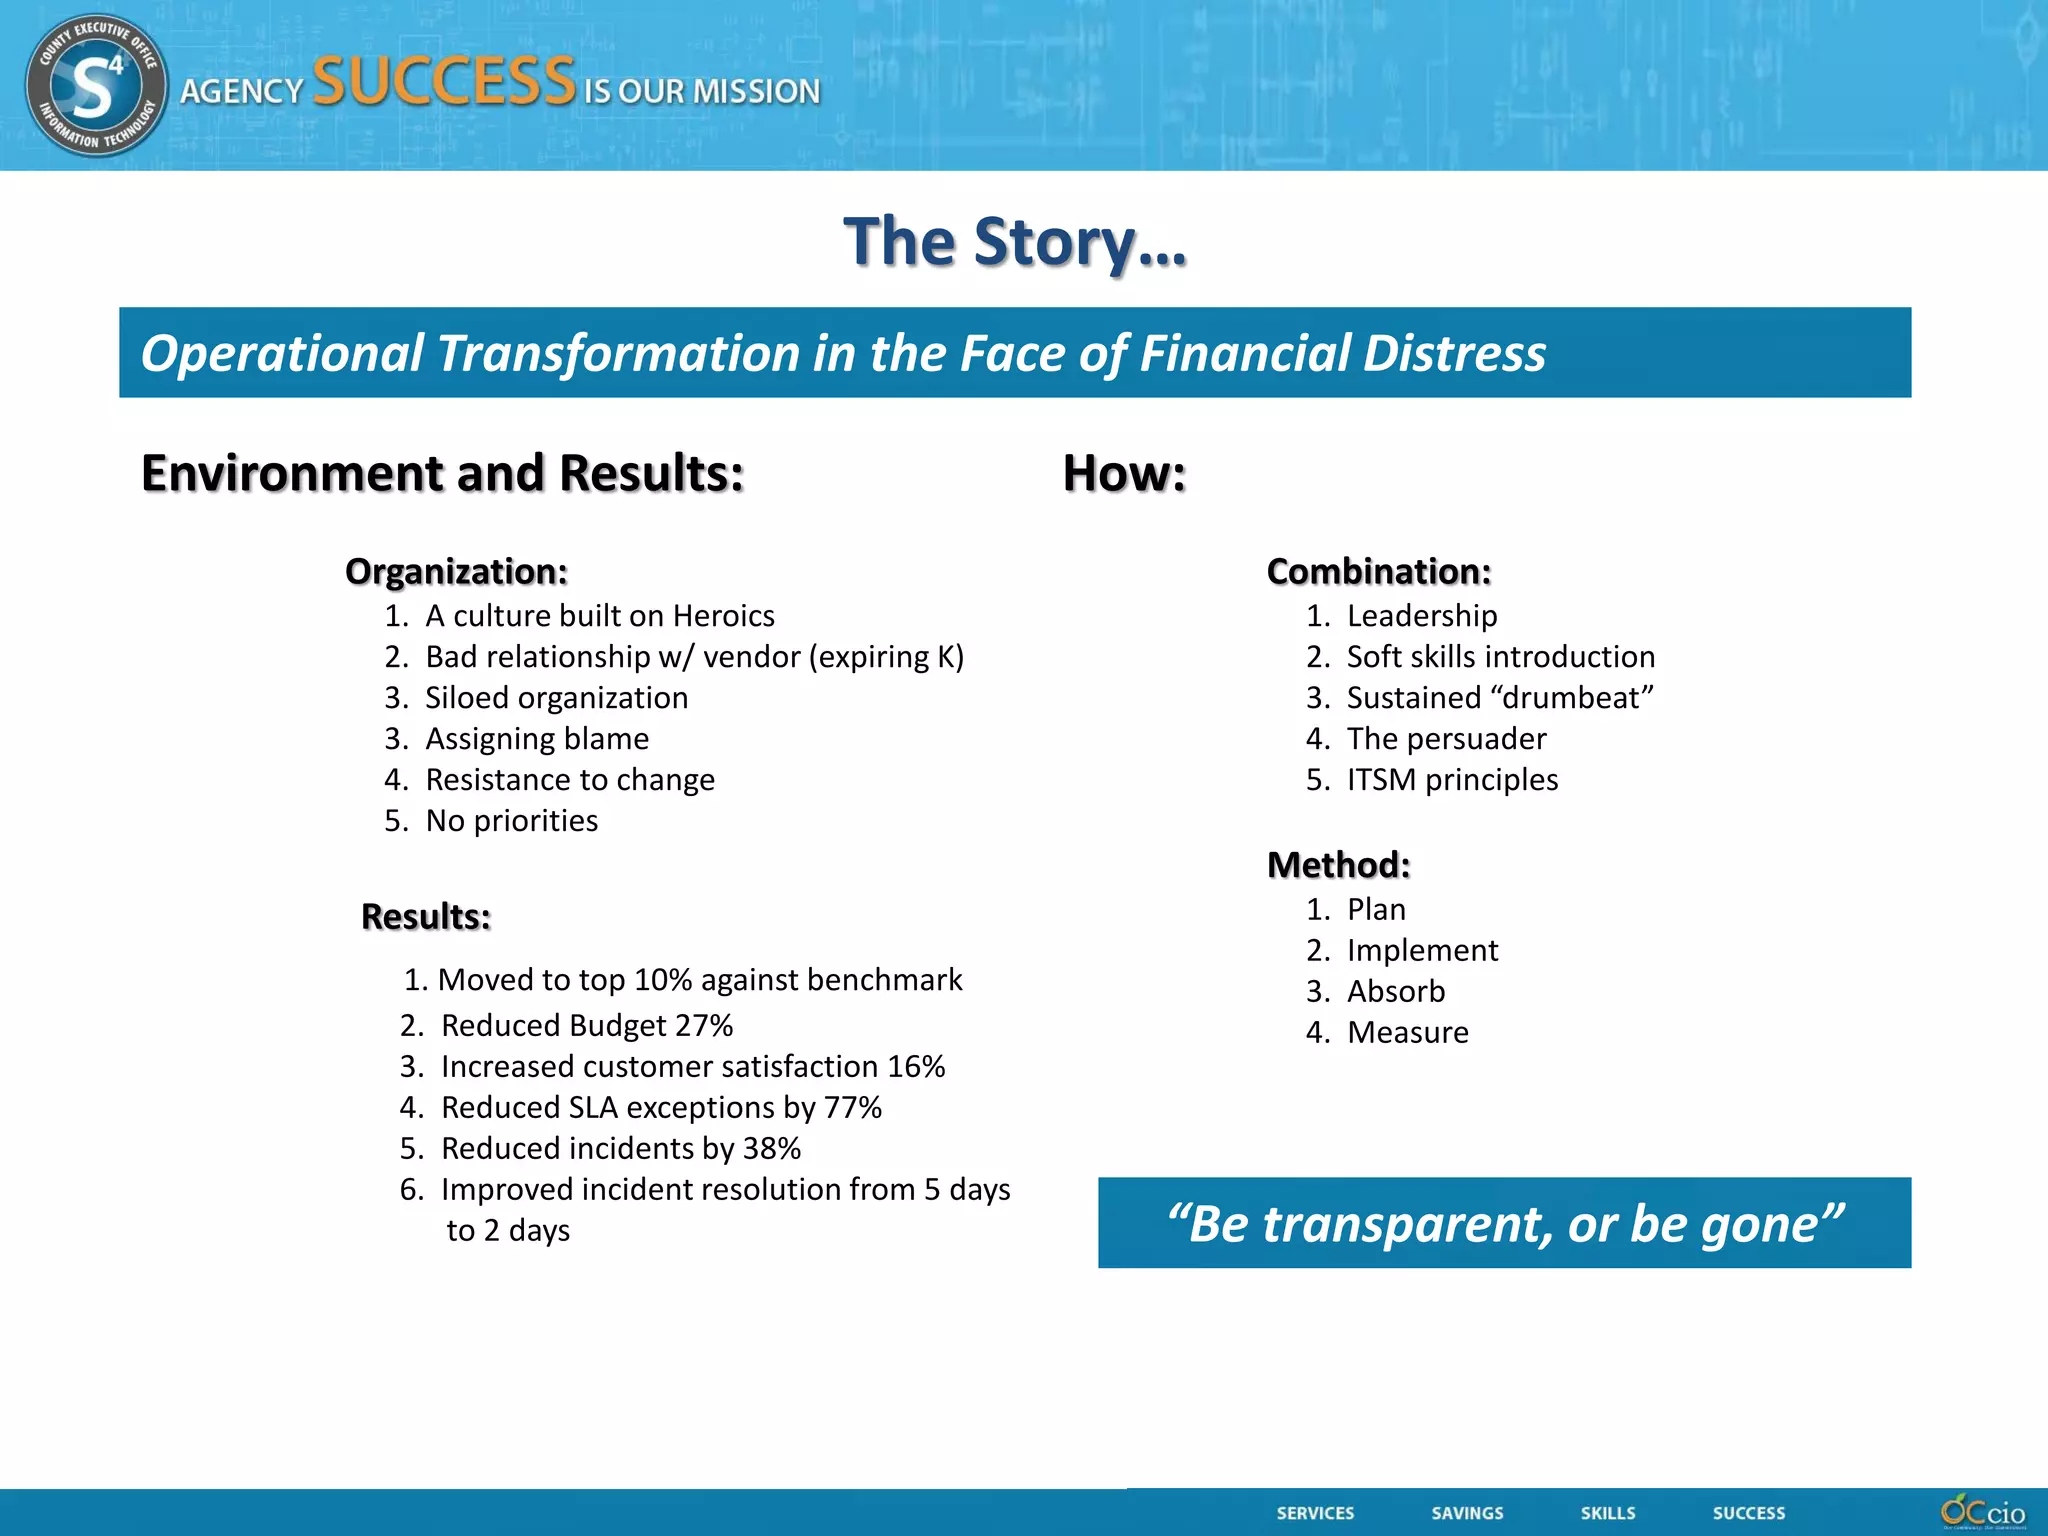
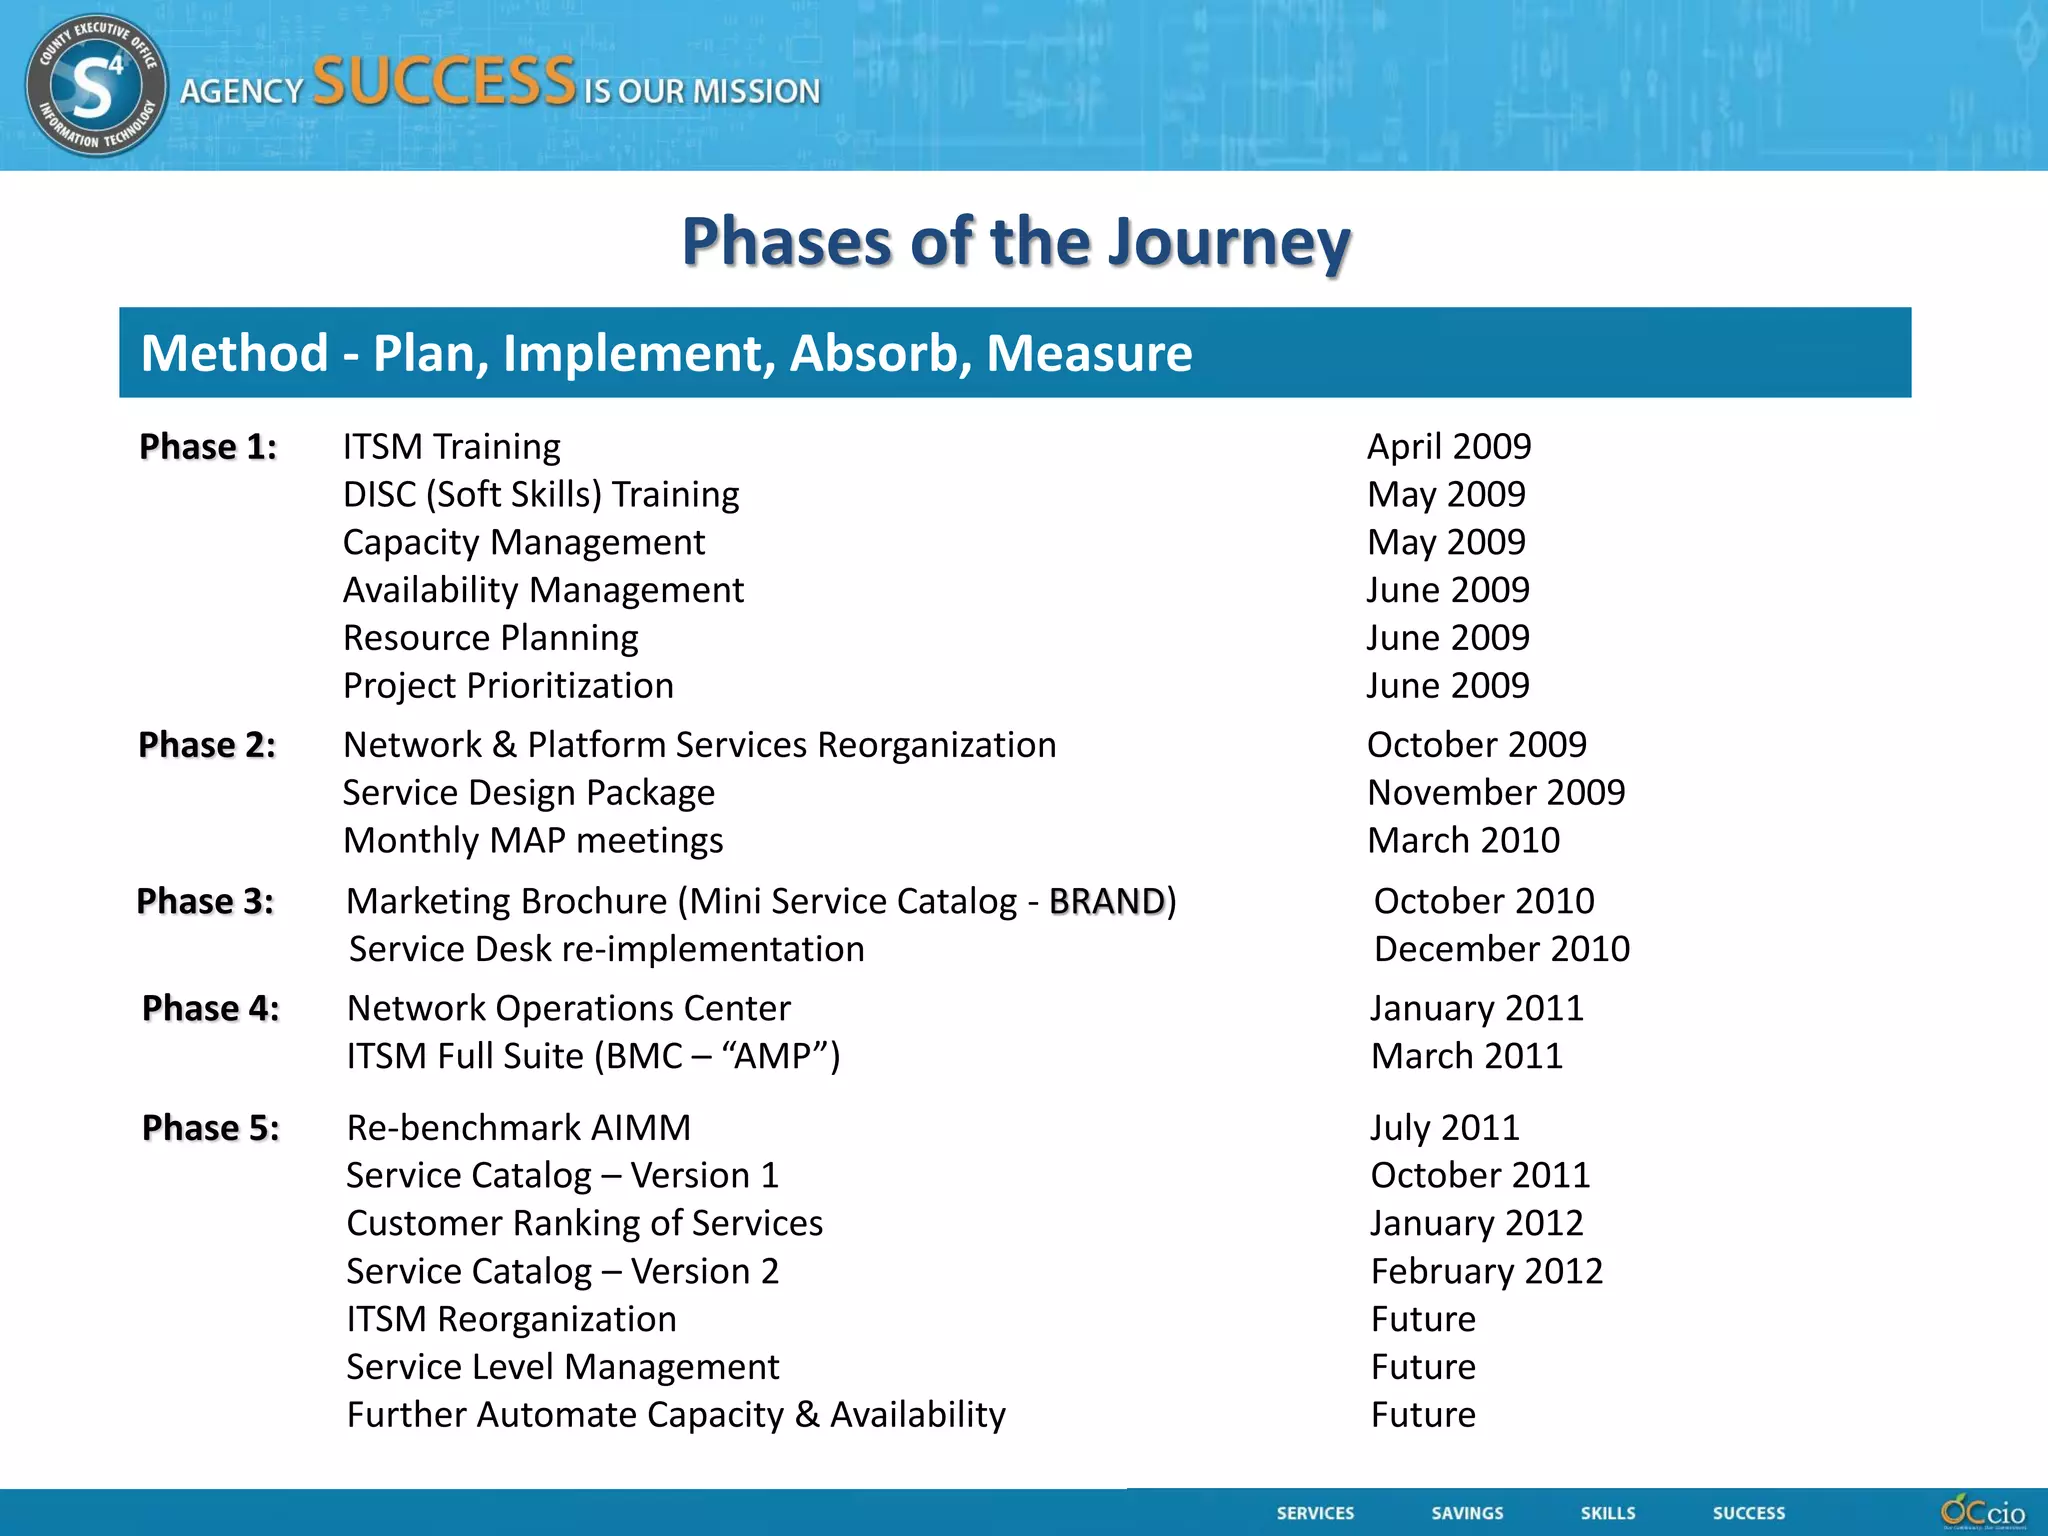
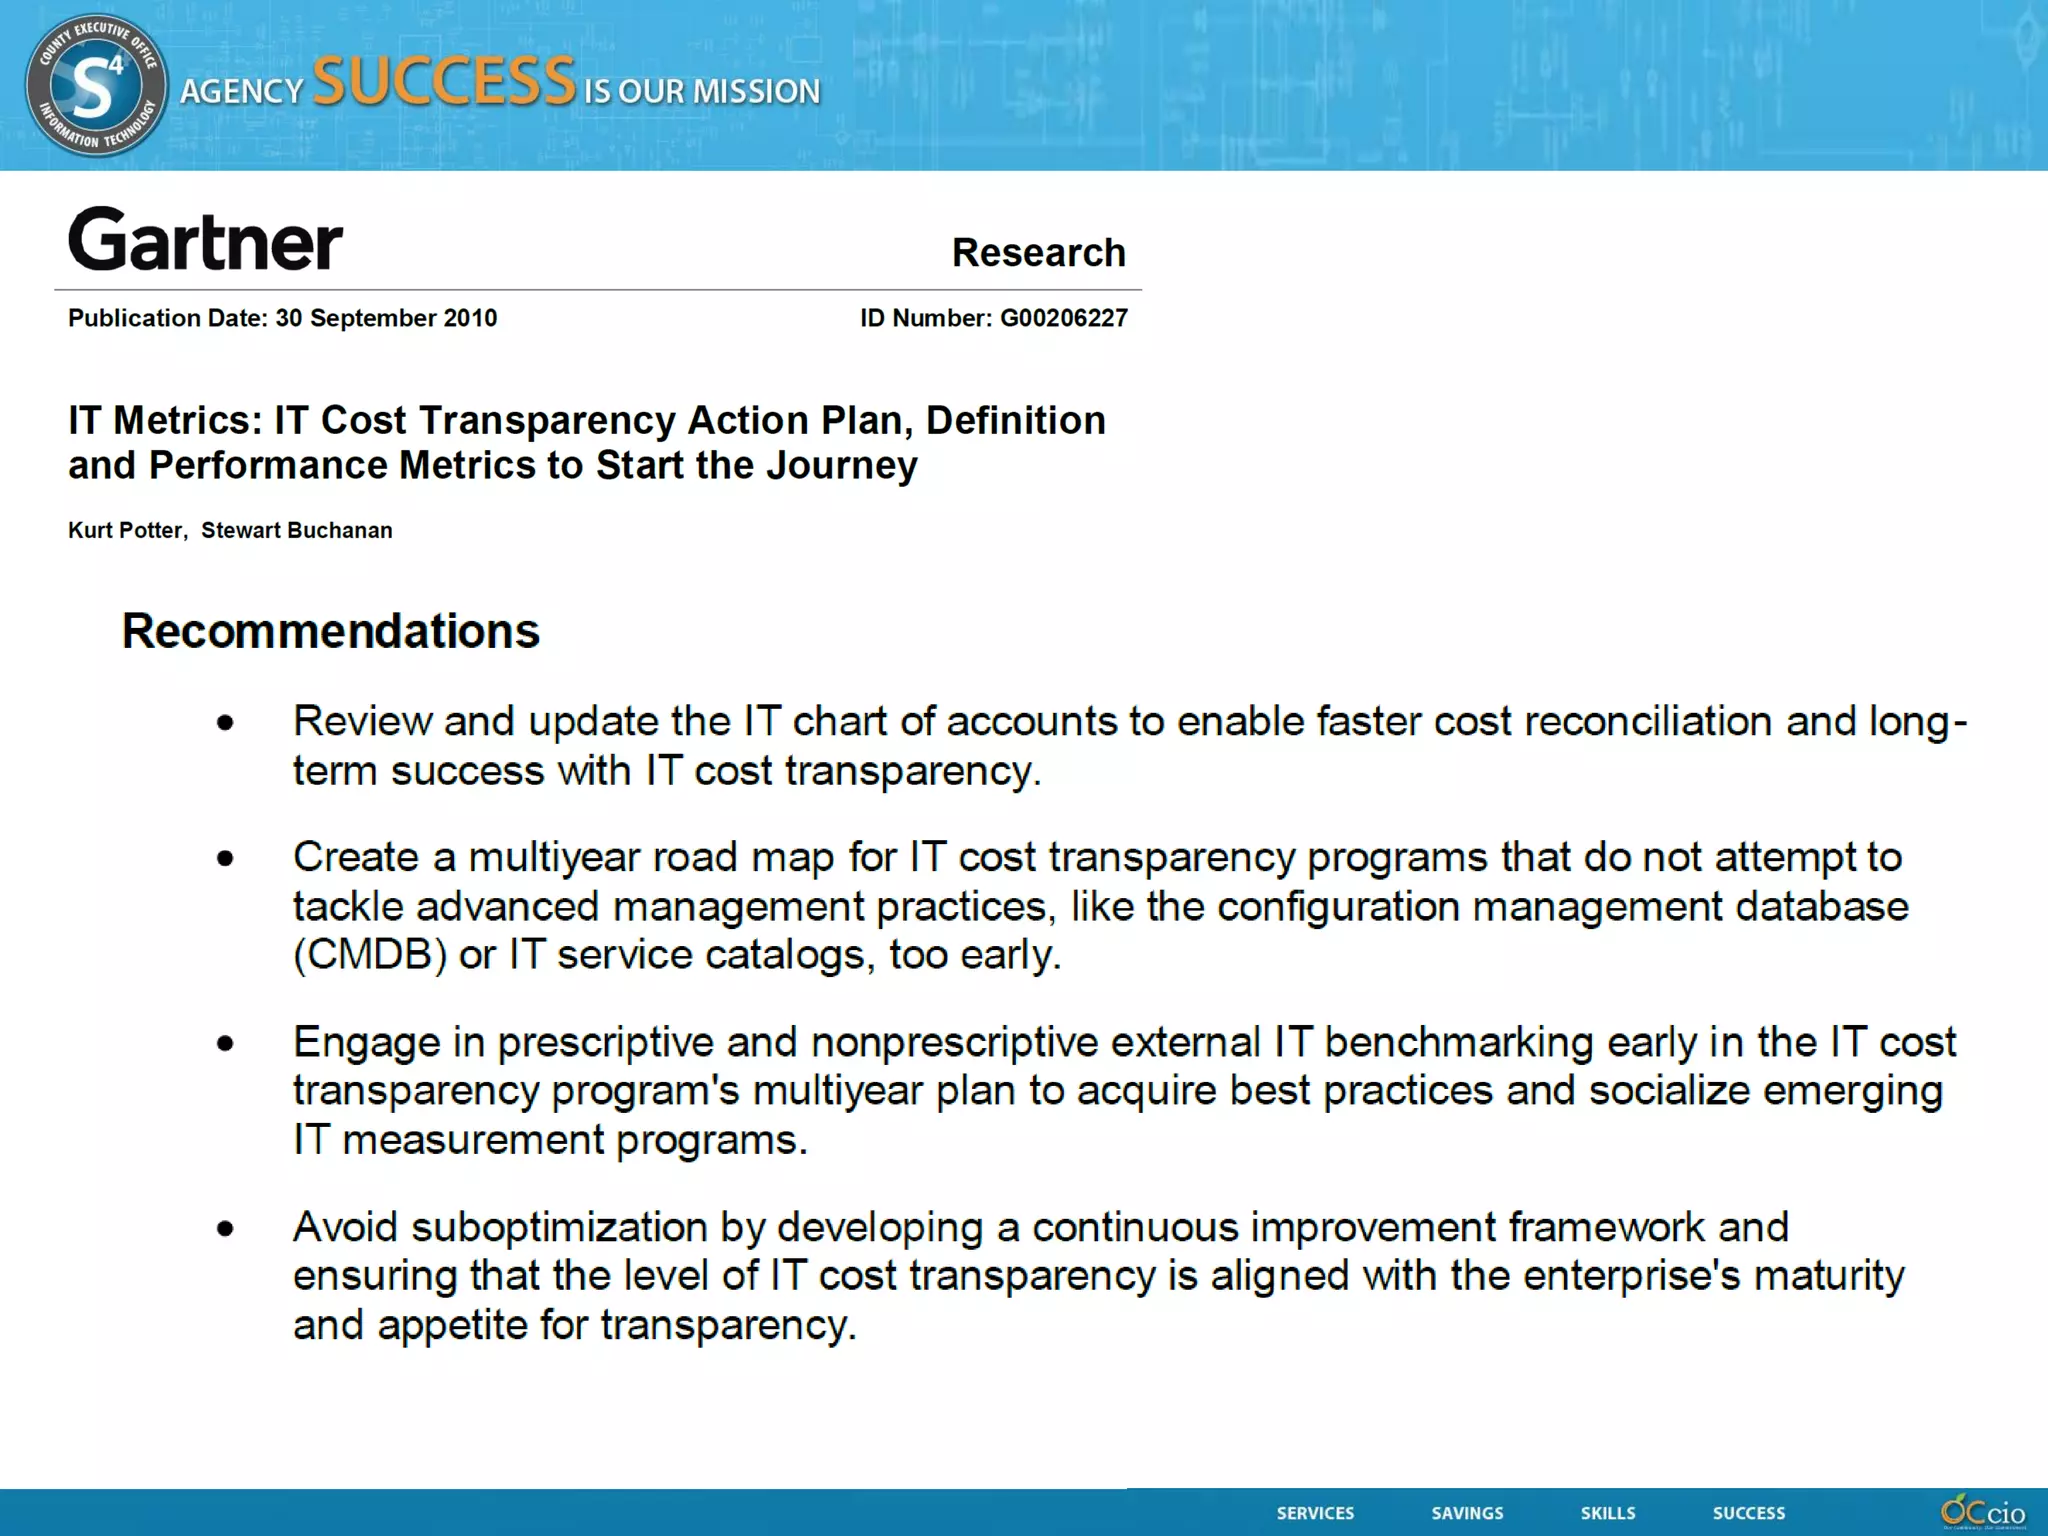
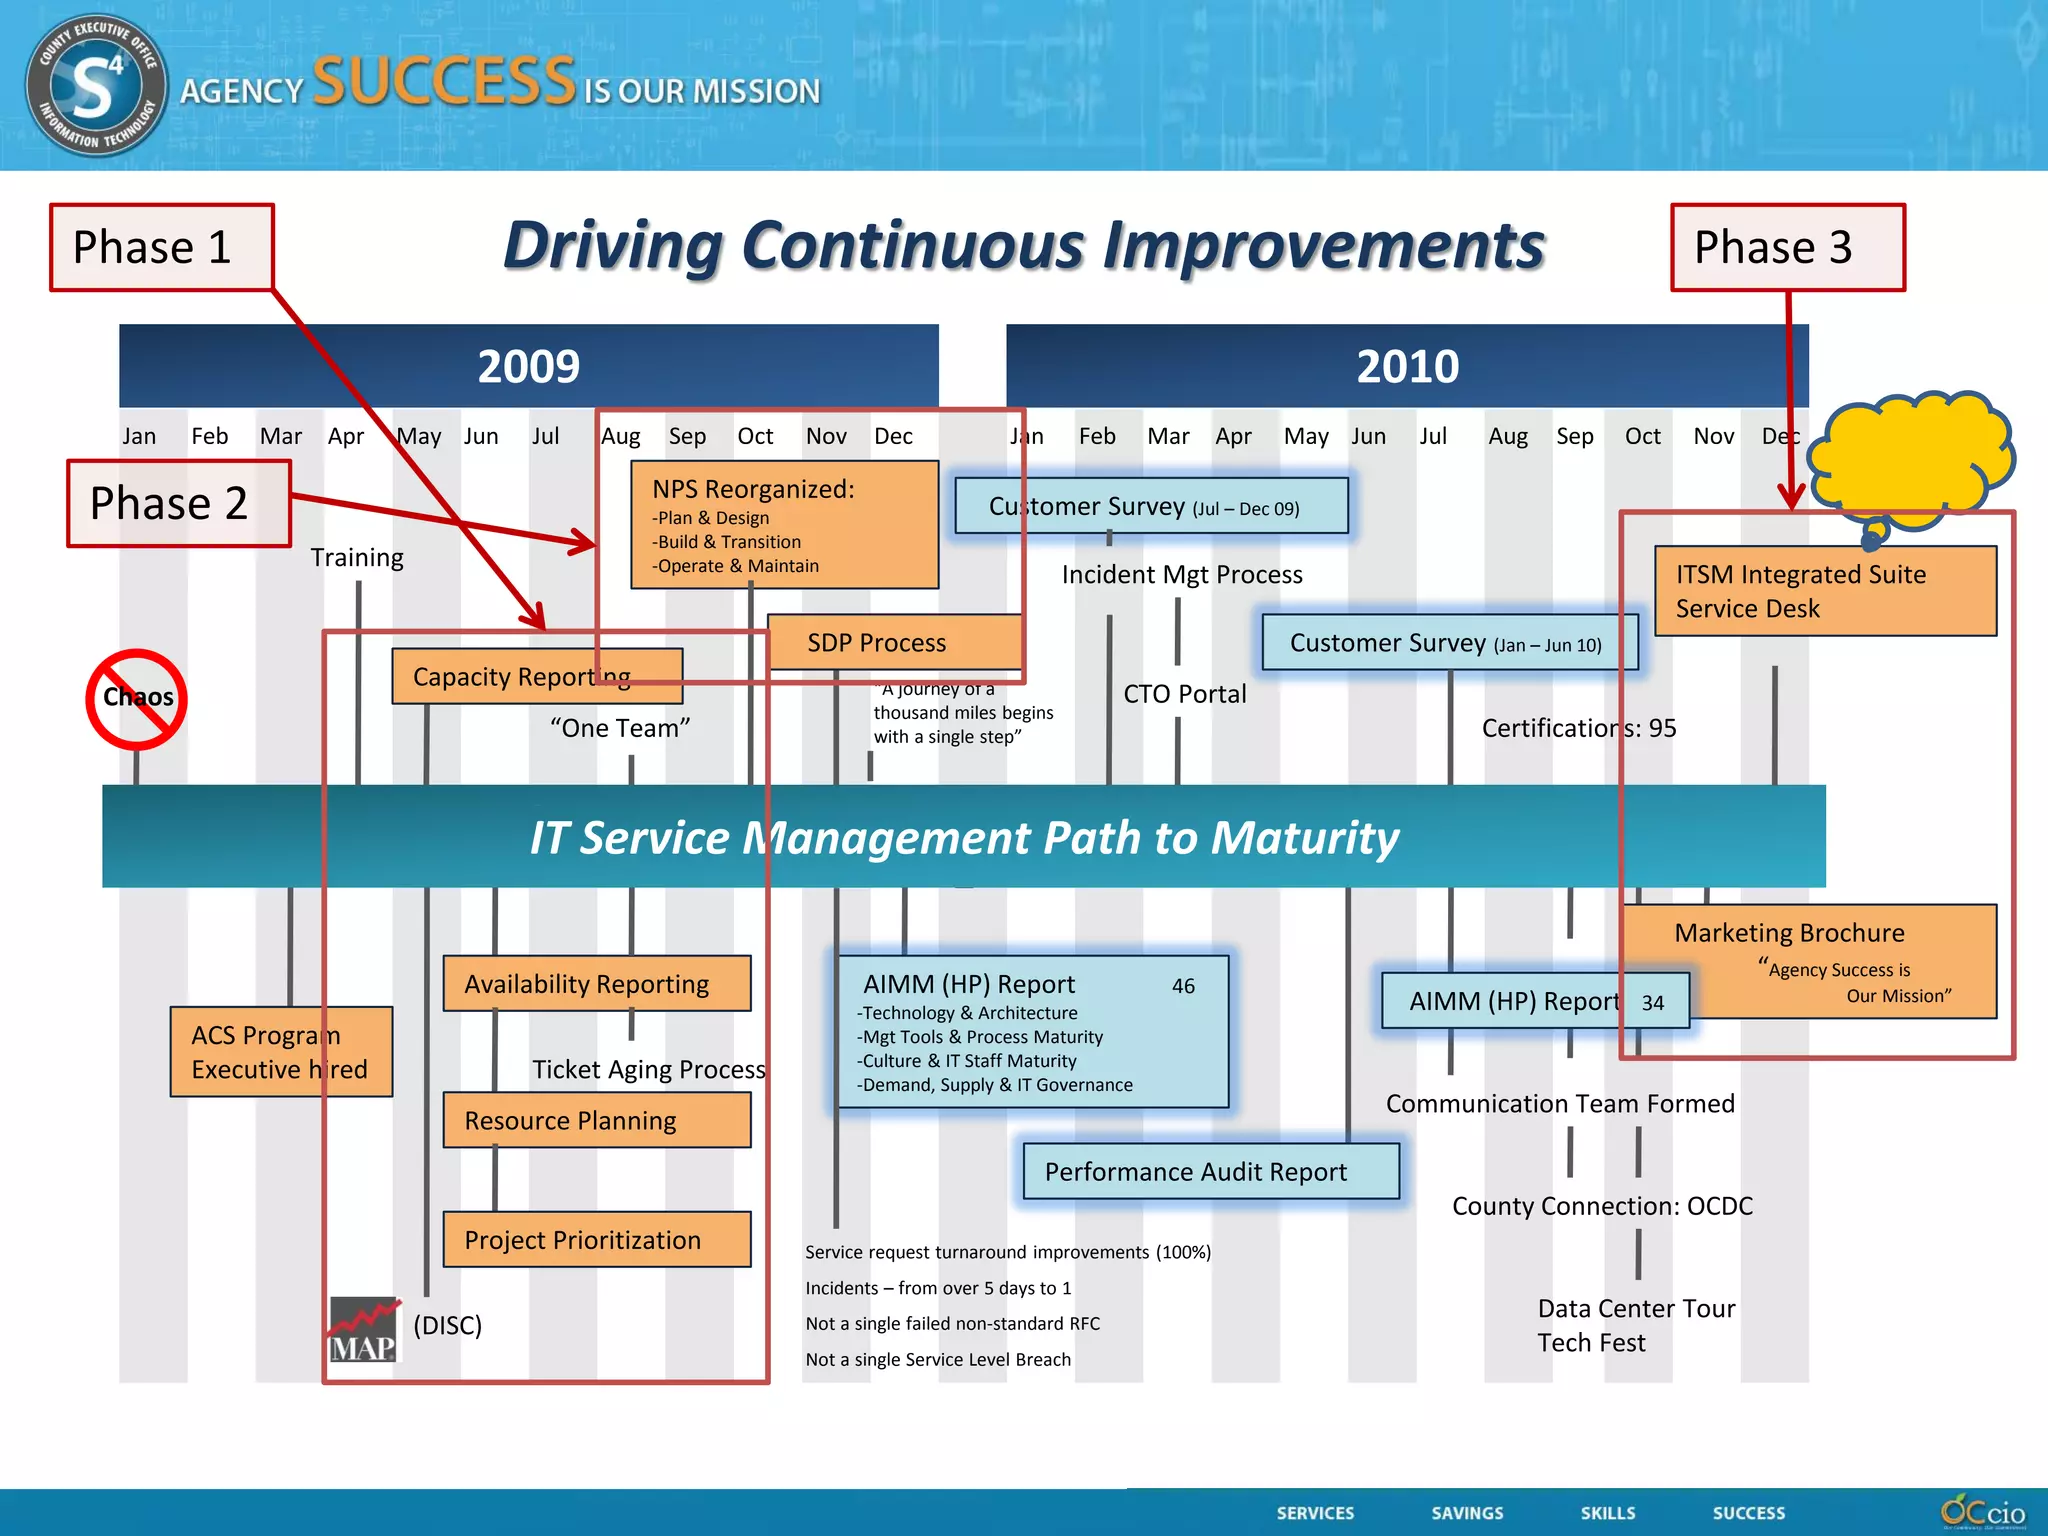
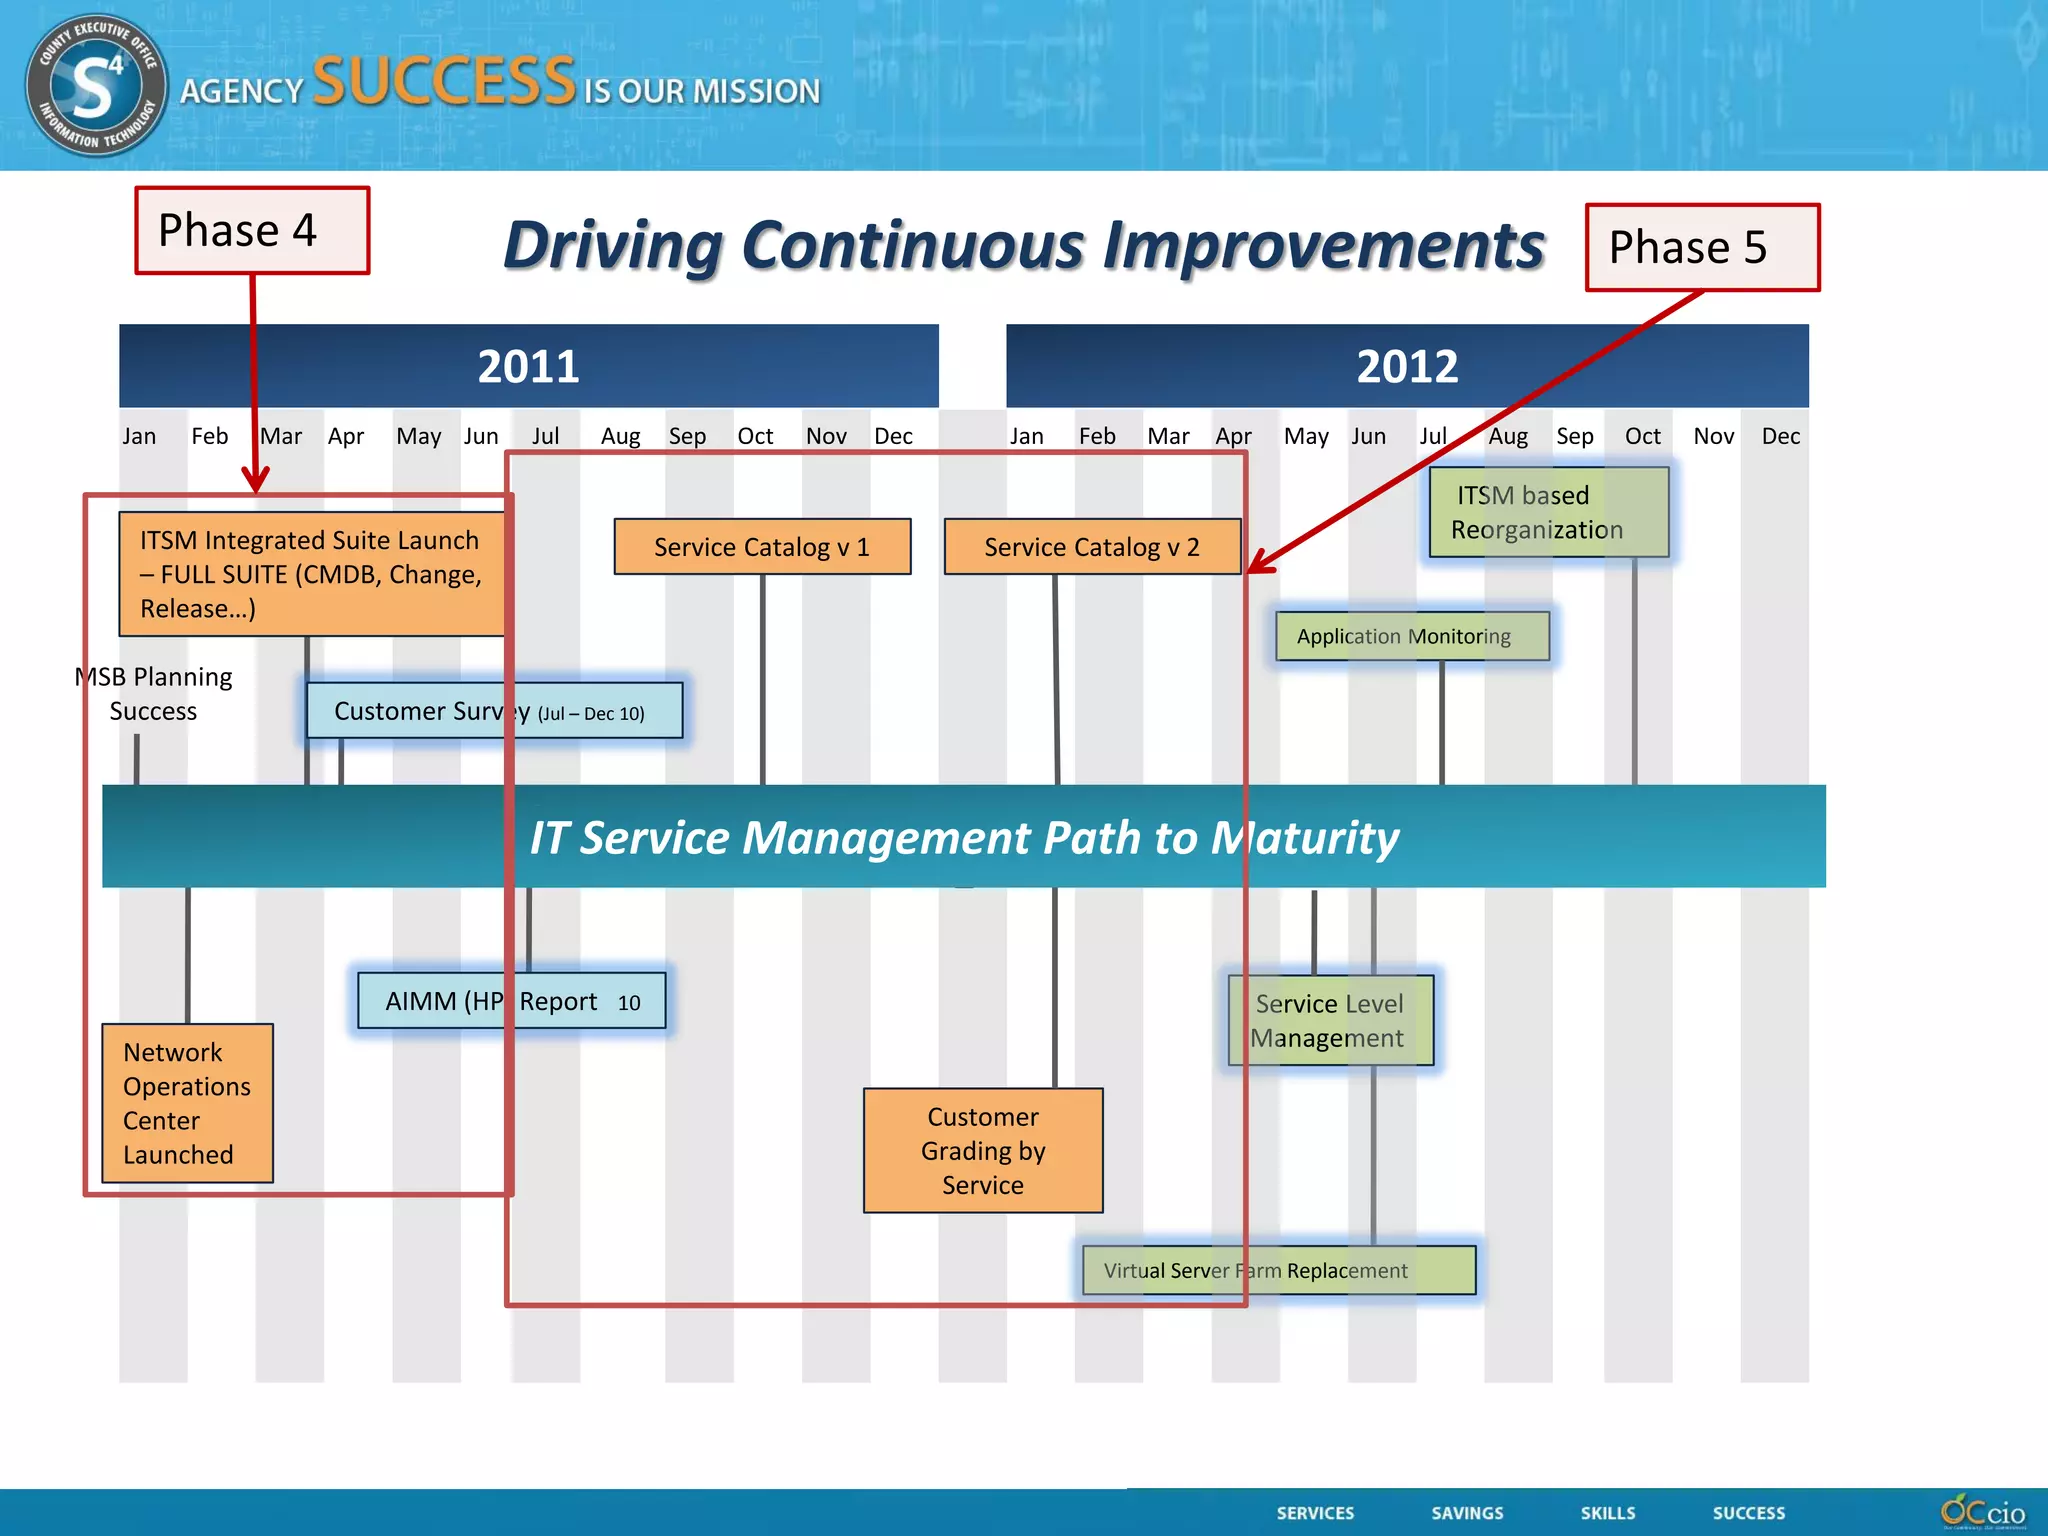


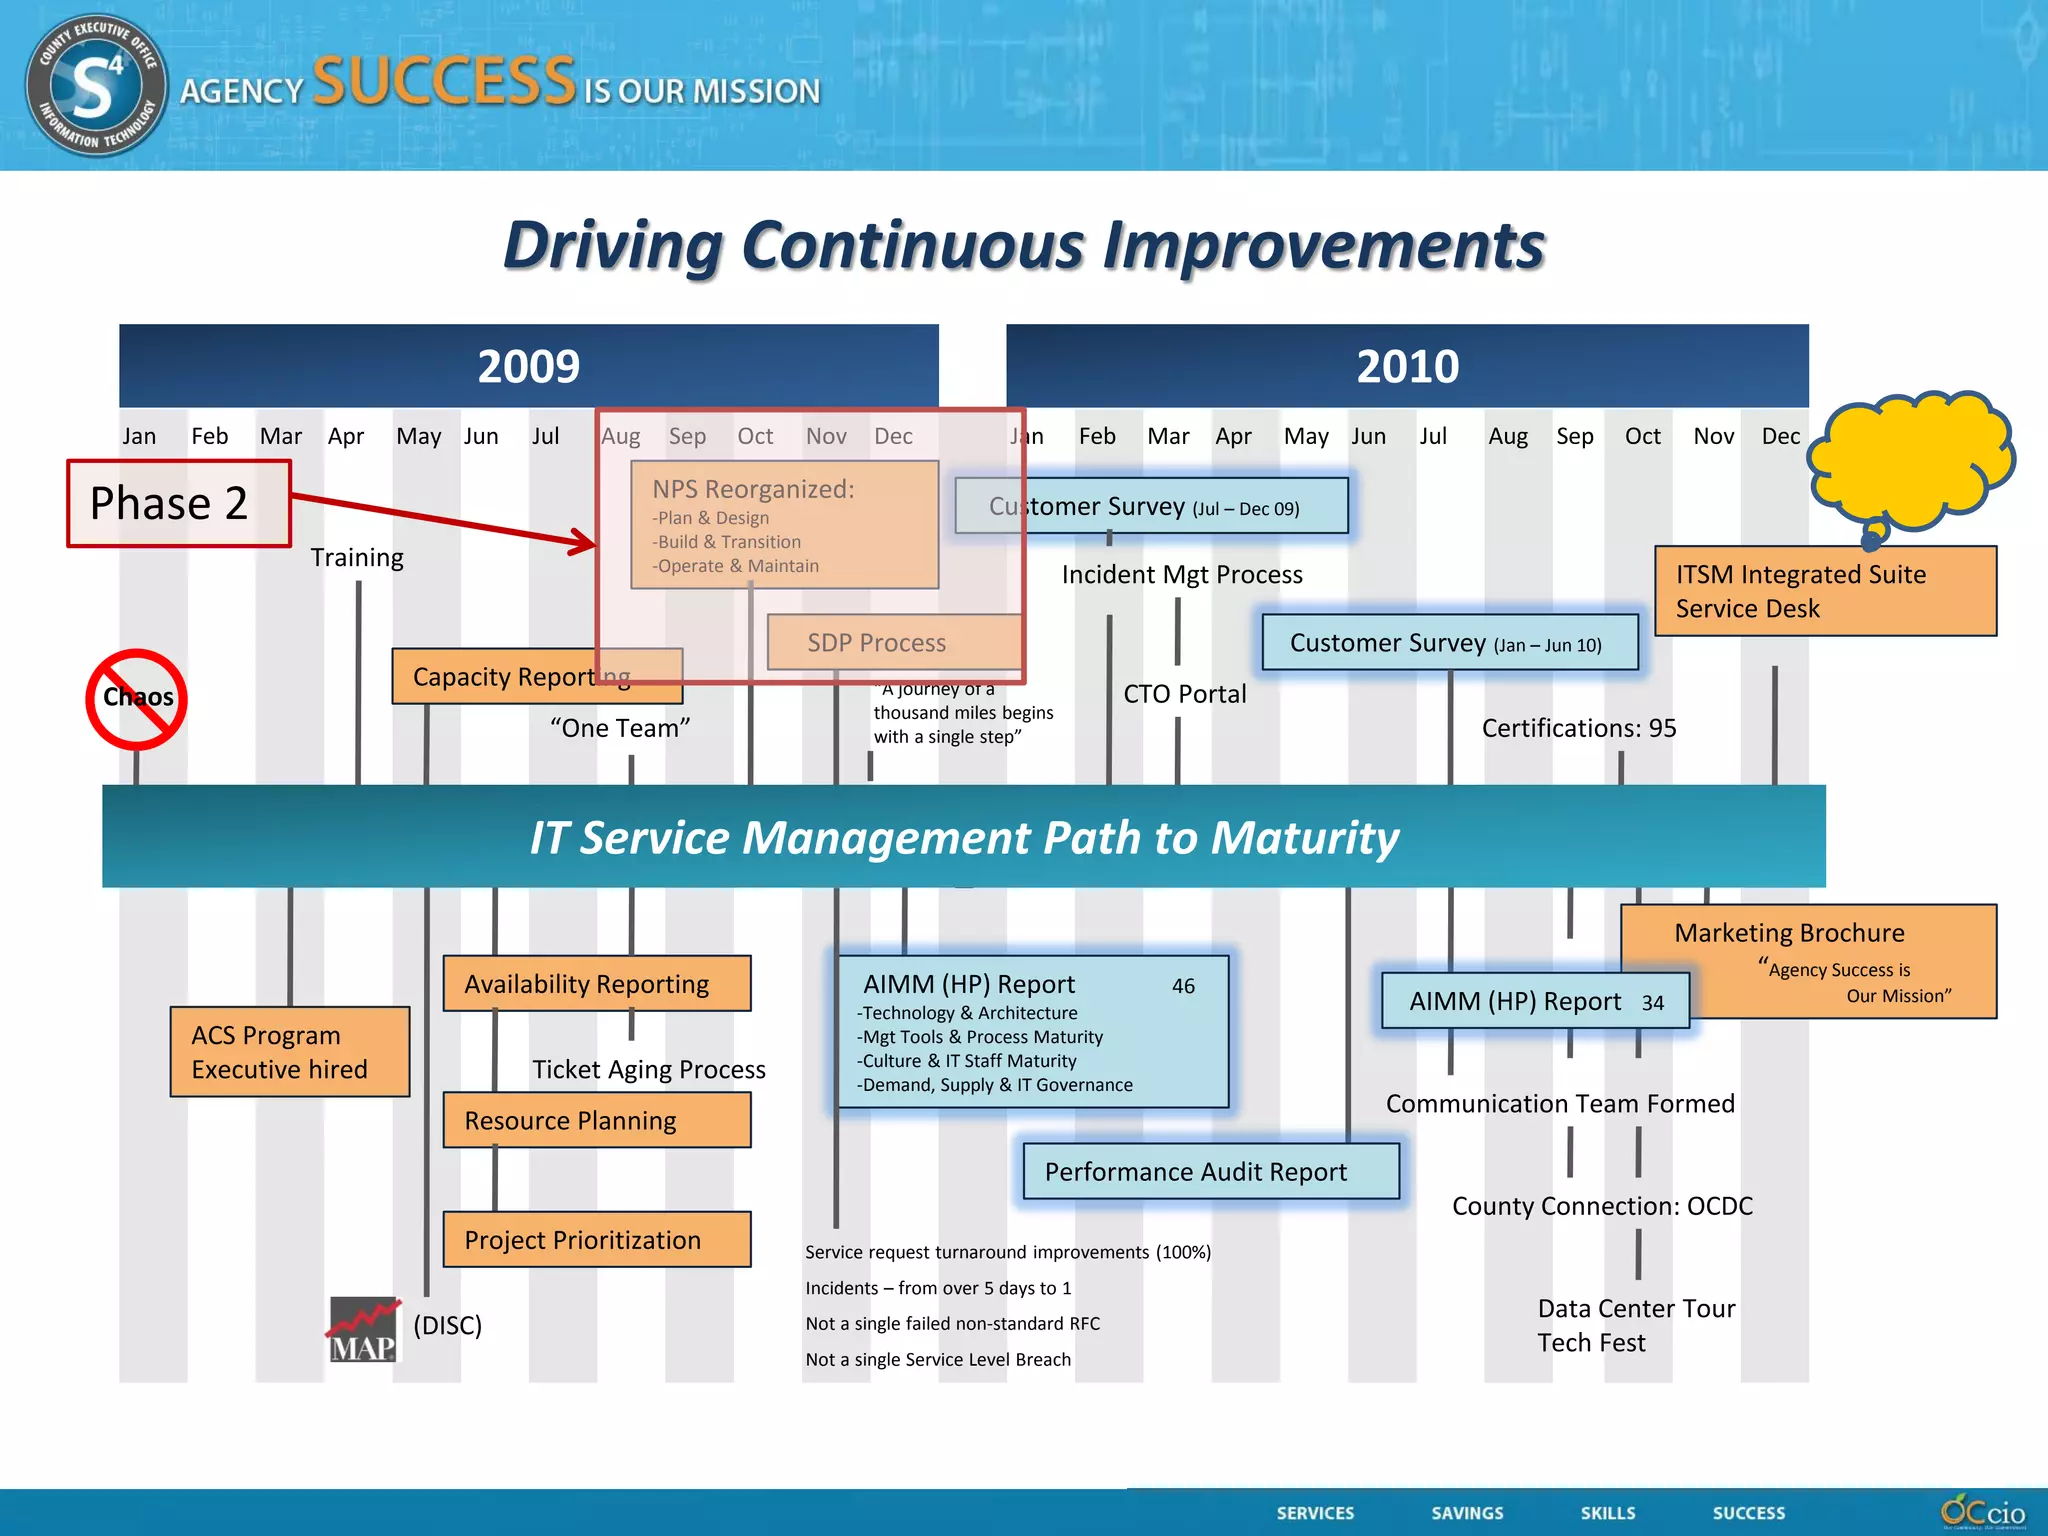
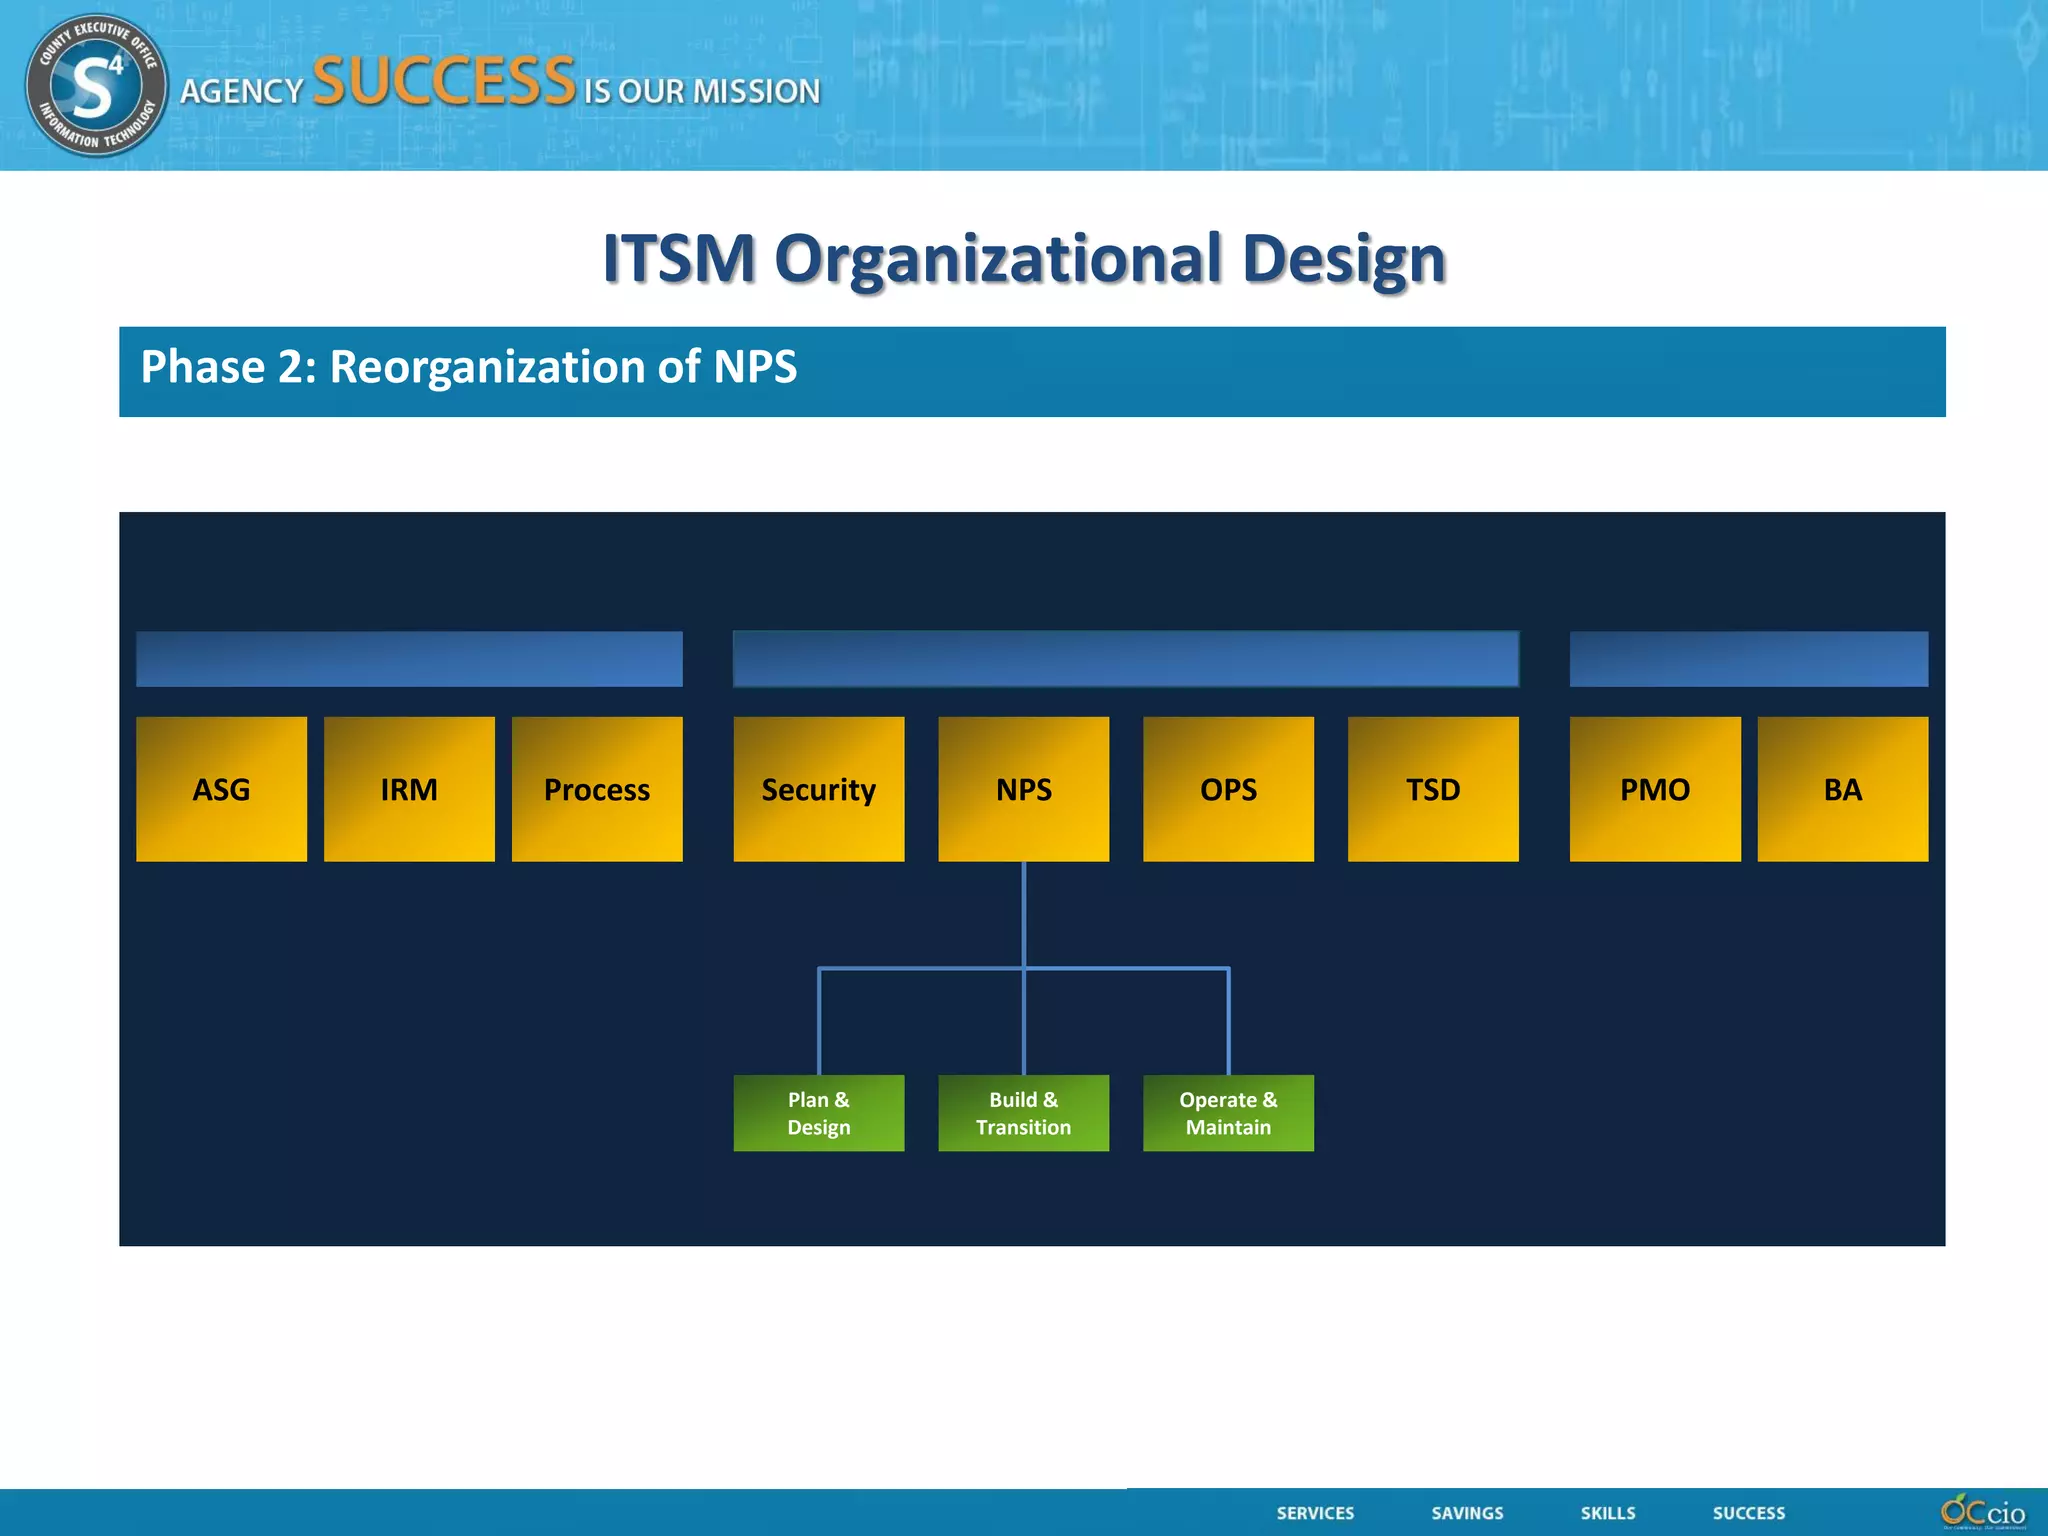
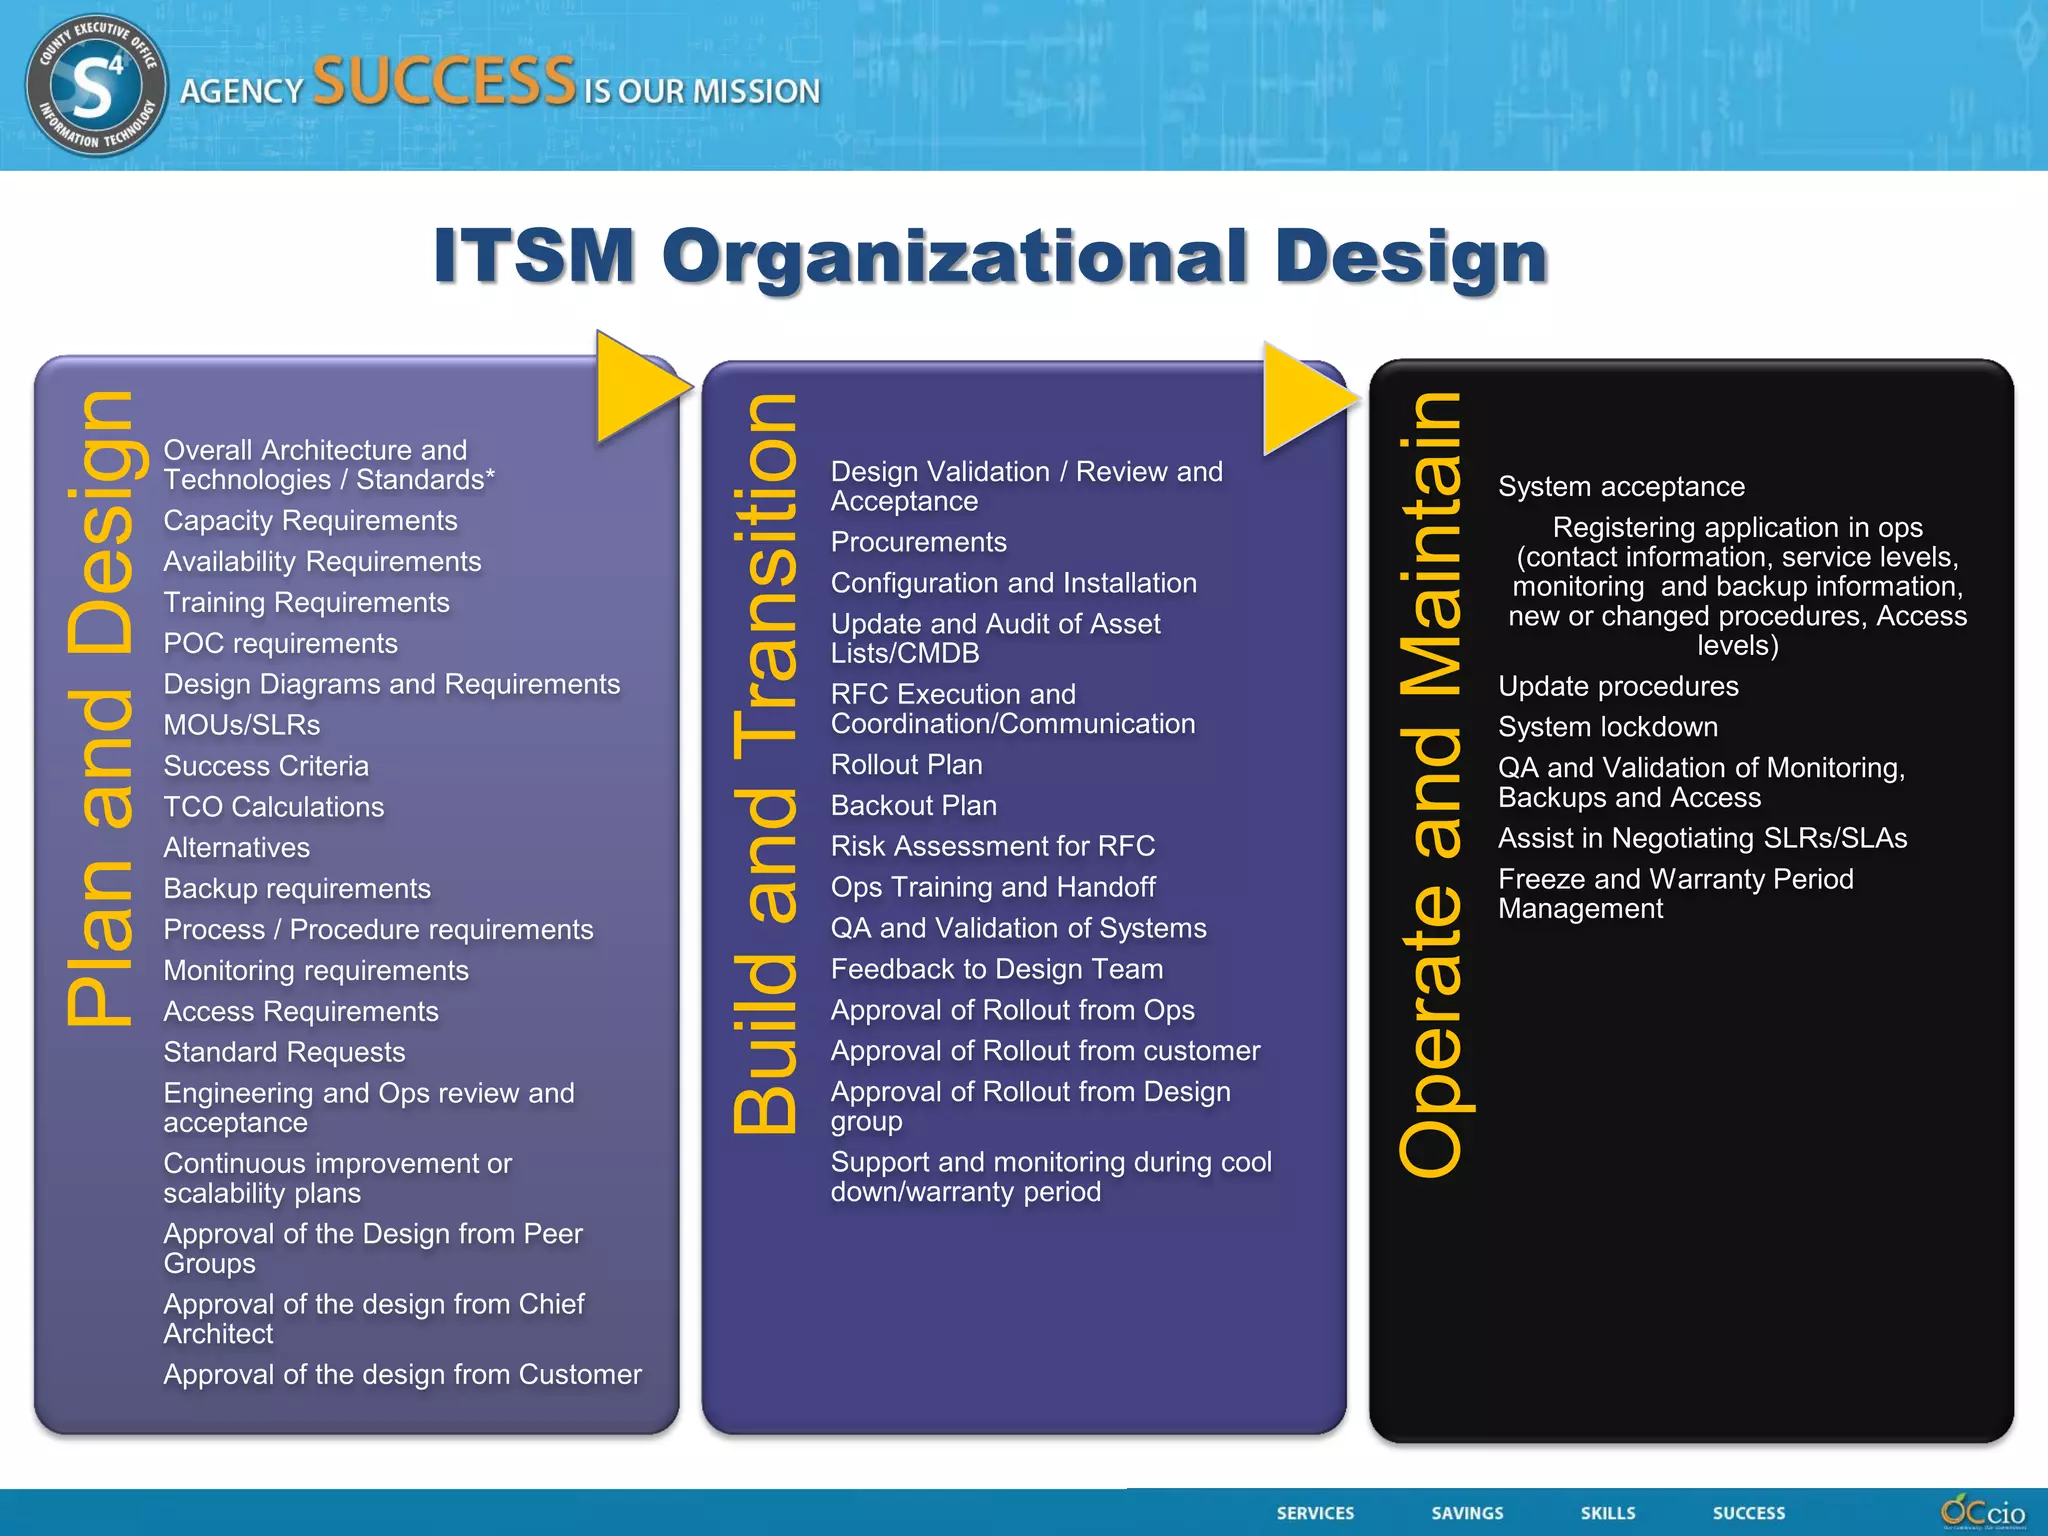

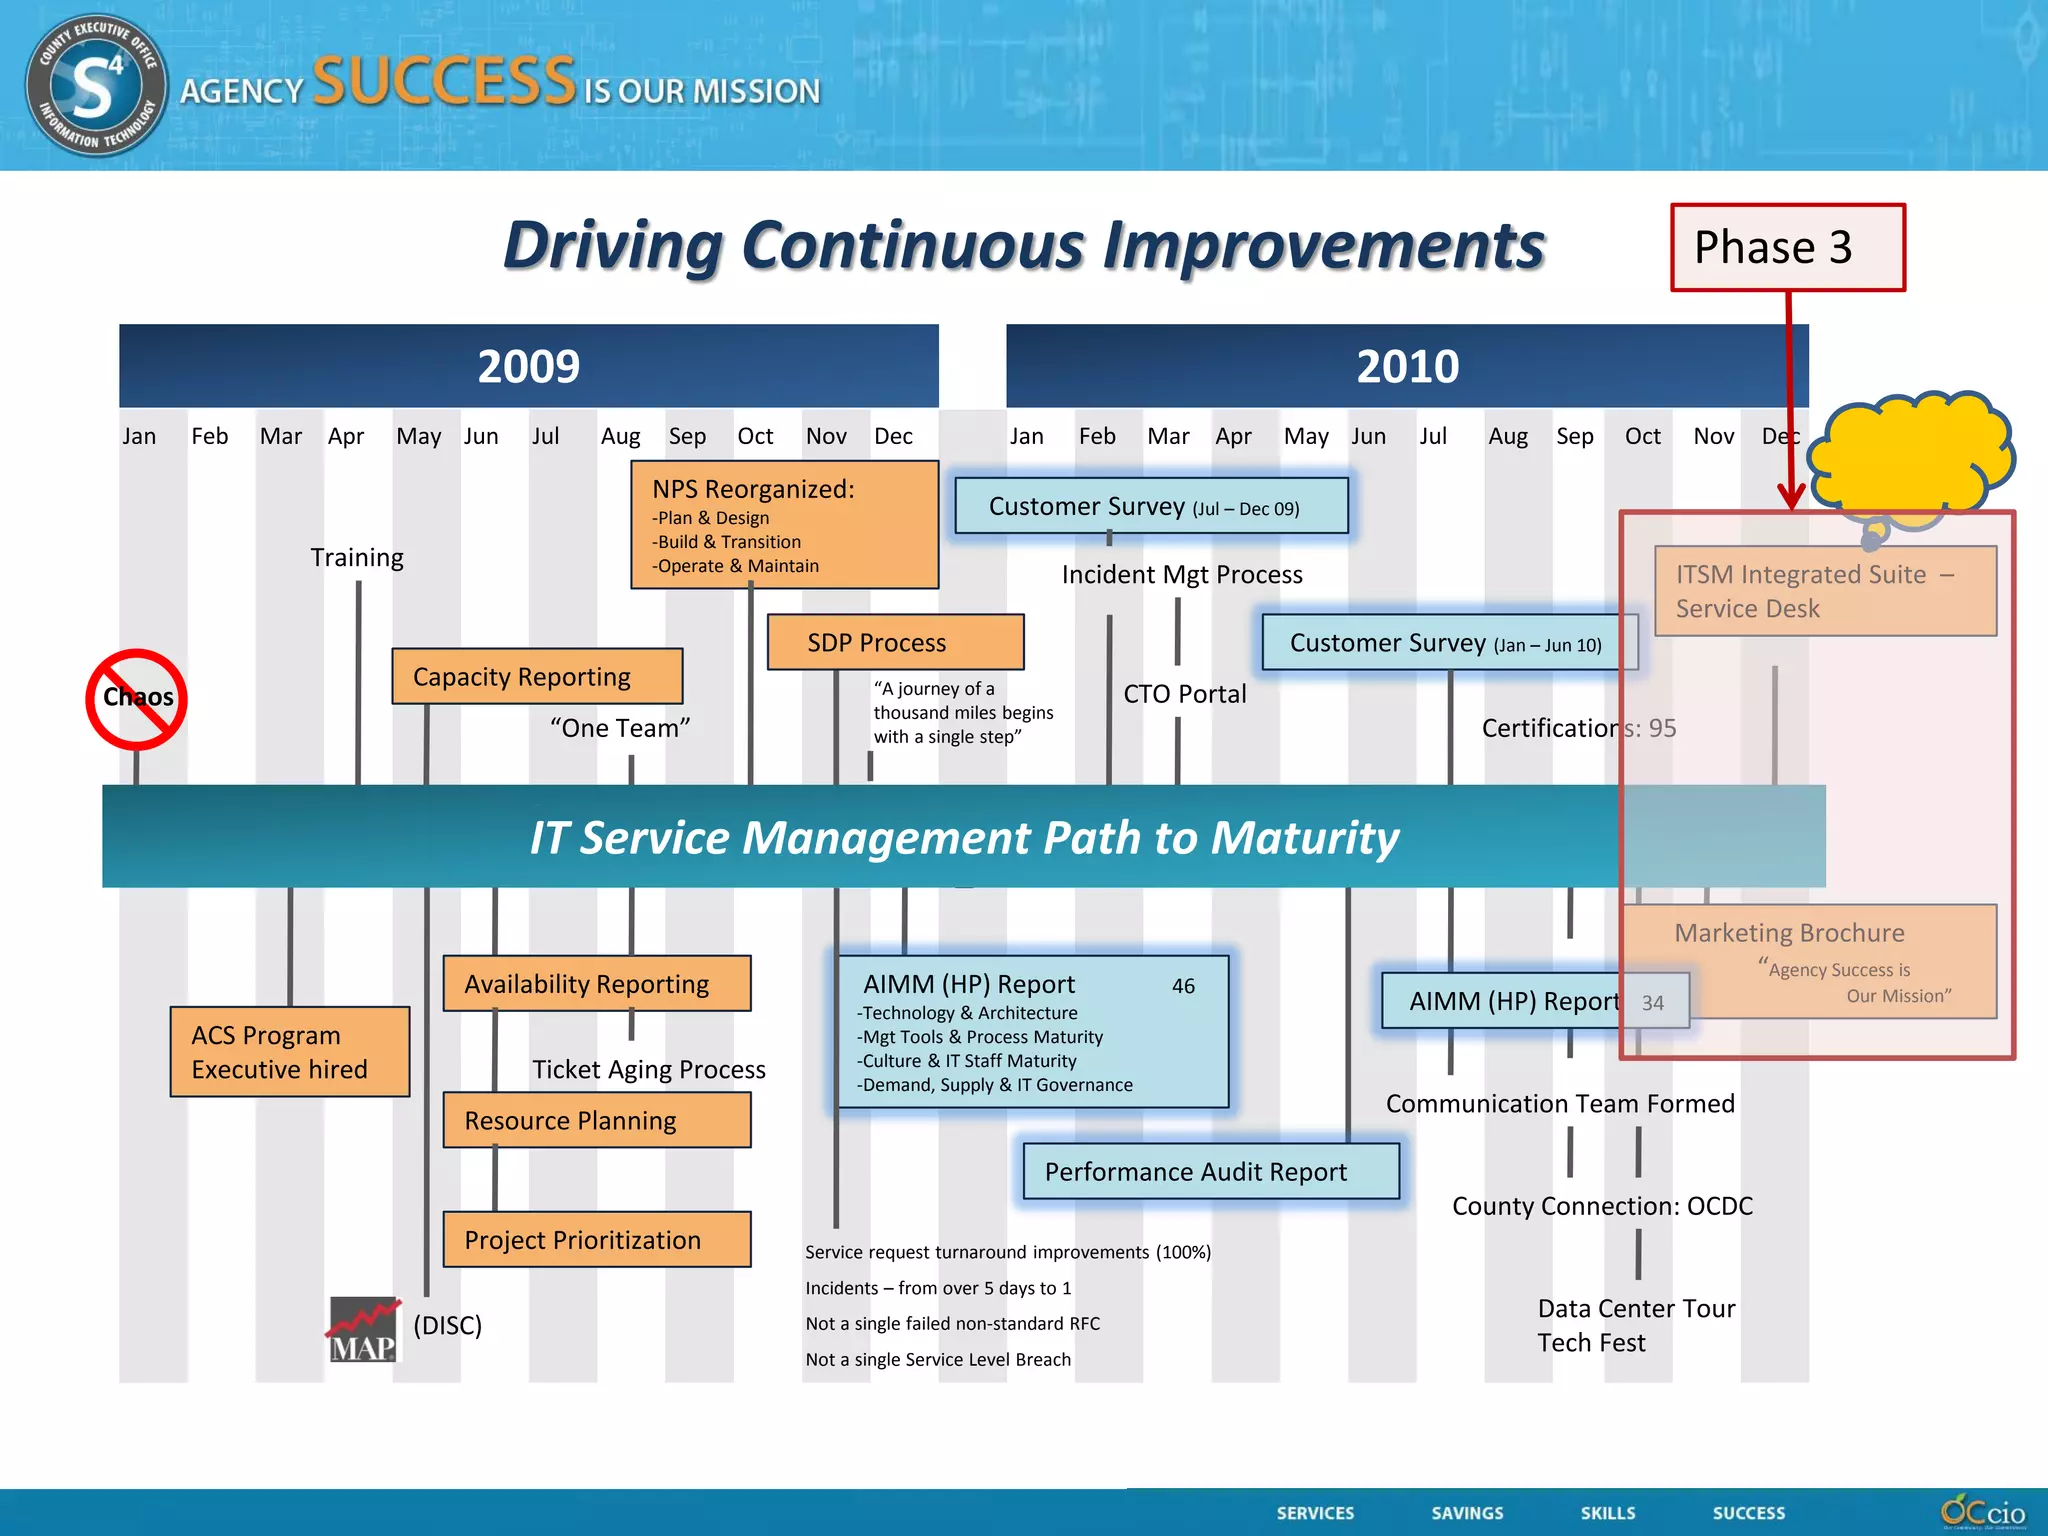
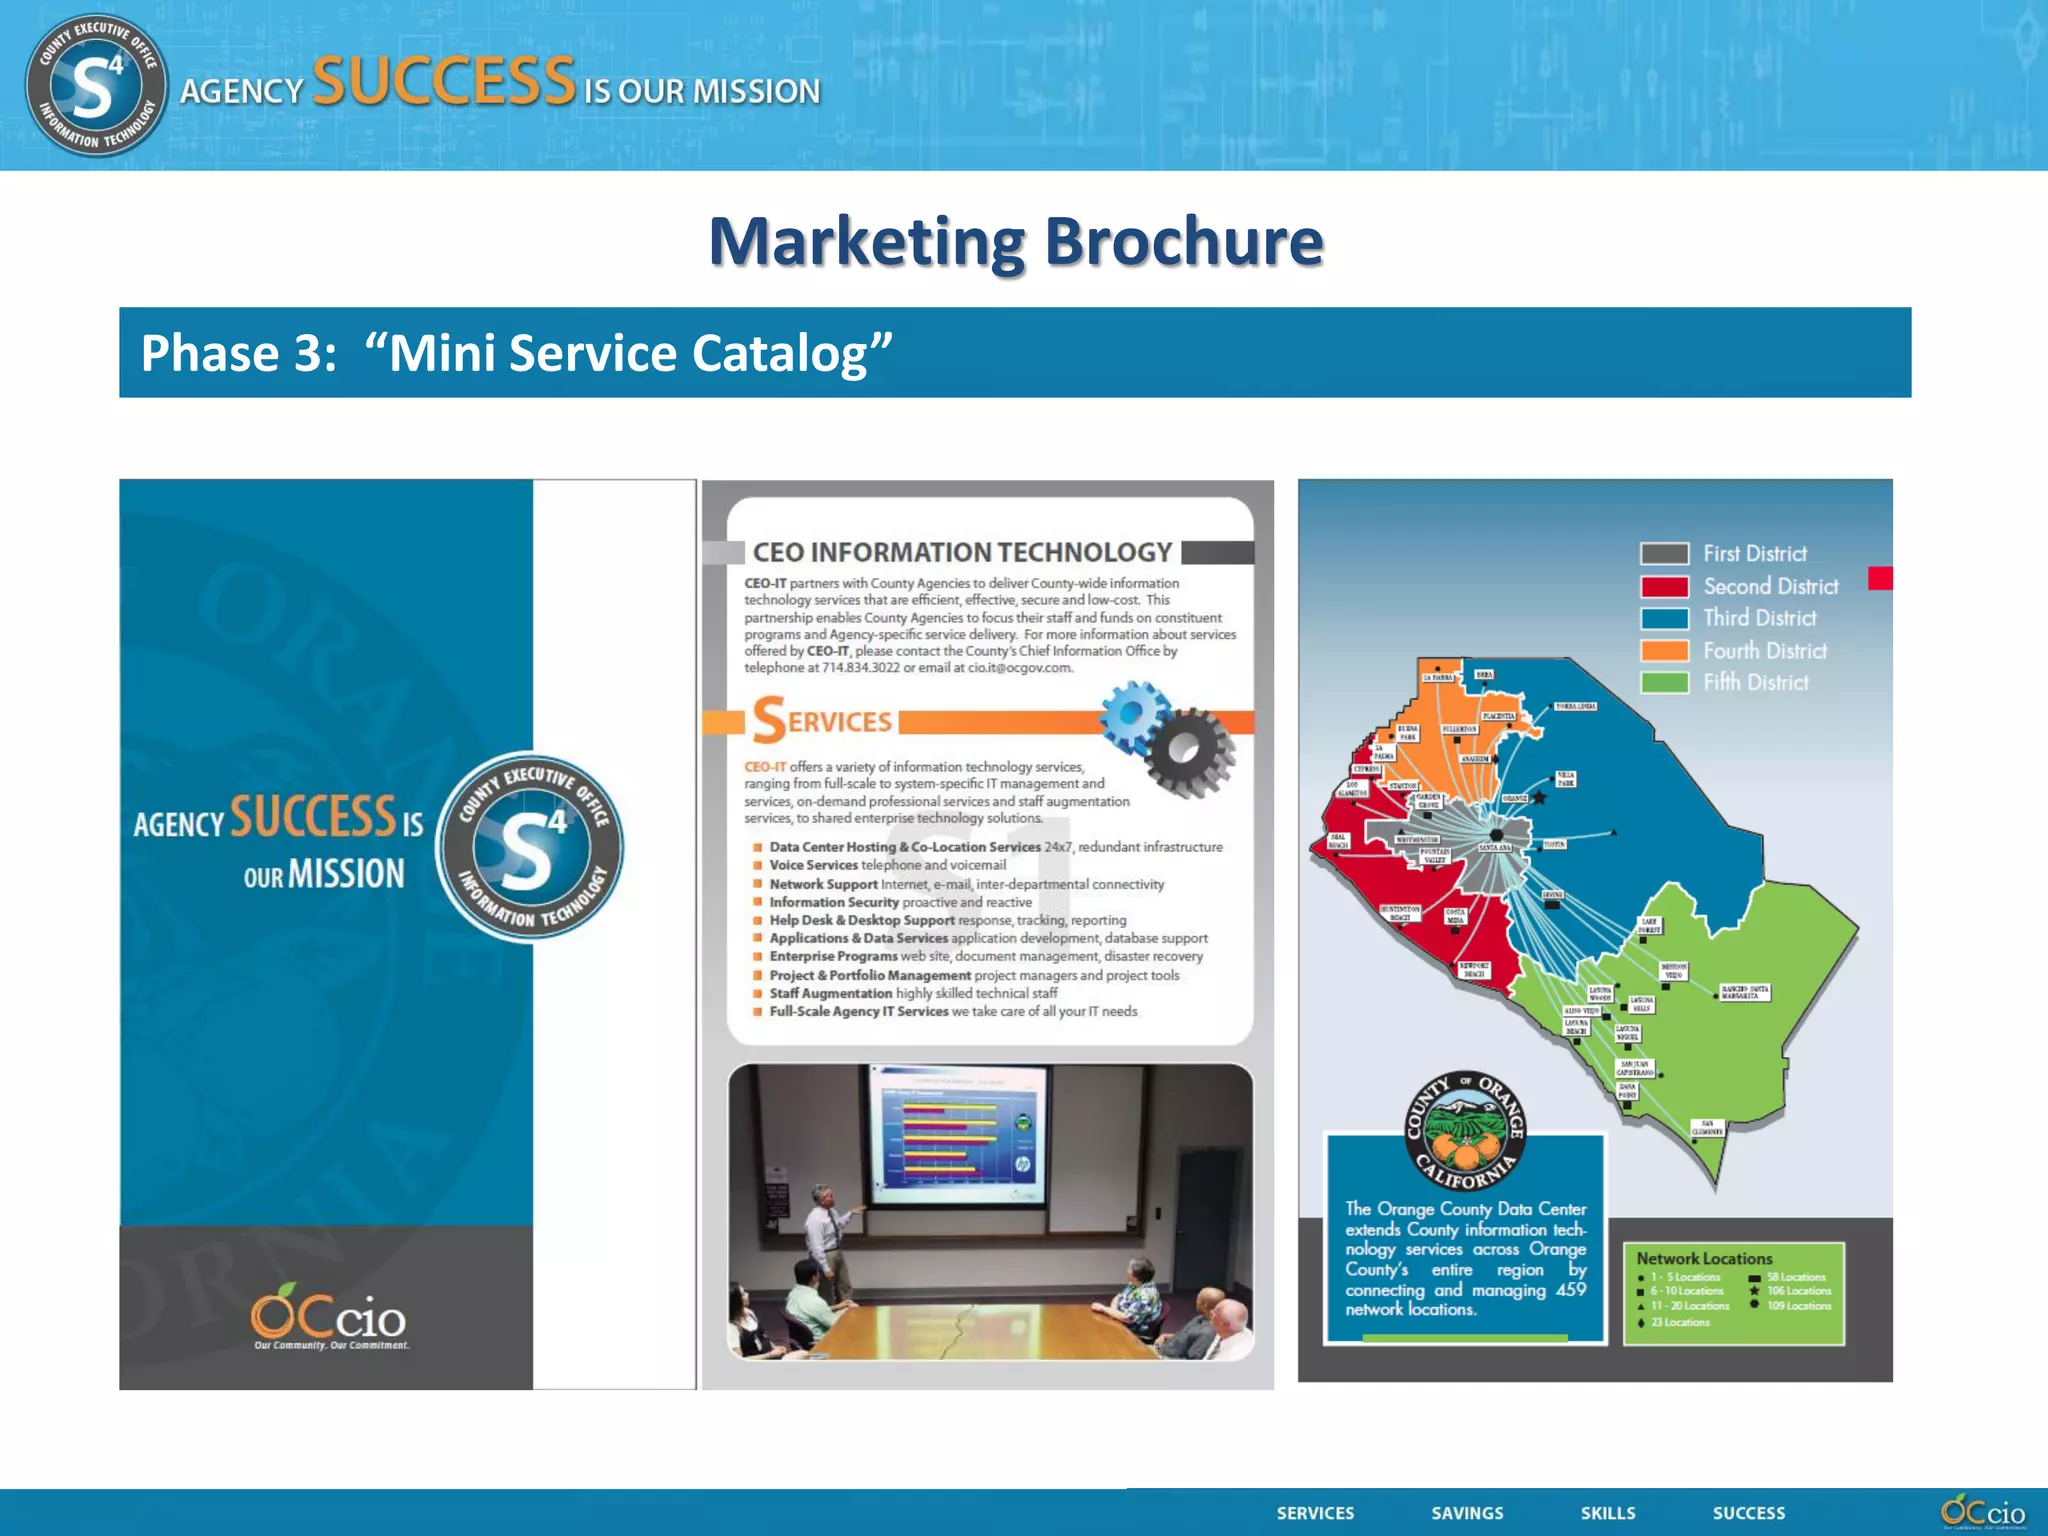
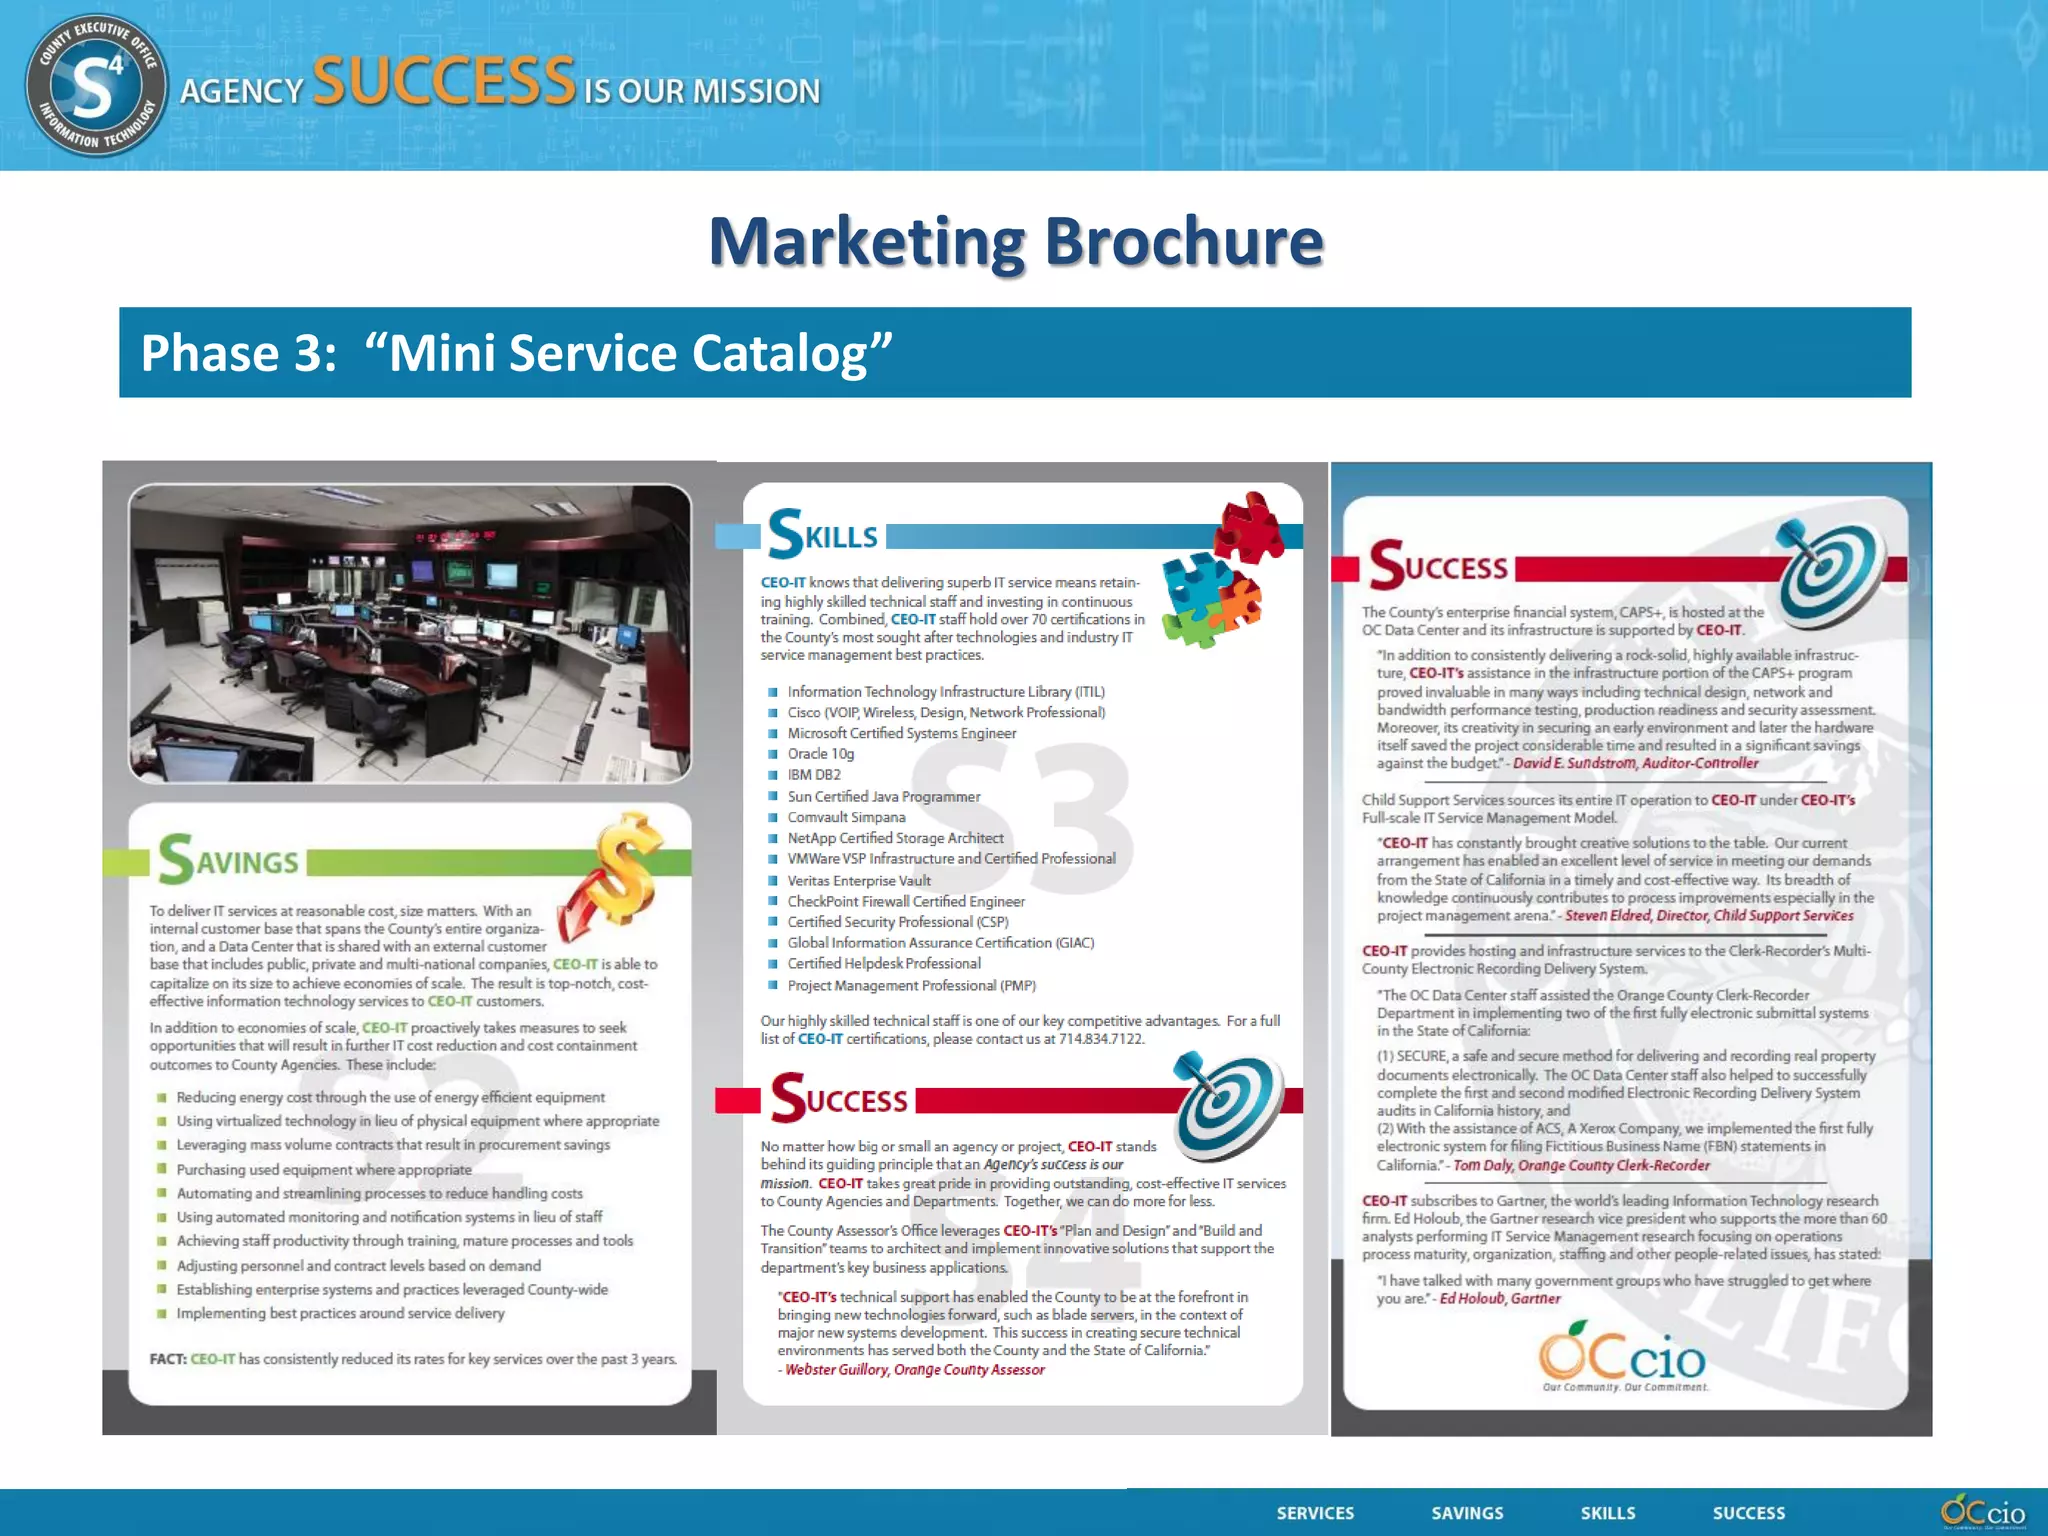

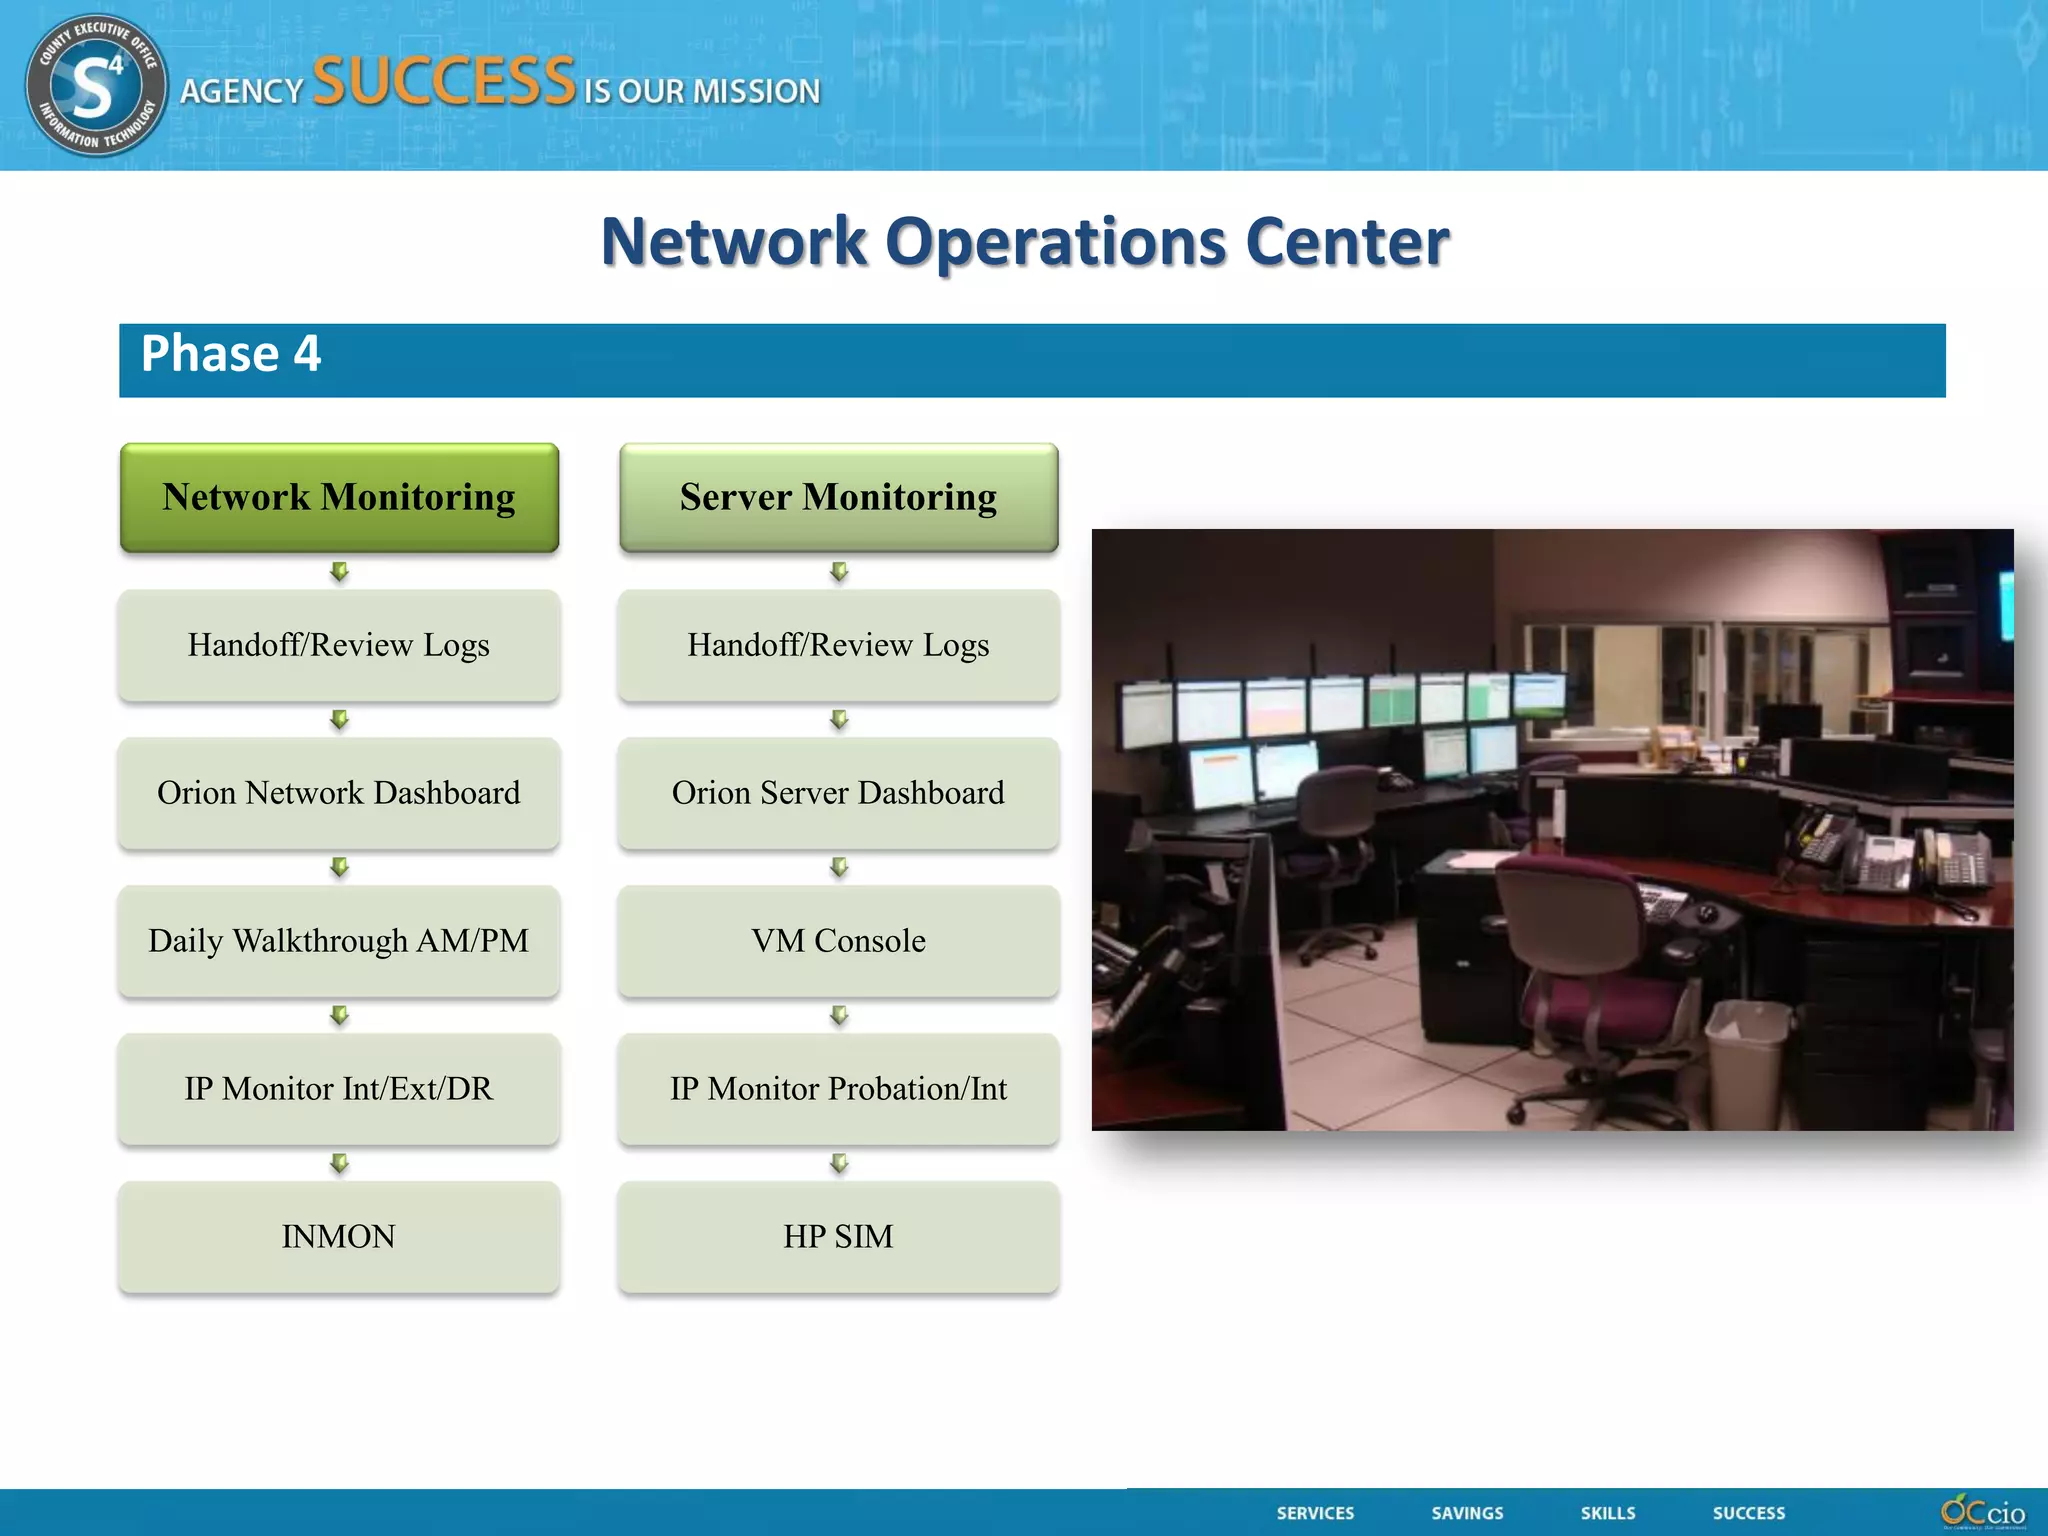
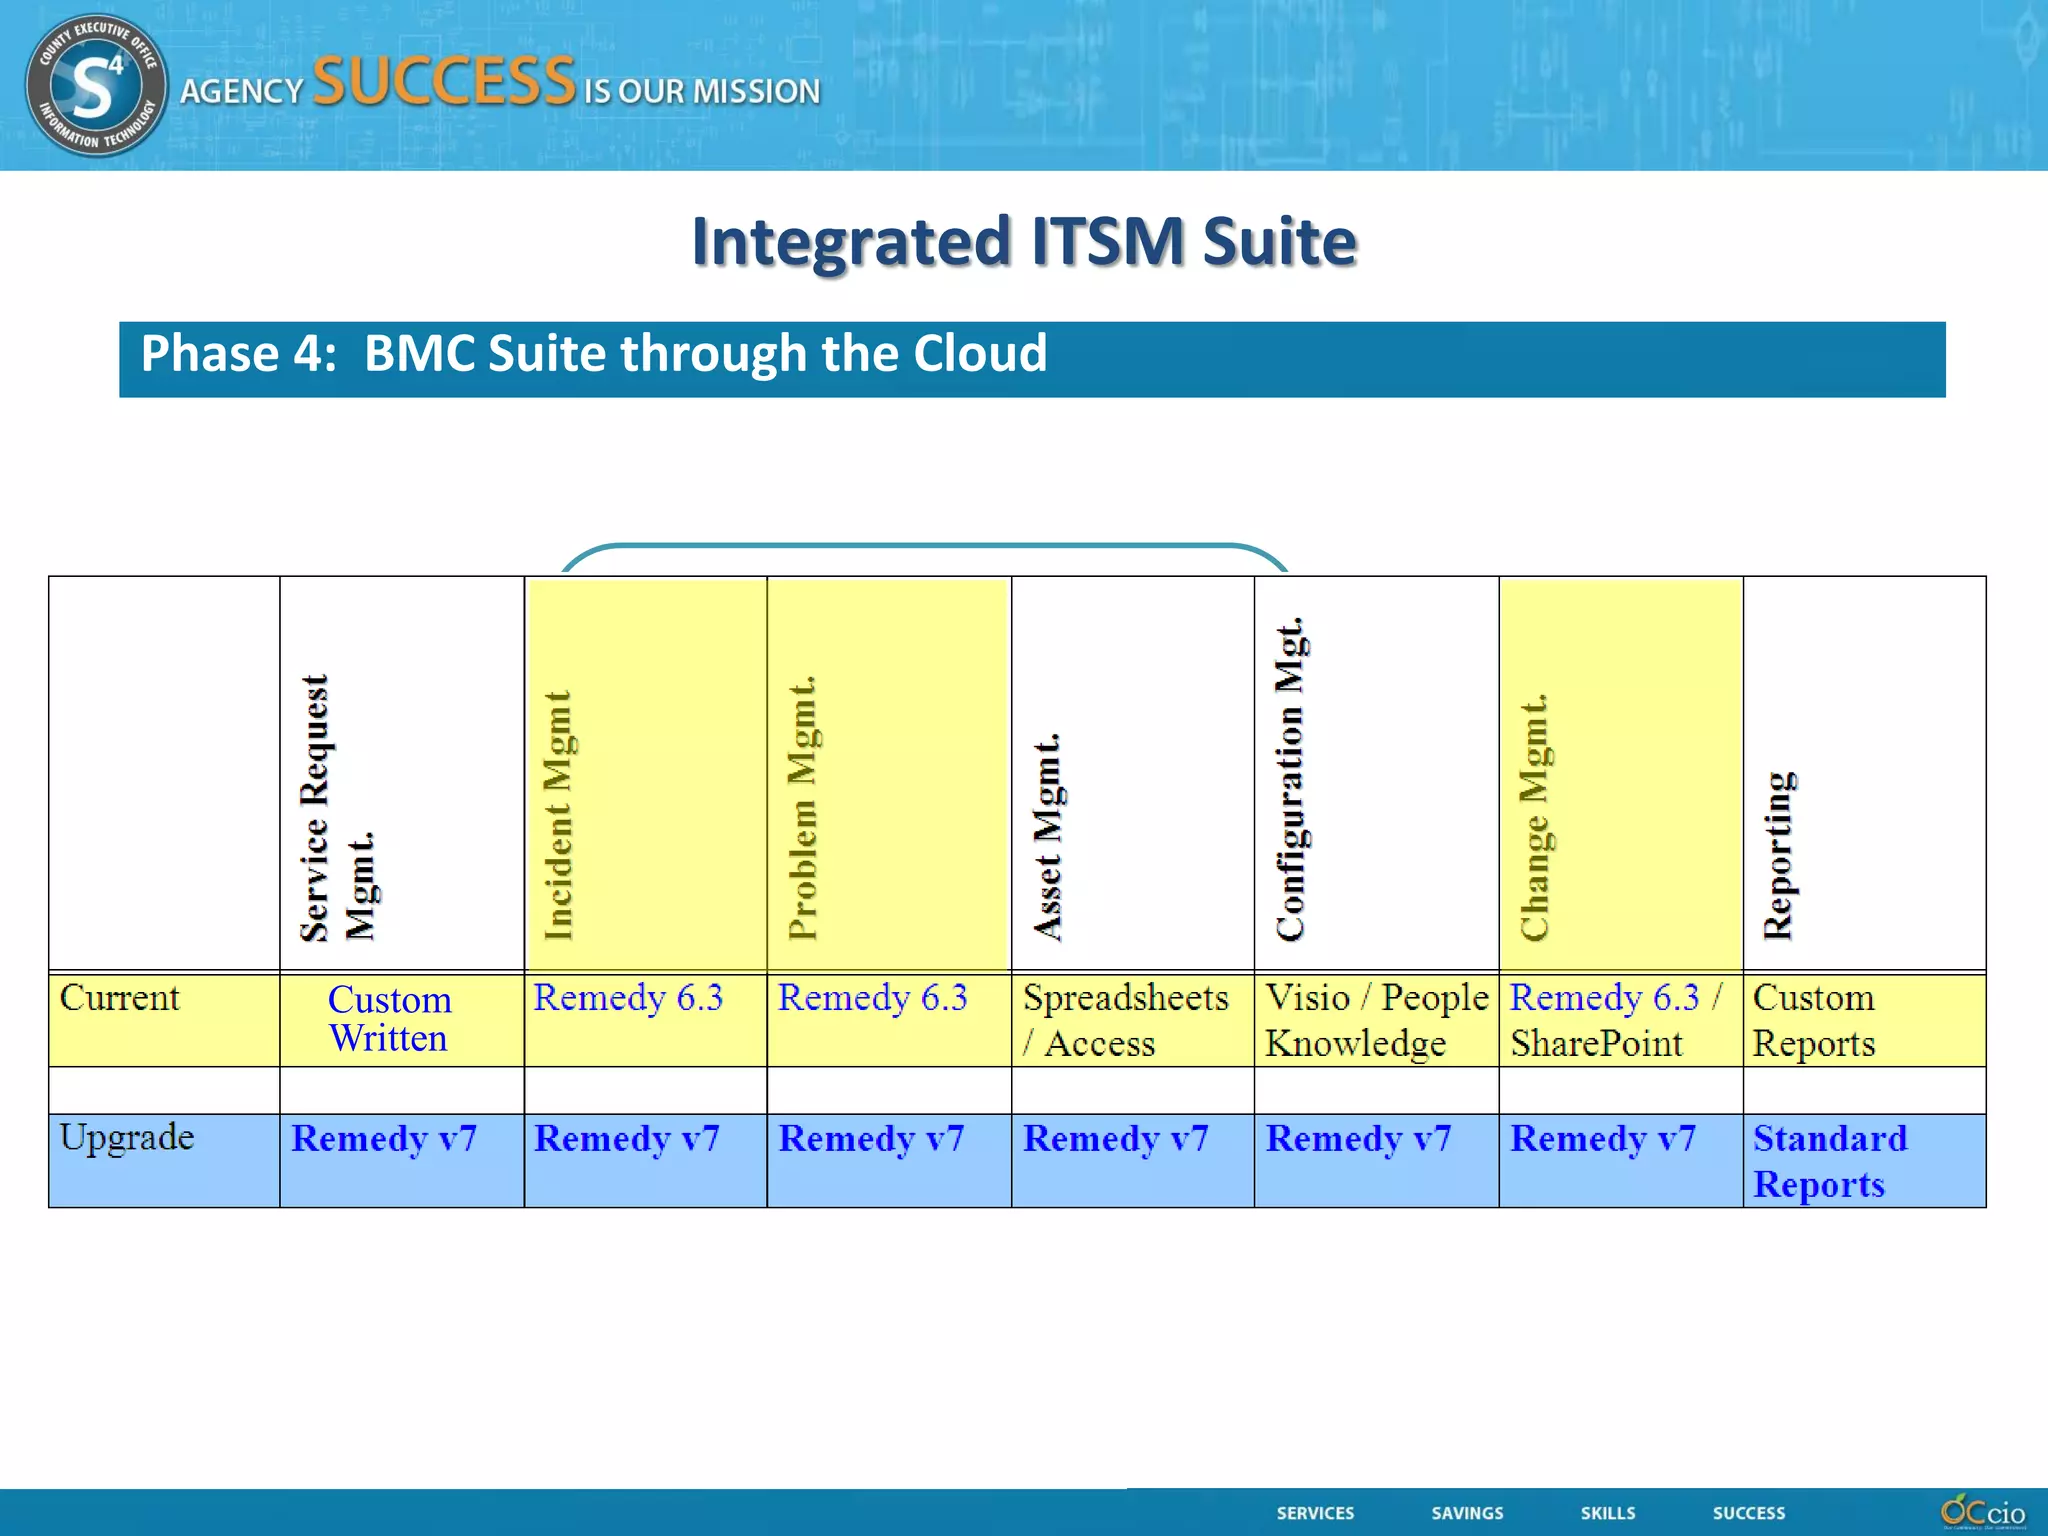
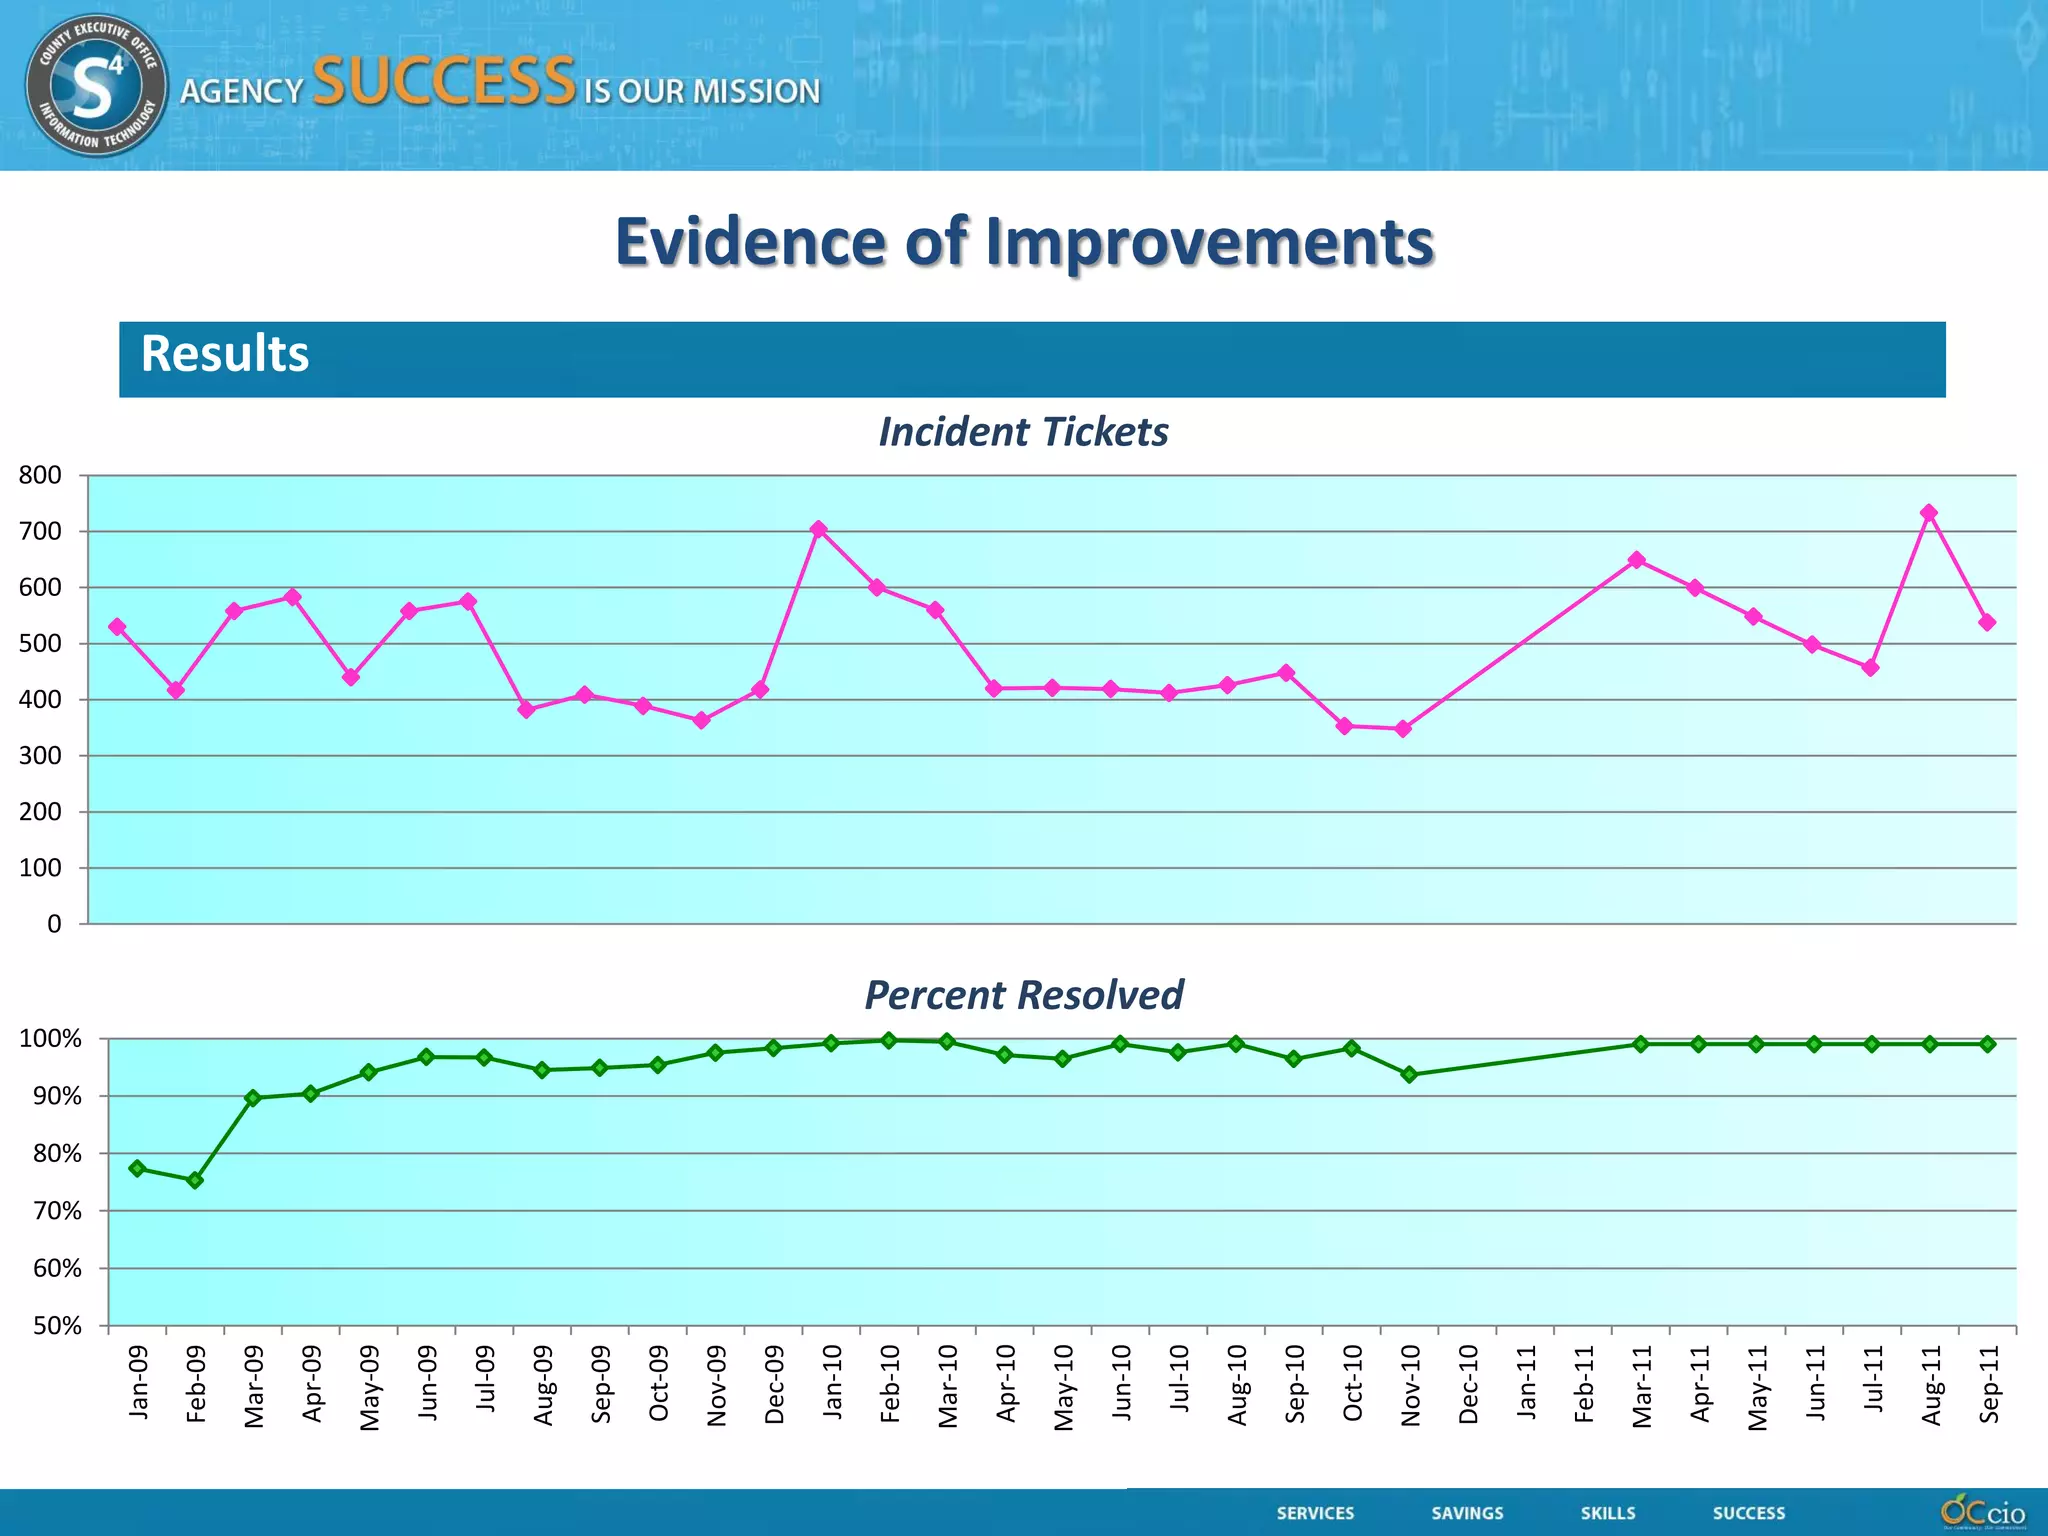
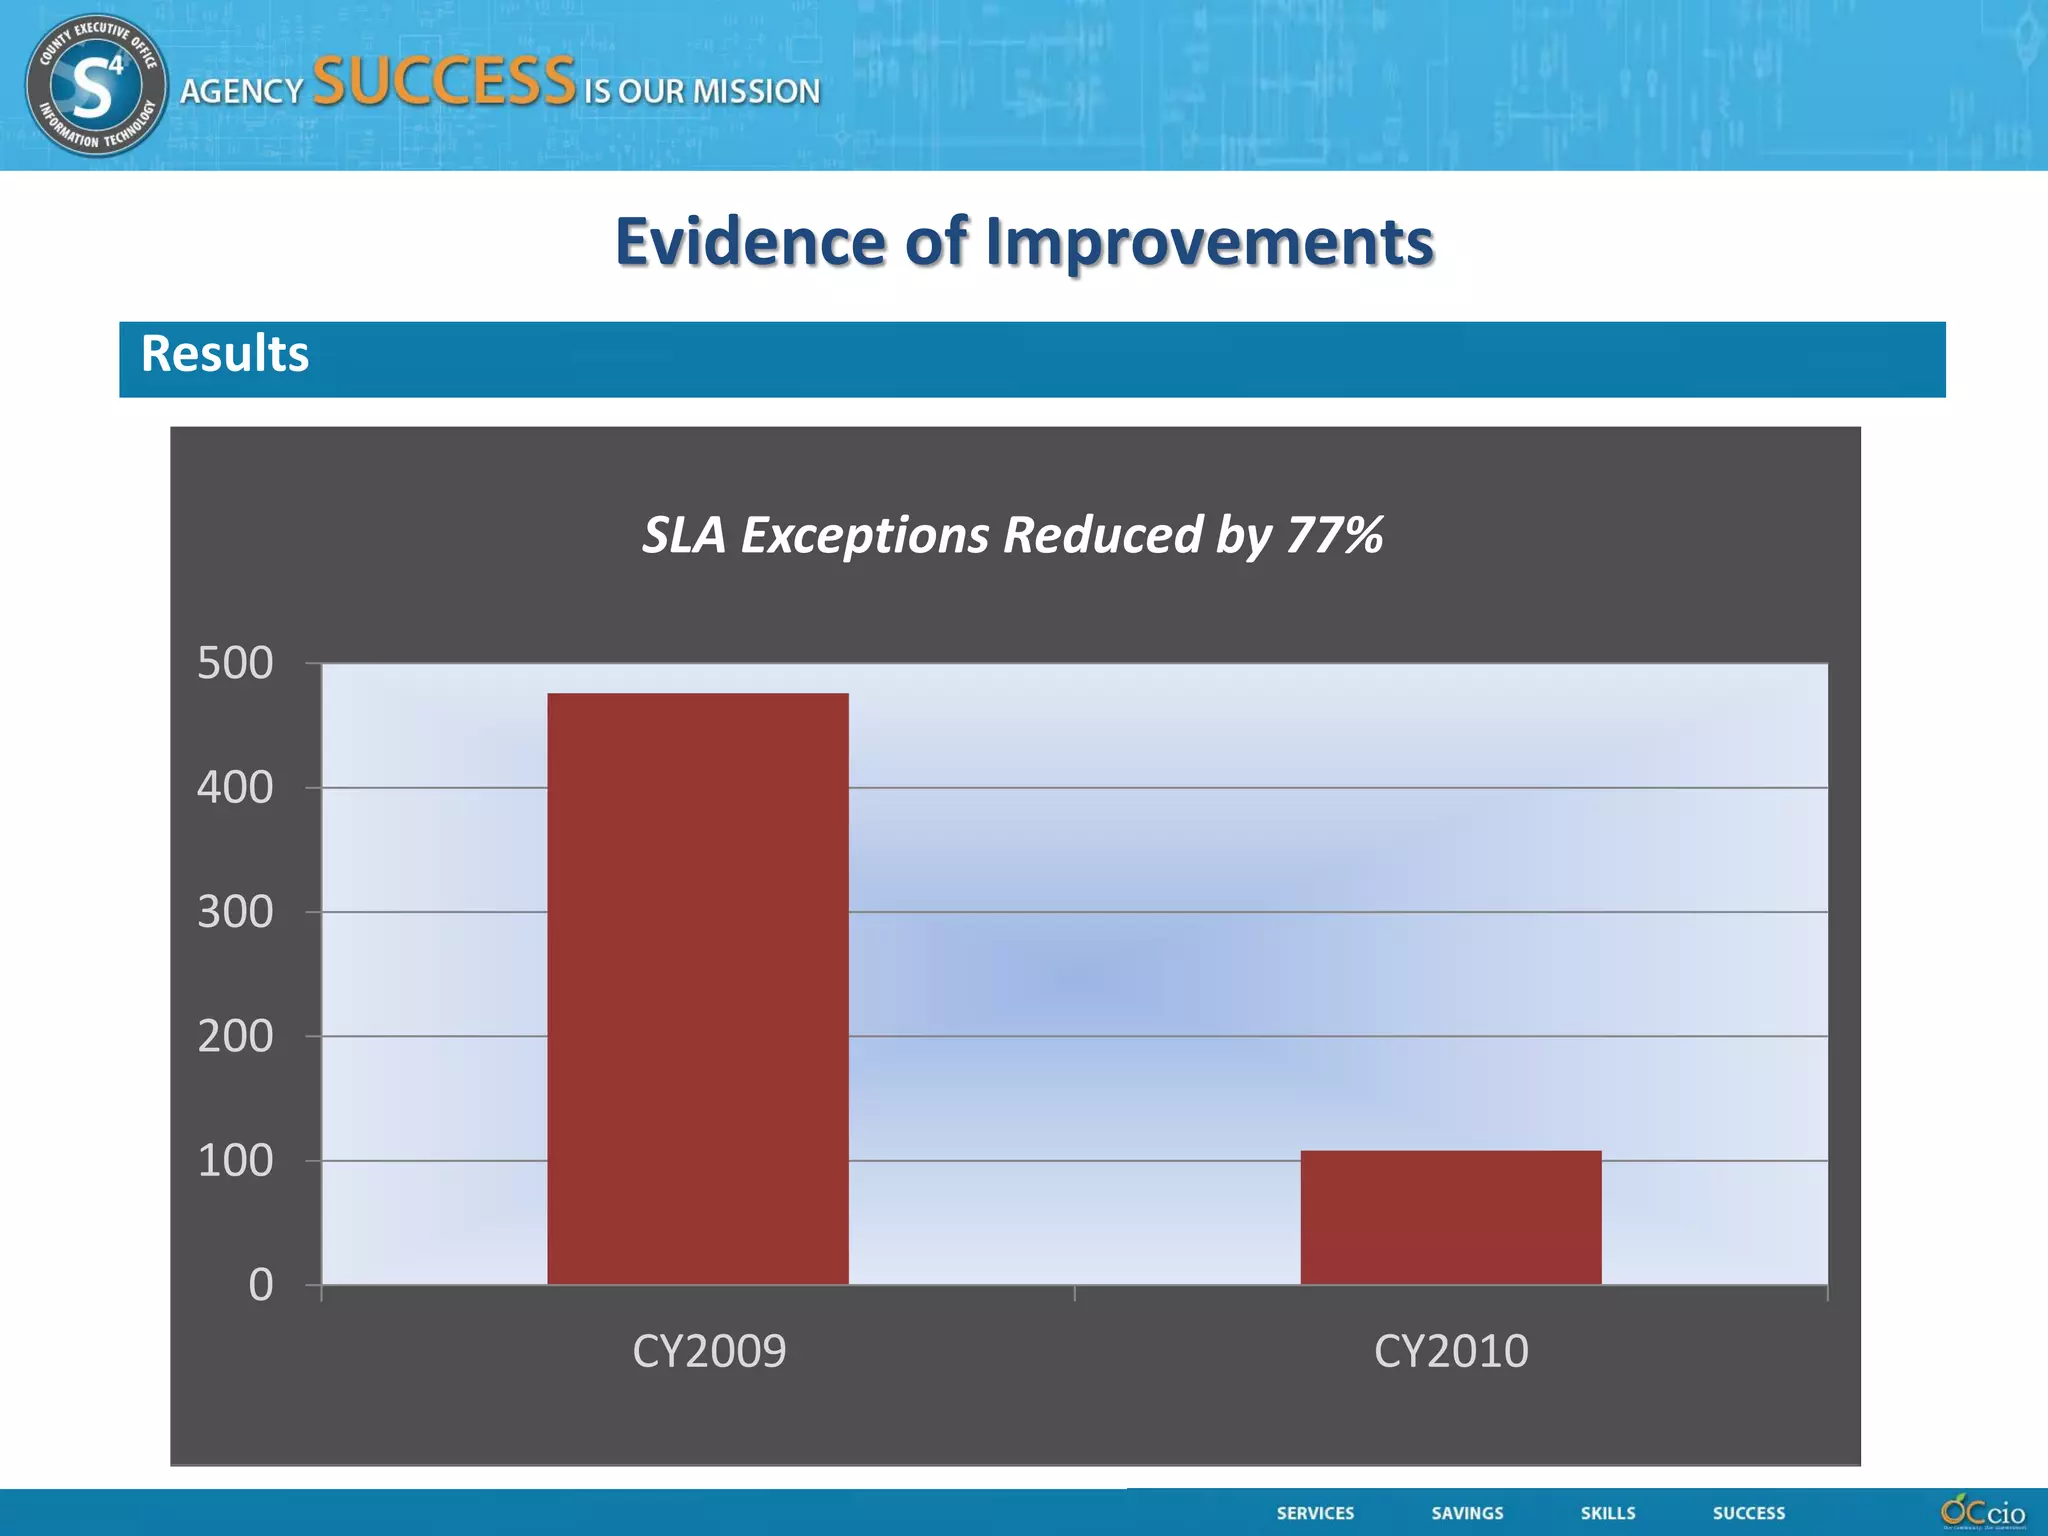
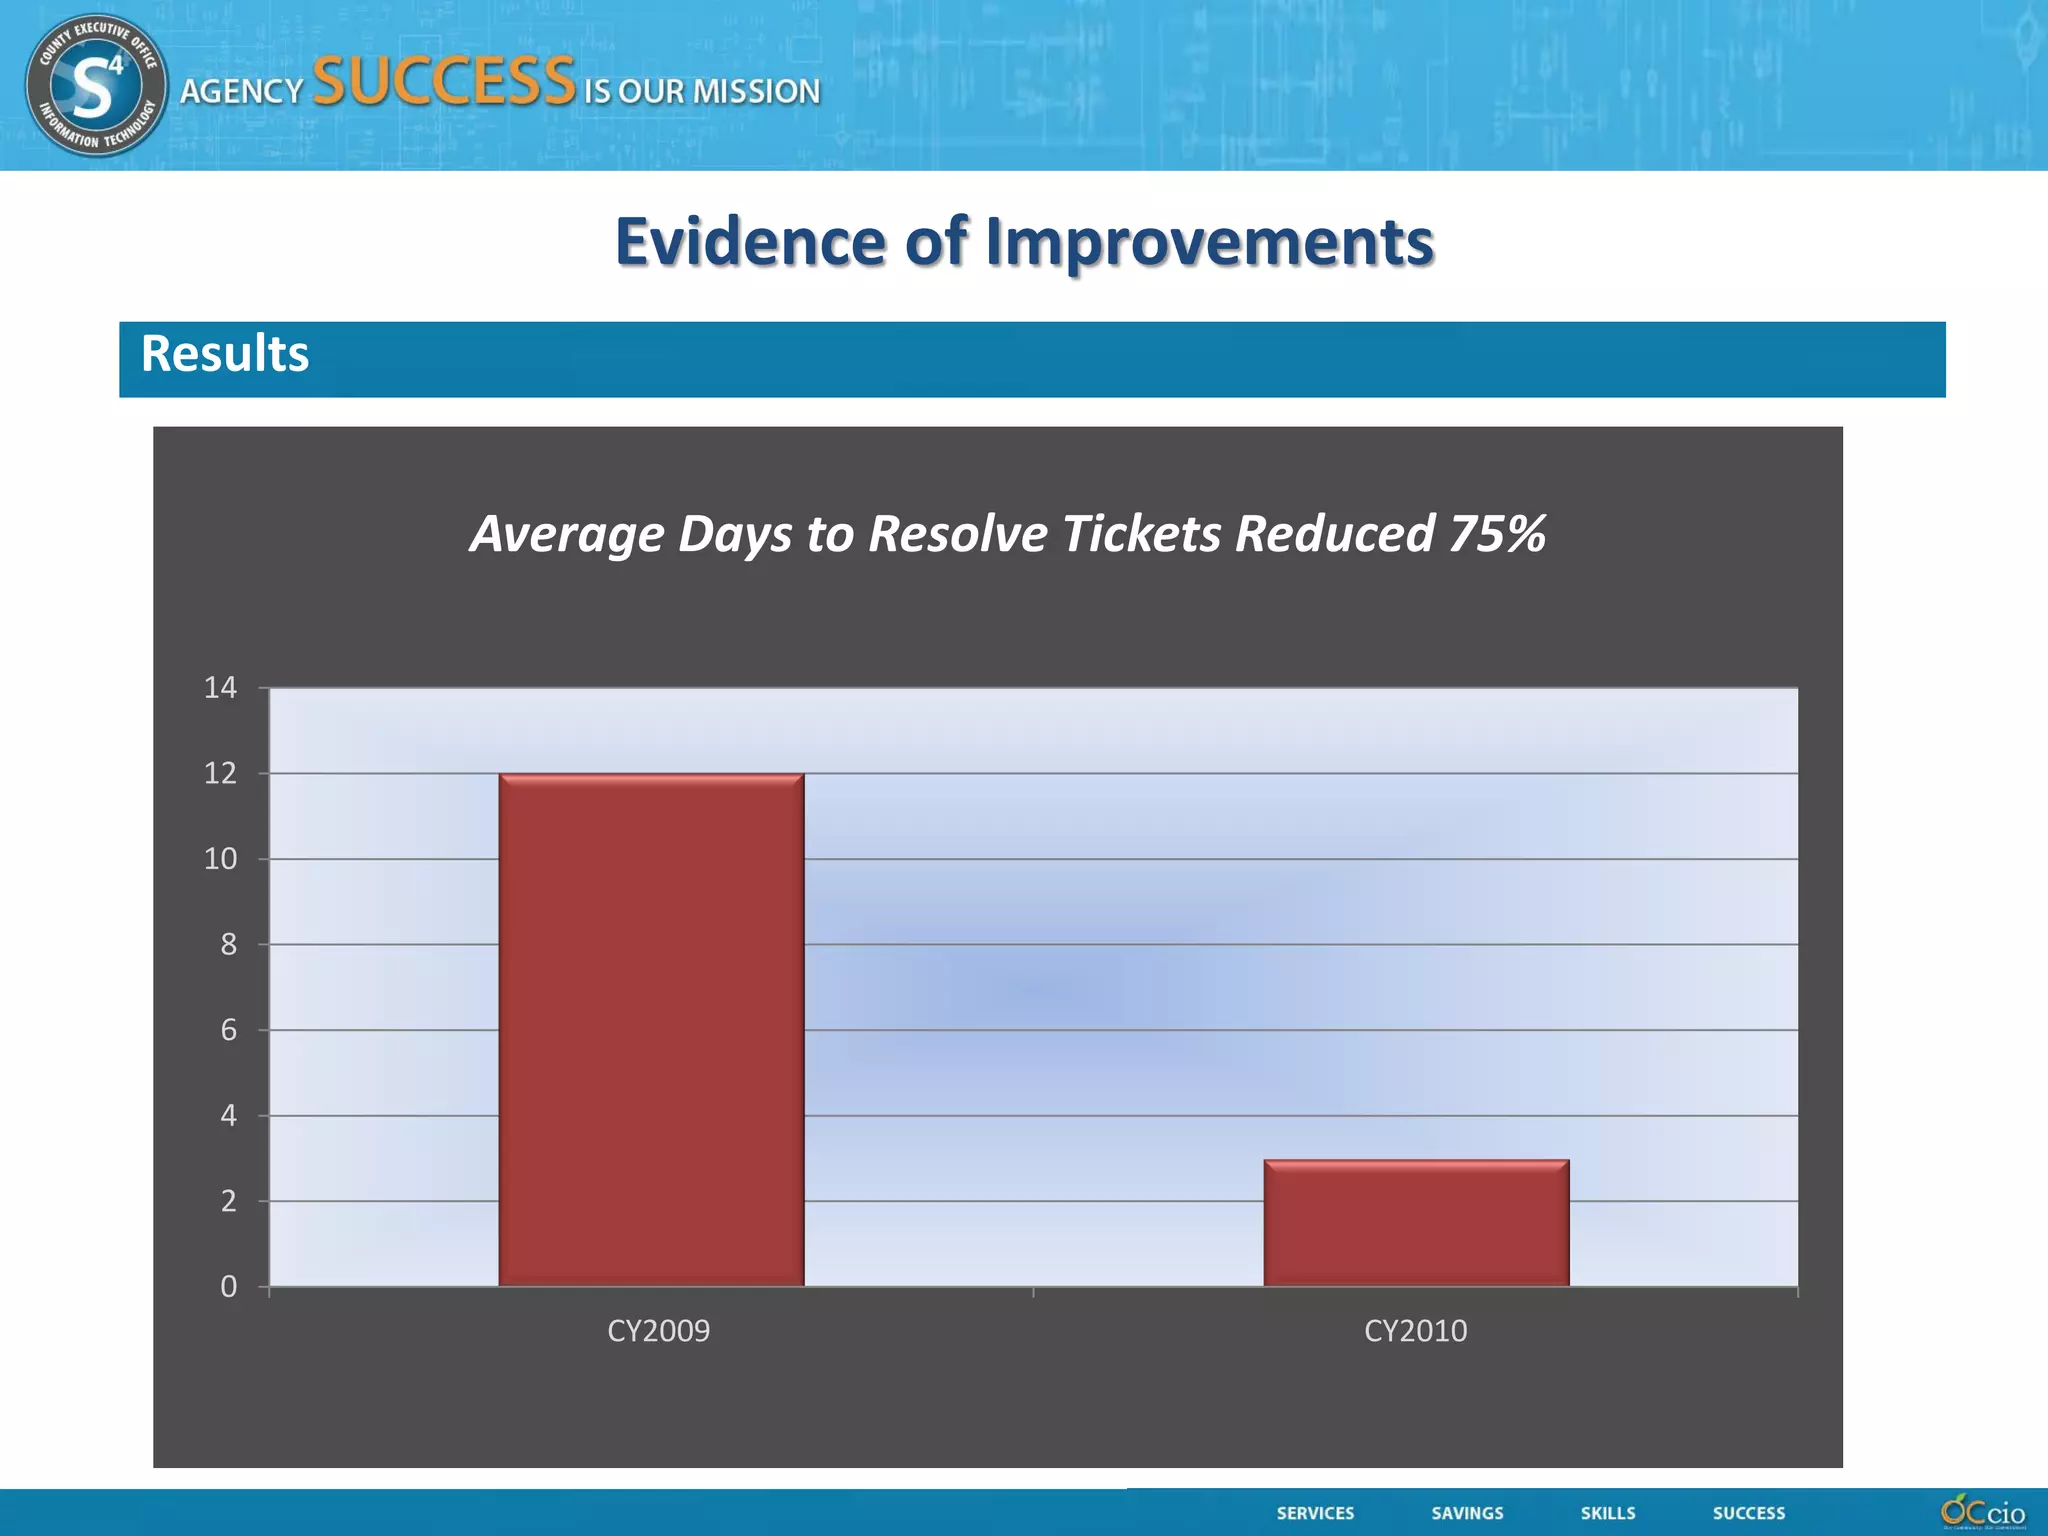

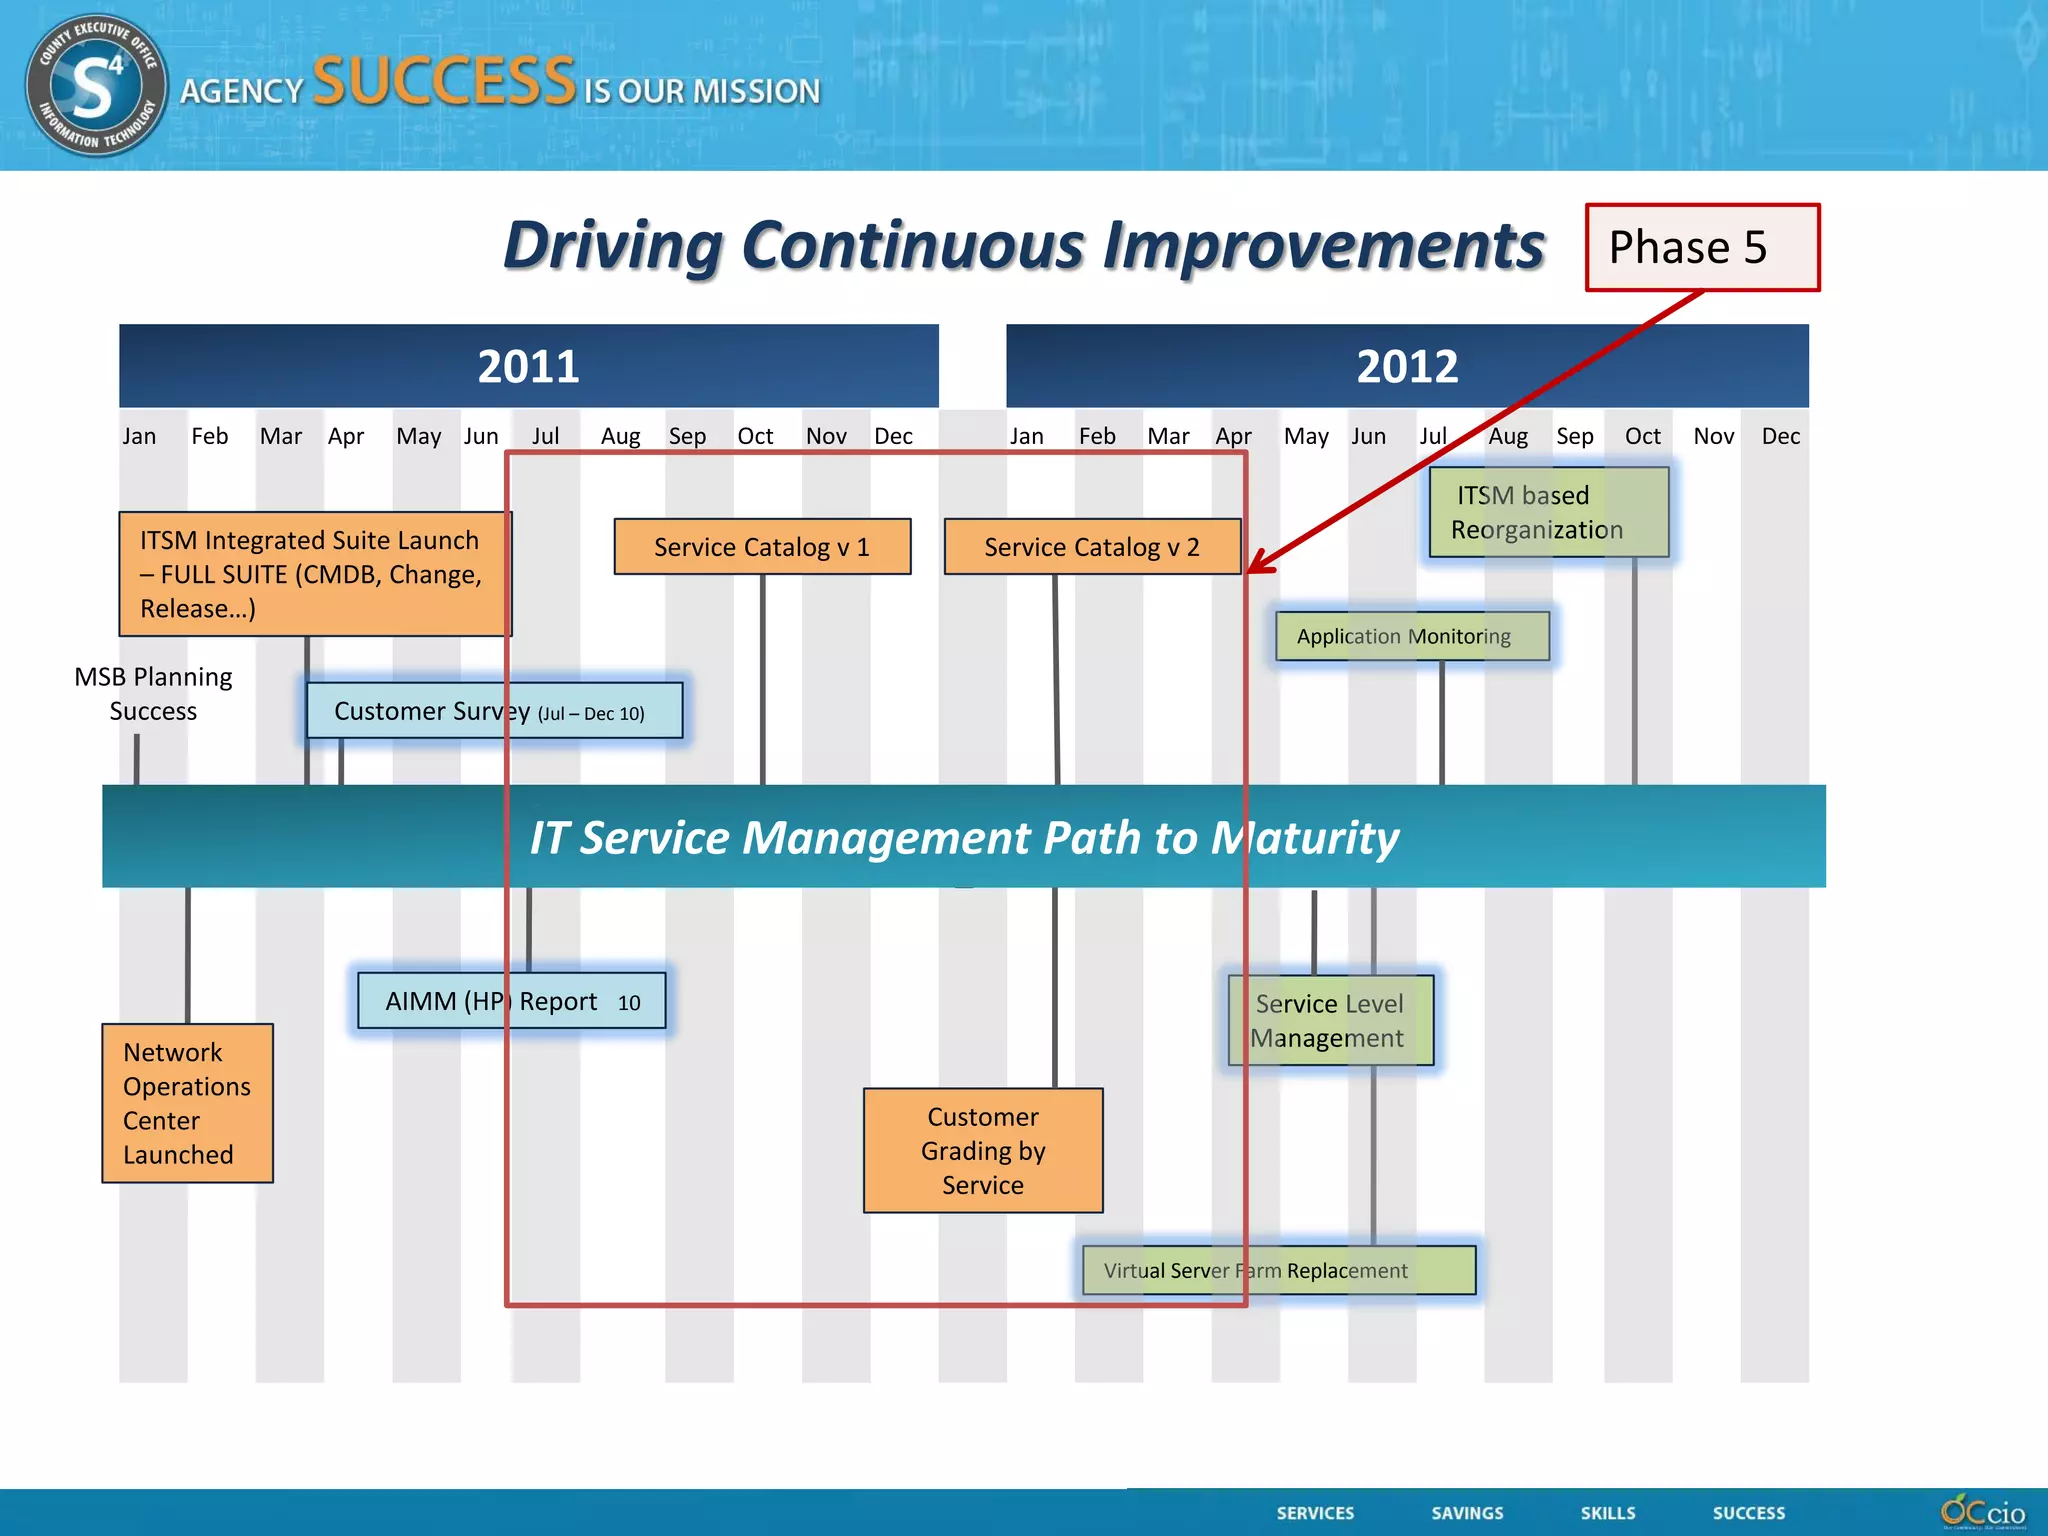
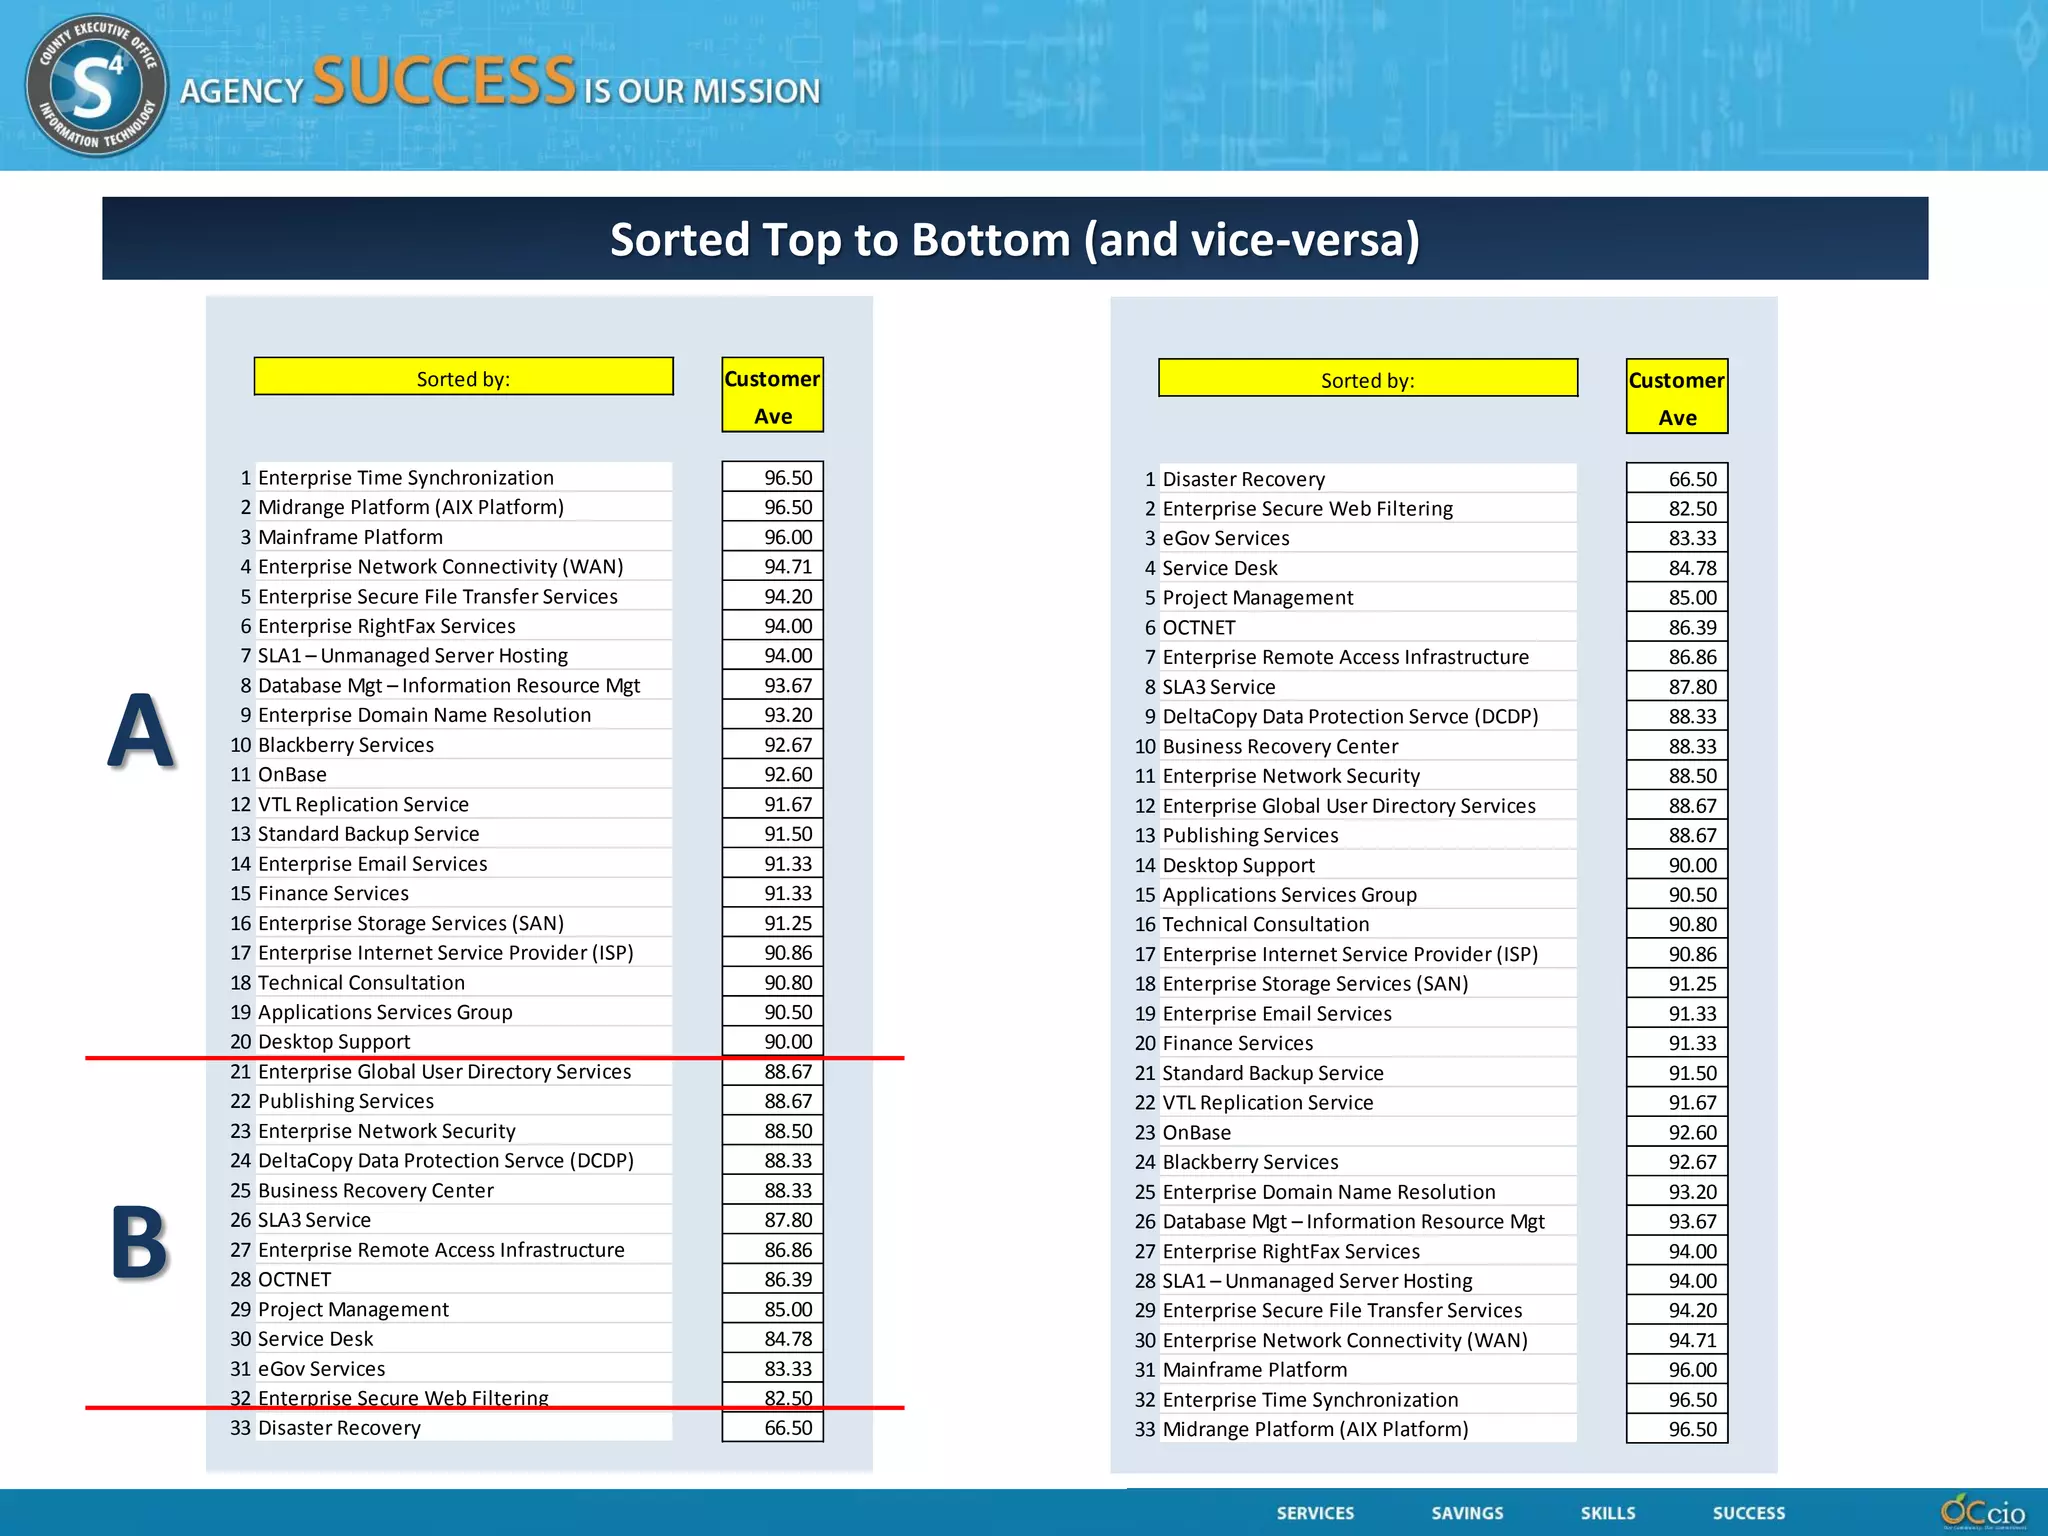
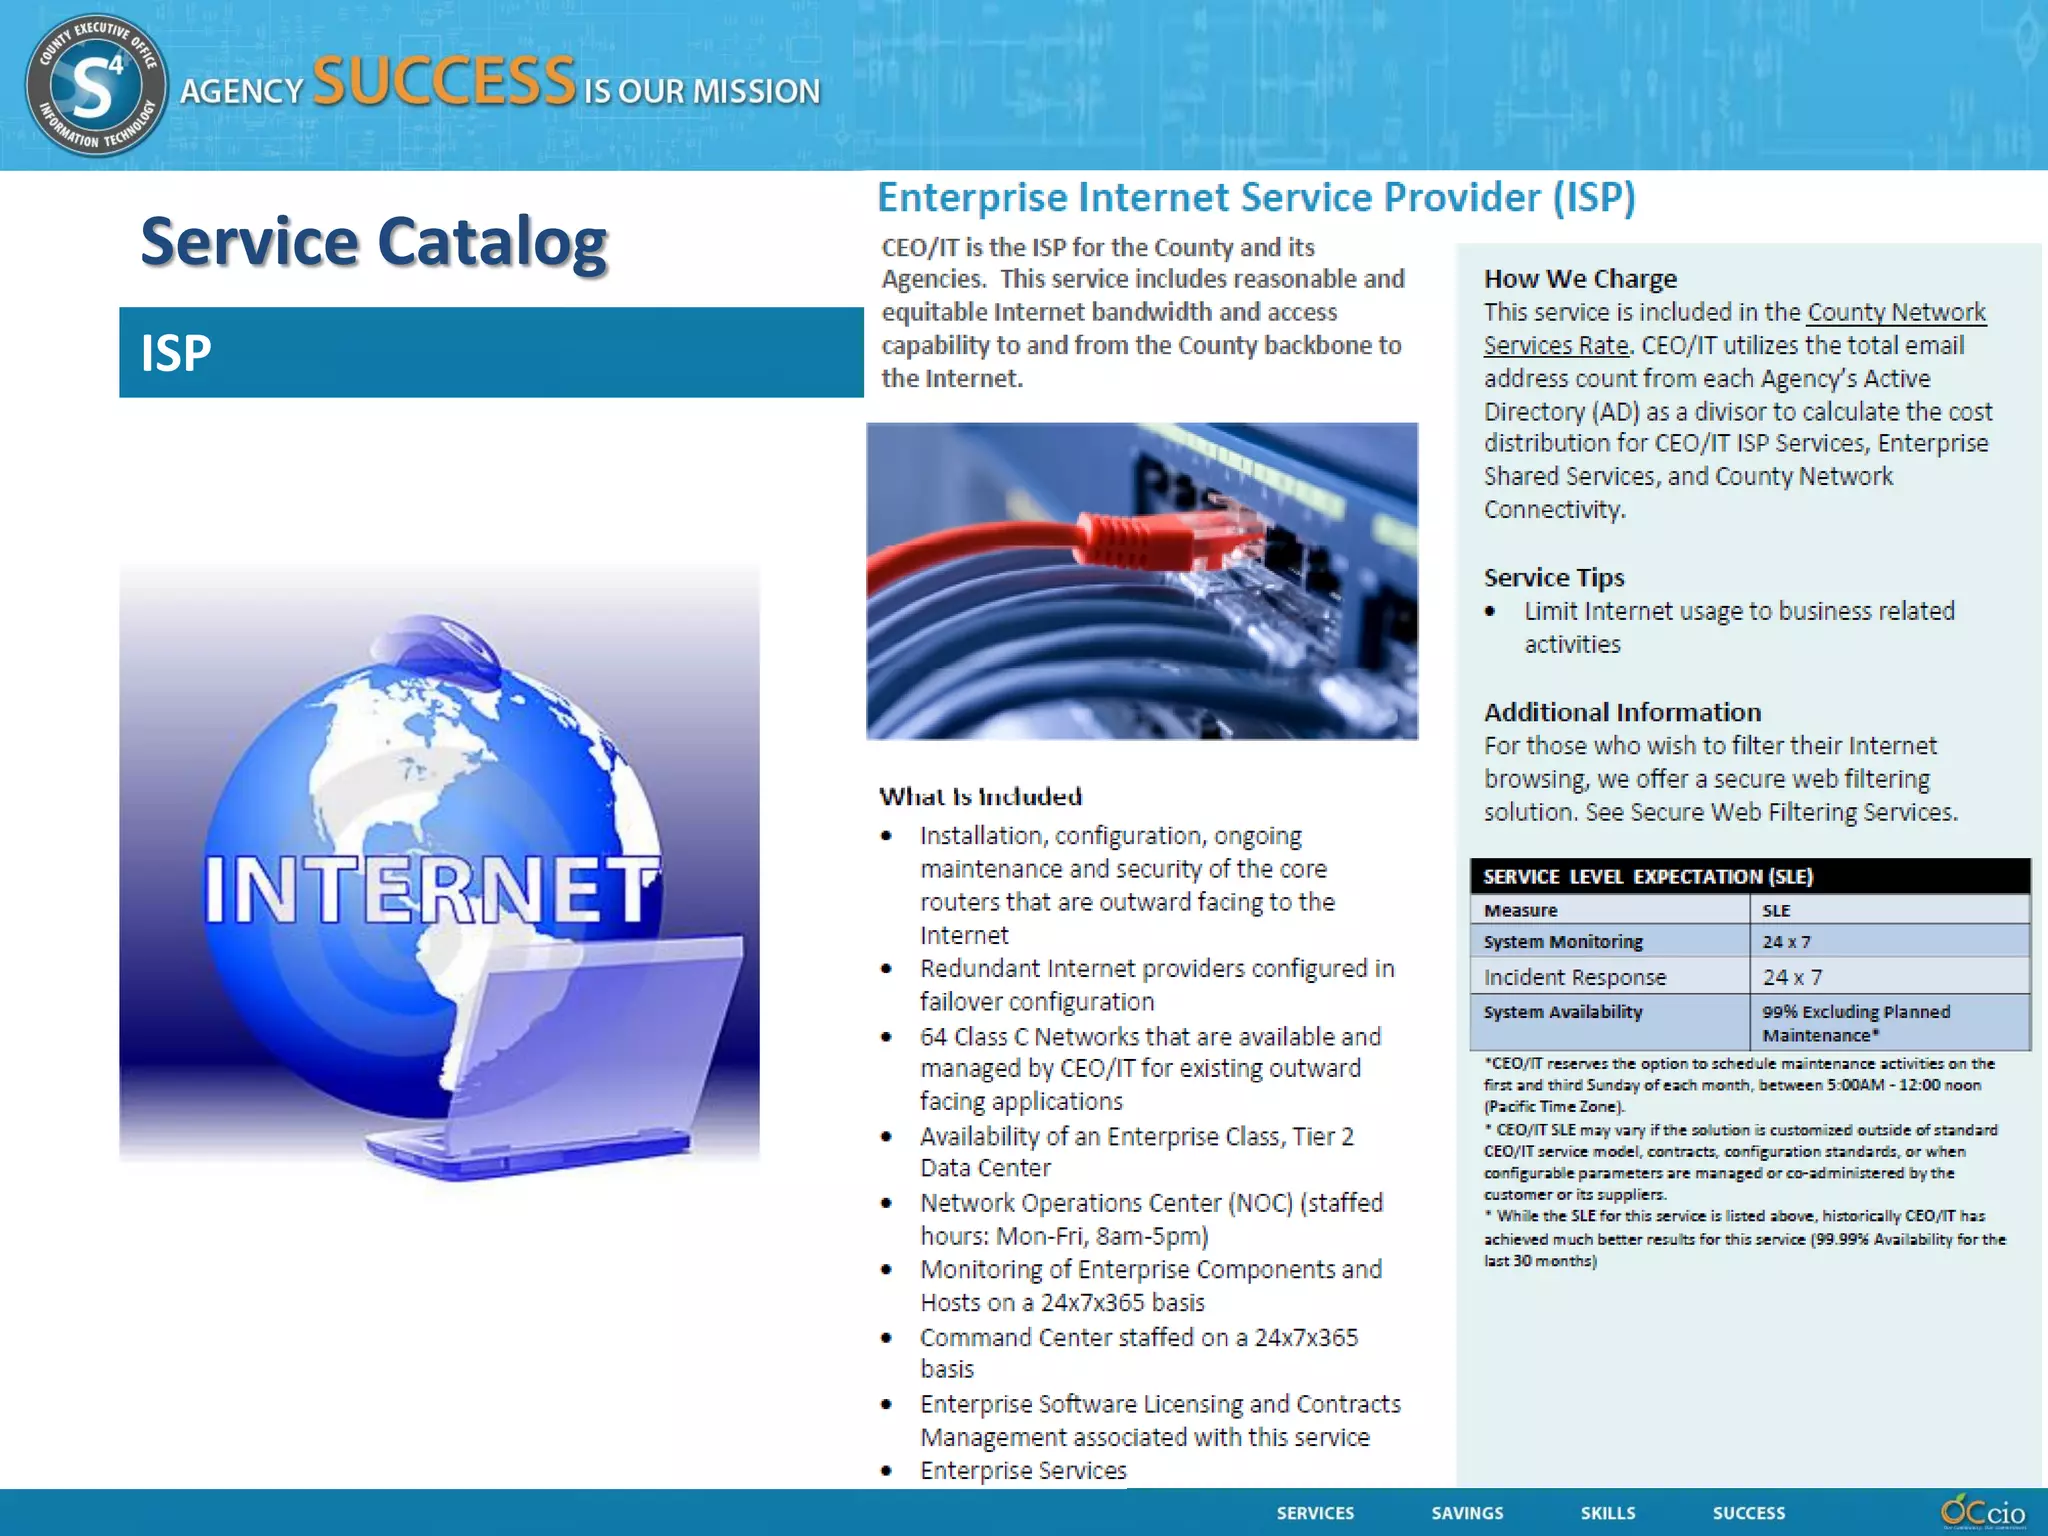
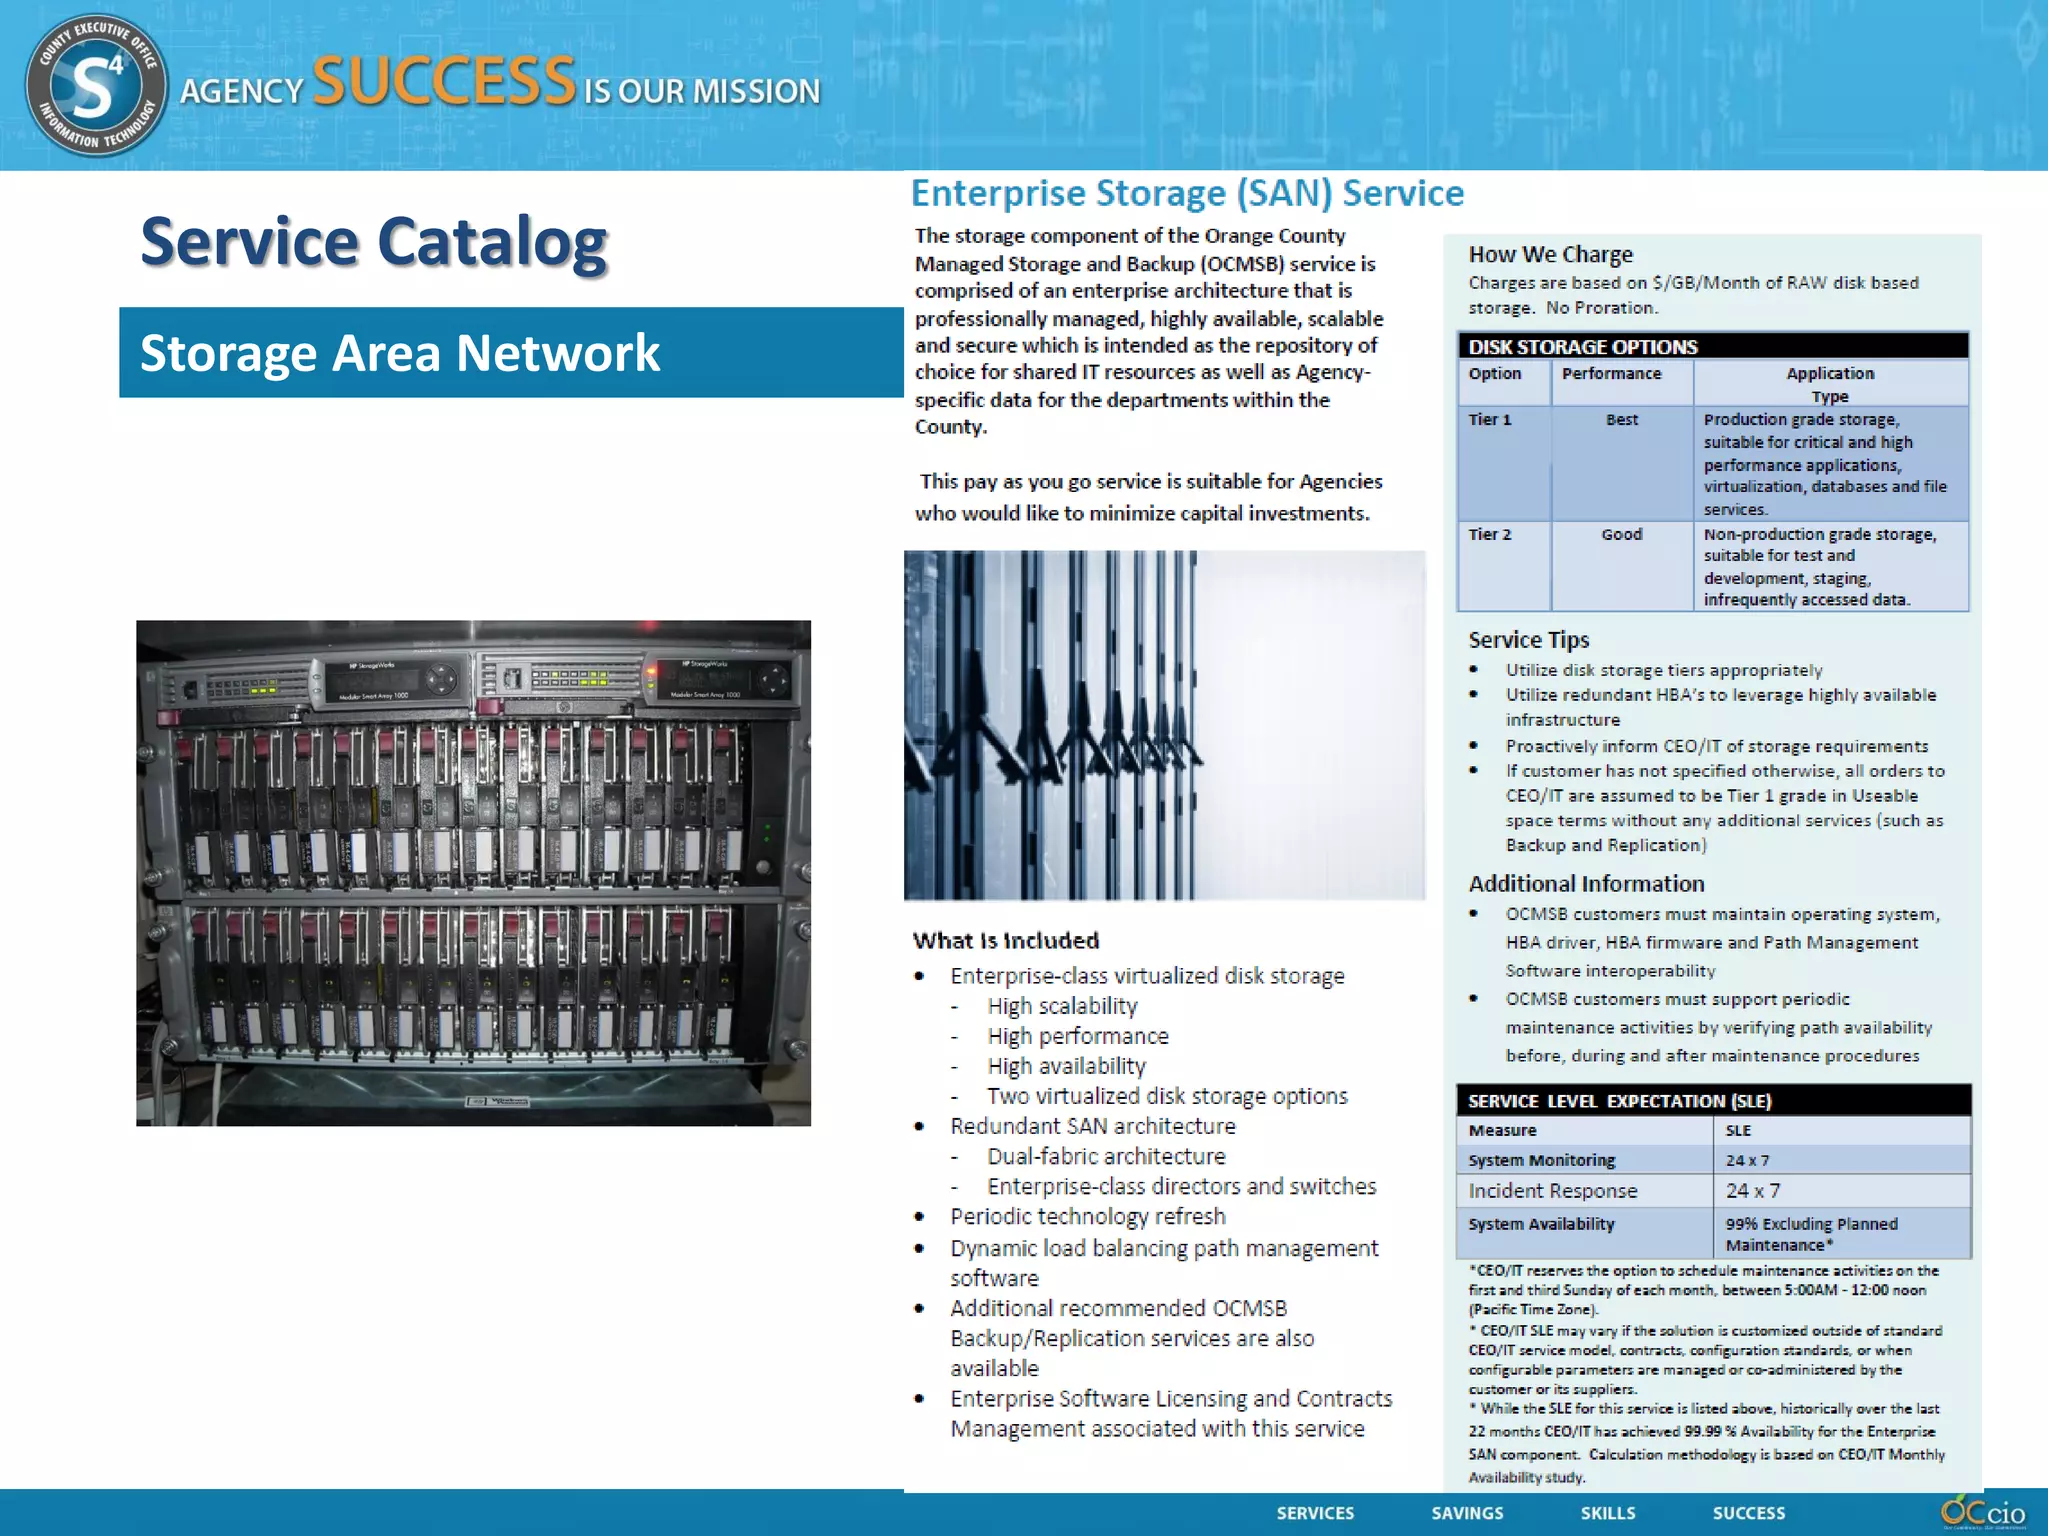
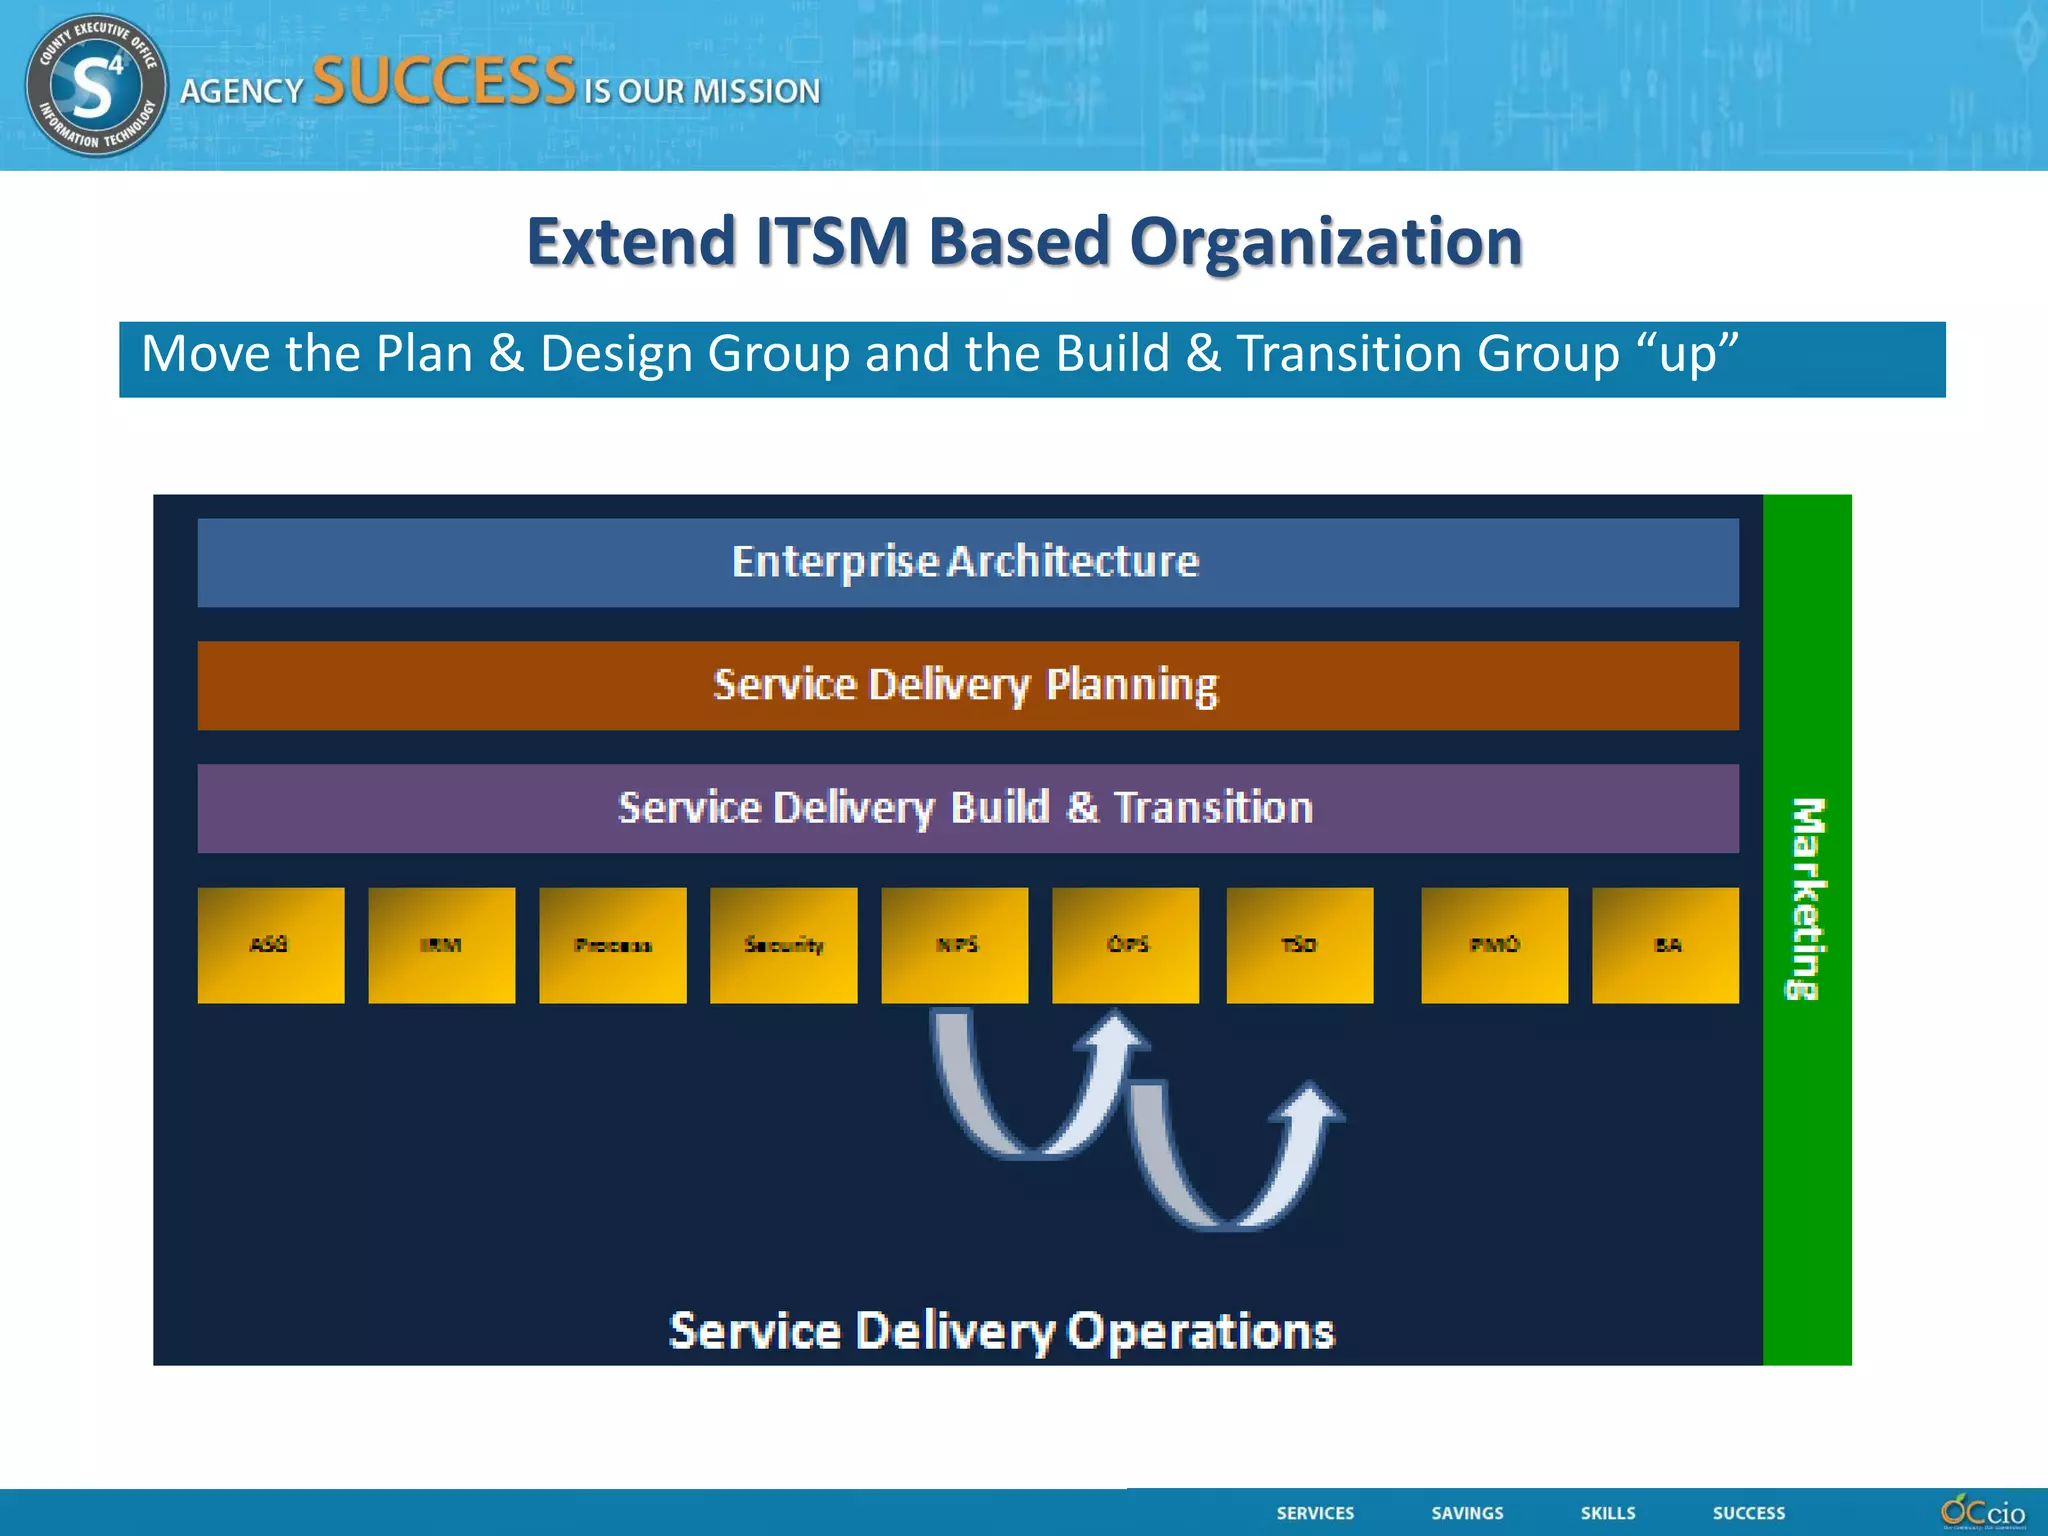
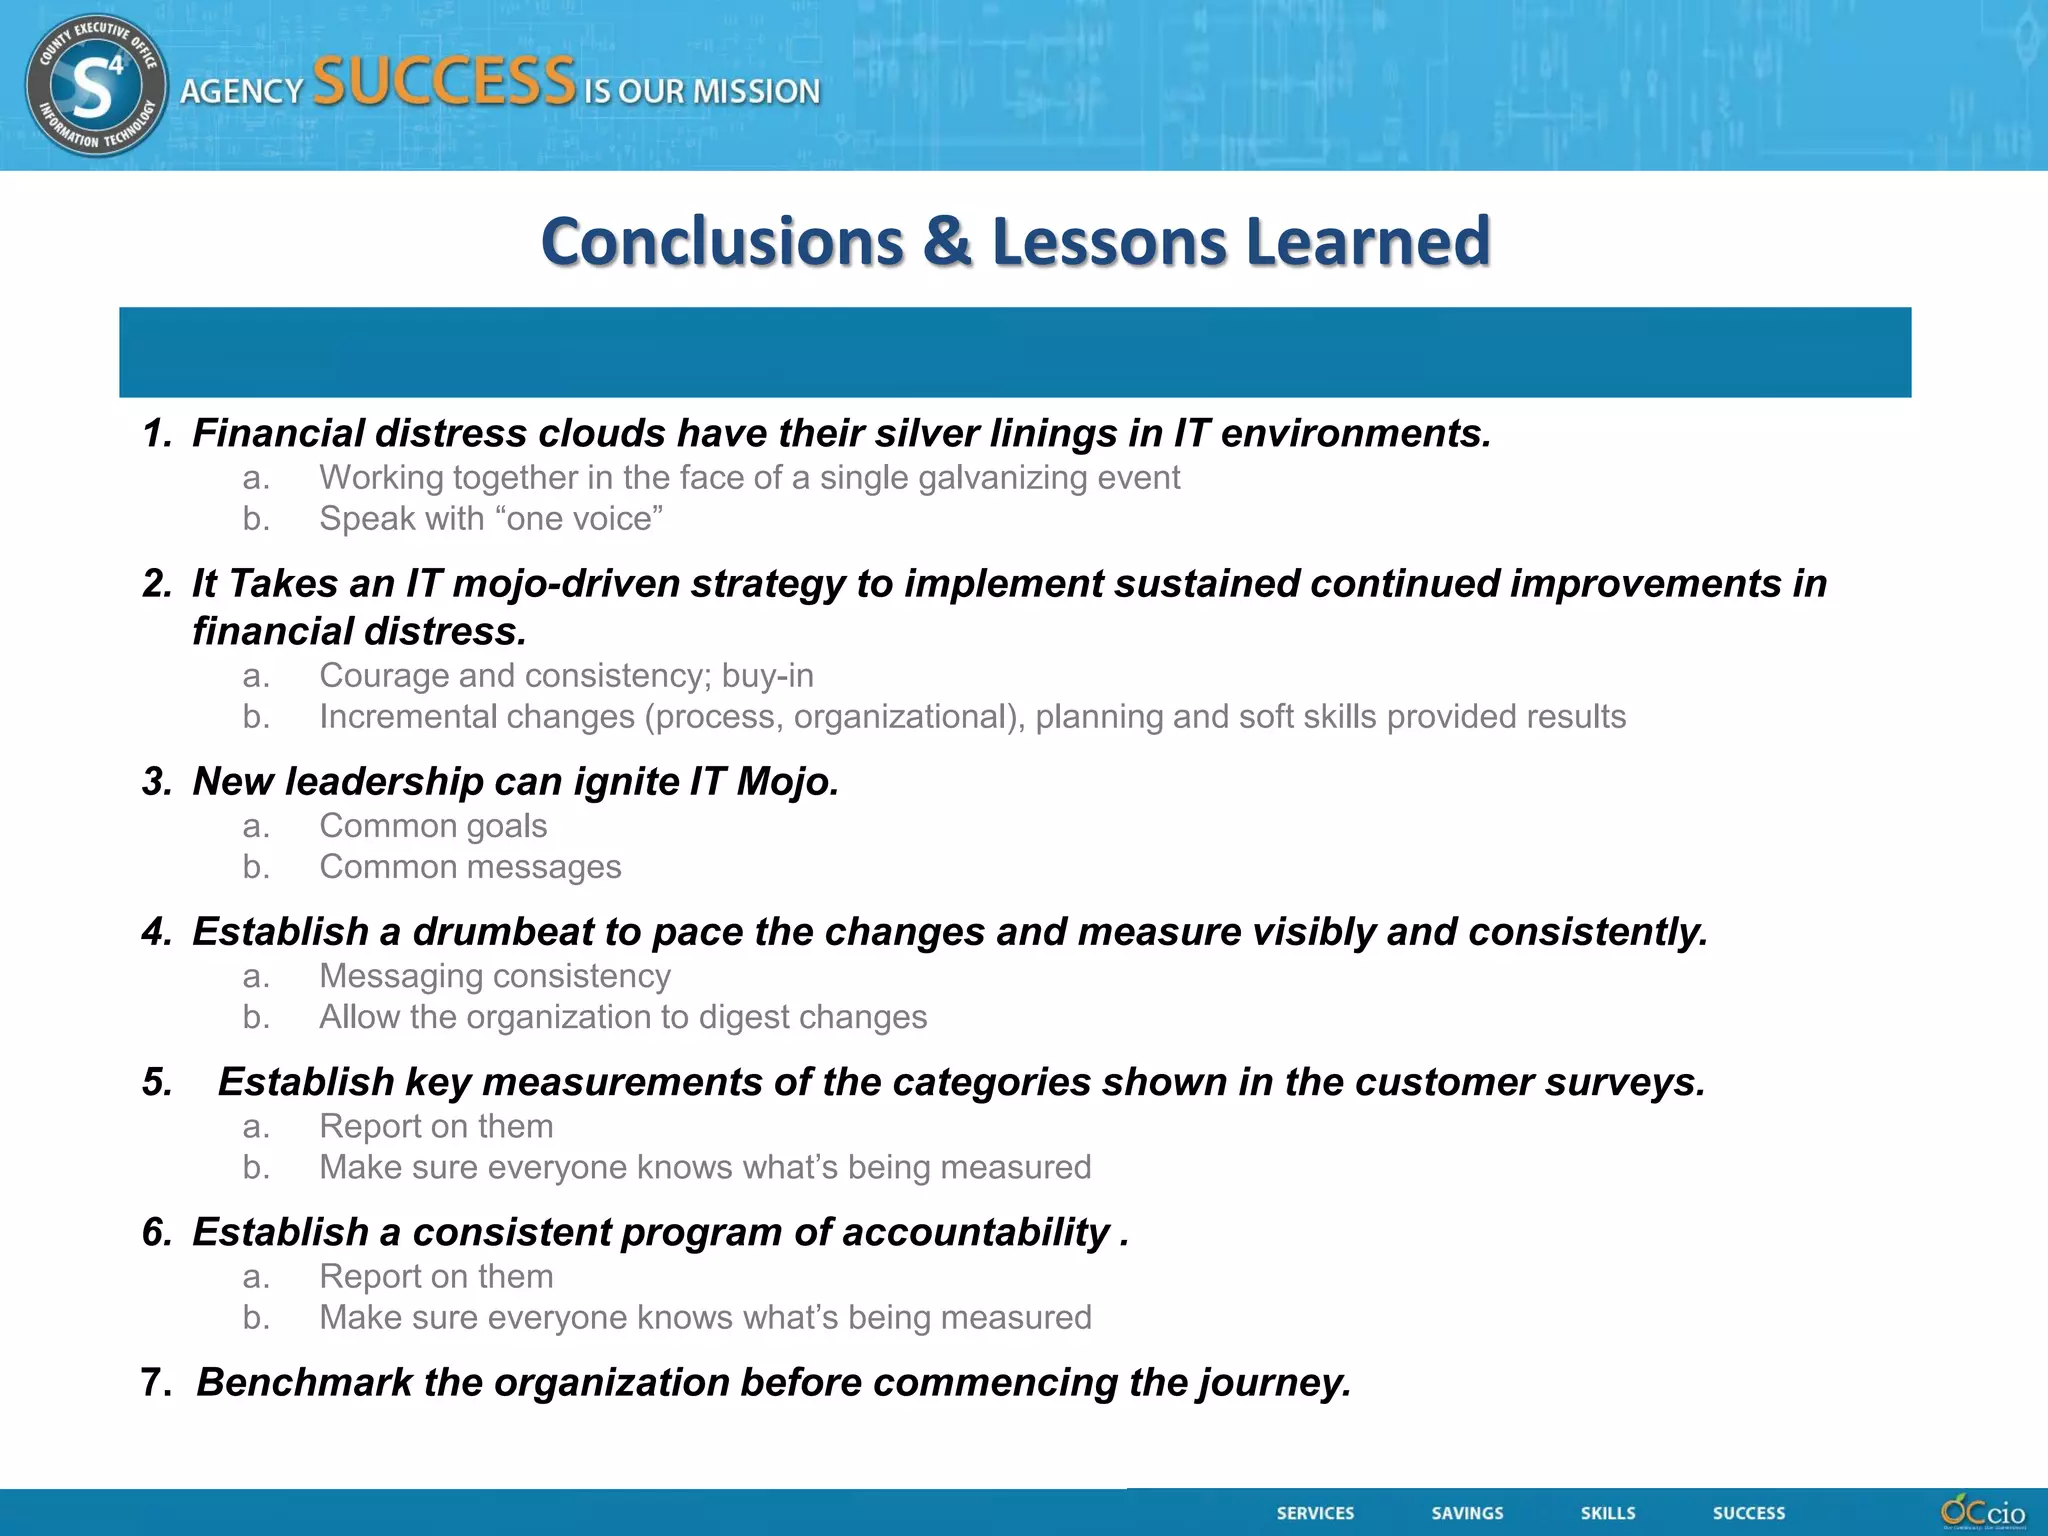

The document outlines the County of Orange's journey to establishing a service catalog for IT services. It describes the 5 phases of the project, which included ITSM training, reorganizing the network and platform services team, creating service design packages, developing a marketing brochure, implementing an integrated ITSM software suite, and establishing a network operations center. The results were improved service delivery, reduced costs, increased customer satisfaction, and positioning the organization for continuous improvement.