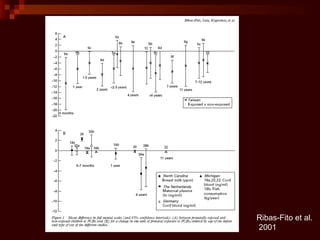
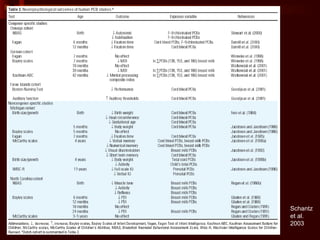
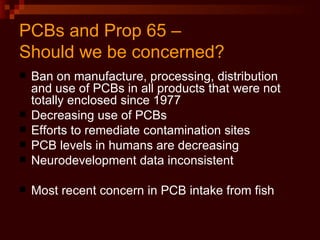
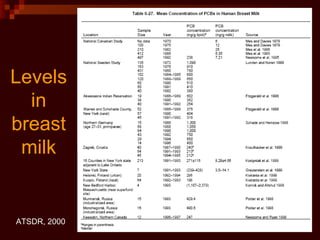
PCBs – Polychlorinated Biphenyls Juliann Chen Laura Stachel
PCBs and Prop 65 Background on PCB Physiologic Effects Reproductive Effects Developmental Effects Should store bought salmon be included under Prop 65?
PCBs No known natural sources  Belong to class of halogenated aromatic hydrocarbons Family of chemicals with biphenyl nucleus and varying number of chlorine atoms (1 – 10) 209 different congeners – chemical and toxicologic properties vary Toxicity varies with degree of chlorination and position of chlorine atoms
Properties and Industrial Appeal Chemical stability over time Resistant to breakdown by light, heat and air High boiling point Not soluble in water Non flammable/low flammability Electrical insulating properties Light, oily fluids to greasy or waxy substances No taste or smell
Commercial & Industrial Uses Electrical – insulating and cooling Heat exchange and dielectric fluids in  capacitors and transformers Hydraulic equipment, hydraulic fluids Plasticizers in paints, plastics and rubber products In pigments, dyes and carbonless paper Adhesives, protective surface coatings for wood Microscope immersion oil Extenders for pesticides Flame retardants
History of PCBs 1800’s first discovered 1929 commercially produced Between 1929 and 1977, 1.1 billion lbs produced in US (Monsanto) At height of production, 5 million lbs produced annually 1960’s – Sweden found PCB in soil and water when studying DDT 1968 -  Japan YUSHO – mass poisoning from contaminated rice oil 1979 – Taiwan poisoning (Yucheng) – rice oil contamination 1976 – Toxic Substance Control Act (TSCA) – prohibitions on the  manufacture, processing and distribution in commerce 1979 – banning of production in U.S.
How did they enter environment? Past disposal  of PCB waste products in rivers, streams, open land-fills  Improper disposal  of PCB-containing equipment or chemical  products Intentional release  into environment  Reduce dust emission on dirt roads Extenders in agricultural pesticides Leakage of sealed PCB fluid compartments  during commercial use of transformers and capacitors Leaching/leaking of PCB from   malfunctioning heating coils  into food Electrical fires  –  incomplete combustion  products more toxic than PCB Ingestion   of contaminated fish  from contaminated water
Environmental Cycling Cycling of PCBs through the environment Volatilization  from land and water surfaces into the atmosphere Redeposition  back to land and surface water Adsorption  to sediments and  revolatilization North Atlantic Ocean is the dominant sink for PCBs accounting for 50 – 80% of PCBs in the environment. Major continental reservoir is freshwater sediments in US. High in Great Lakes. Ubiquitous in the environment, including remote places and the Arctic.
Current Sources of Exposure Contaminated food (90%) Accidental release from existing electrical equipment Improper incineration Occupational exposure Hazardous waste sites
Who’s at Risk? Fish and wildlife Domestic animals Humans Occupational exposure People living near incinerators, hazardous waste site Recreational fishers People who eat marine products or fresh water fish Offspring of fish consumers
Bioaccumulation PCBs persist in the environment, concentrating upward in the food chain Adsorb strongly to soil and sediment Taken up by bottom feeding fish and other organisms Transferred through the food chain and biomagnified Stored in fat Half-lives of most congeners from months to years PCB levels in aquatic organisms can be up to one million times higher than the concentration in their aquatic environment
Levels of PCB 1.9 ppm Bottom-feeding and game fish  ( EPA, 1992) 20 ppm Fish near hazardous waste sites ( ATSDR, 2000) <20 ppb Background levels in human serum (1980s) 1-2 ppm Human adipose tissue 40-100 ppb Human breast milk 40-100 ppb Recreational fishers
Pharmacokinetics Absorption by skin, GI or inhalation Storage in fat Liver is primary site of metabolism Hydroxylation and conjugation with glucuronic acid and sulfates Metabolism and excretion dependent on specific molecular structure Percent chlorination inversely related to excretion rate Slow excretion – bioaccumulation occurs even at low exposure levels
Physiologic Effects Dermatologic Reproductive and Developmental Effects Neurodevelopmental Endocrine Hepatic Carcinogenic Immune
Evidence on physiologic effect Industrial workers – occupational exposure Two episodes of mass poisoning in Japan and Taiwan Studies of adults and children exposed to PCB by consuming contaminated sport fish Background contamination Animal studies
Difficulties of Human Studies Assessing Exposures Concurrent Exposures, confounding variables Total PCB levels vs. Specific congeners Commercial products vs. degraded PCB products level of contaminants and breakdown products Biomarkers differ between studies Body compartment distribution Lifetime bioaccumulation vs. new exposure
Reproductive Effects Animal and Human studies
Reproduction - Animal Studies Rats, Mice Rabbits Minks Monkeys Commercial mixtures Single congeners Contaminated fish Experimental mixtures Different dosings
Animal Reproductive Effects   Female Male Prolonged estrus cycle rates Decreased sexual receptivity Reduced implantation rates Decreased conception Increased abortions, resorptions or stillbirths Reduced seminal vesicles and epididymal weights Decreased mating success Reduced fertility in offspring Decreased epididymal sperm count Decreased number of implants and offspring
Reproductive Effects - Women Taylor et al, (1989 ) no apparent effect of occupational exposure to various Aroclor mixtures on mean number of pregnancies Mendola et al. (1997 ) Great Lakes fish consumption associated with shorter menstrual cycle. No increased in spontaneous fetal death (1995) Gelhard et al (1998)  PCB level assoc with history of miscarriage but not future pregnancy outcome Buck et al (1997, 1999, 2000)  One cohort of Great Lakes fish eaters indicated that women were more likely to have positive associations with conception delay than their exposed husbands  Courval et al (1999)  association between conception delay and Great Lakes fish consumption in exposed men, but not in their wives  Conclusion:  Effects of PCB on human conception is unclear
Reproductive Effects – Men Hauser (2003)  studied 212 male partners of subfertile couples at Mass General Hosp 57 PCP congeners and DDE measured Dose-response relation among PCB-138 and sperm motility and morphology Inverse relationship of same sperm parameters with sum of PCBs, &  PCBs that induce CYP450 Suggest different toxicity between congeners Environ Health Perspect. 2003 Sep;111(12):1505-11
Reproductive Effects - Men  Dallinga (2002)  – compared PCB levels in men with poor semen quality to levels in men with normal semen quality – no difference Within subgroup of men with normal semen quality - Sperm count and sperm motility were inversely related to PCB metabolite concentrations Hum Reprod. 2002 Aug;17(8):1973-9.
Reproductive Effects  (cont) Guo (2002)  – follow of offspring from 1979 Taiwan poisoning shows sperm of exposed children with increased abnormal morphology, reduced motility, decreased sperm penetration Guo, Lancet. 2000 Oct 7; 356:1240-1. CONCLUSION:  Studies suggest specific congeners may affect sperm parameters
Human Development Birth Weight and Gestational Age
Birth Weight and Gestational Age Jacobson -Michigan cohort   (fish consumption): decrease in gestational age (4.9 days), BW (160-190 g), head circ. (0.6 cm) Taylor  – N.Y.(occupational exposure): small decrease in birth weight and gestational age (33 gm)
Birthweight and Gestational Age Lake Ontario fisheaters  – no assoc of prenatal PCB with BW, HC or GA  (Lonky, 1996) North Carolina  – no assoc of BW, HC and PCB Netherlands  – prenatal PCB exposure assoc with reduced BW, not HC  Association gone at 3 months in breast fed infants Smith (1984) Wisconsin PCB associated with higher birthweight
Increase 72 Wisconsin fish eaters Smith Decrease 179 Netherlands Pantandin No change 912 North Carolina background Rogan No change Lake Ontario fisheaters Lonky Decrease 200 Occupational exposure Taylor Decrease 241 Michigan fish eaters Jacobson Birthweight number Location Study
Neurodevelopment Overview
Neurodevelopmental Studies Accidental poisoning Japan Taiwan Fish Consumption Michigan  Oswego (New York) General population Rotterdam-Groningen - Netherlands (Dutch) Dusseldorf, Germany North Carolina Inuit Children (Canada),  Collaborative Perinatal Project (U.S.),  Child Health and Development Study (CA)
Neurodevelopmental Tests Ribas-Fito et al. 2001
Neurodevelopment Yusho and Yu-Cheng experience
Yusho (1968) - Japan 1300 people ill after consuming rice bran oil contaminated with 2000 – 3000 ppm of PCB heat-transfer agent Disease: Severe chloracne, dark brown pigmentation, ocular swelling High rate of stillbirth, newborns small size, discolored skin & nails, premature teeth Follow-up of a subset of children showed lethargy, hypotonia, jerkiness, clumsy movement, apathy, and low IQ. Raised concern about potential neurotoxicity of PCBs
Yucheng: Taiwan, 1979  prenatal exposure Intrauterine growth retardation Hyperbilirubinemia,  hyperpigmentation, acne, abnormal teeth, nails, gingiva Later childhood – lower weight and height Lower IQ (4 pts) and behavioral disorders Contaminated rice oil contained PCDFs as thermal degradation products.  Level of PCB intake 1000-fold> U.S. intake
Mean Difference in Full Mental Scales – Taiwan
Neurodevelopment Fish consumption studies
Michigan Cohort  313 infants, Maternal fish consumption in 242 Exposure estimated between 168 and 3012 ppb,  PCB of cord serum, maternal serum and milk Maternal serum level 6.1 ppb in fish eating group,  4.1 ppb in no fish group Testing at birth, 5 months, 7 months, 4 years and 11 years Fein et al, 1984; Jacobson et al. 1984, 1990, 1996, 1997 Methodology flaws  –  exposure data based on recall Cord PCB below detection limits in 70%, maternal serum in 22%  poor correlation of fish consumption and cord PCB levels  lack of testing for concurrent toxicant exposures,  exposed women consumed more alcohol and caffeine, took more cold medication during pregnancy, lower weight
Michigan cohort results Birth  –neuromuscular immaturity, greater startle and weaker reflexes associated with fish consumption  but not cord PCB levels   7 months  – impaired visual recognition memory assoc with cord PCB levels and fish consumption 4 years  –declines in cognition and memory assoc with prenatal PCB exposure in the most highly exposed children 11 years  – prenatal PCB exposure associated with lower full-scale and verbal IQ scores, poorer word comprehension and reading comprehension
Oswego Cohort Lonky et al  (1996):  569 mothers with Lake Ontario fish consumption, enrolled 1991-1994 3 groups: high, low and no fish consumption High maternal fish consumption assoc with less mature autonomic responses and increased abnormal reflexes in newborns Stewart et al  (1999): 279 women Heavy chlorinated PCB congeners most valid index of fish-borne exposure Poor NBAS performance associated with highly chlorinated PCBs
Neurodevelopment General population
North Carolina Cohort 880 women with background exposure, 931 infants PCB levels in cord blood, placenta, maternal serum at birth and 6 weeks, milk and formula samples (birth, 6 wk, 3 mo, 6 mo) Evaluations at <1, 6, 12, 18 and 24 months Newborn  – PCB levels associated with hyporeflexia and general tone 6  and 12 months  – Bayley scales showed PCB assoc with psychomotor delay, not Mental Development Index 18 and 24 mos:  similar effects, though not significant 3, 4 and 5 years:  Deficits not apparent on McCarthy scales
Collaborative Perinatal Project 12 U.S. sites , 1207 women, 1959-1965 Maternal serum PCB levels 8 month olds no relation between the maternal prenatal PCB level and the children’s mental or motor development as measured by the Bayley Scales of Infant Development. Psychomotor score varied by center, some showed increased PDI, others showed decrease  ( Daniels  et al. 2003)
Dutch cohort 418 infants  born between 1990-1992 Compare breast-fed vs. formula-fed infants Collected maternal plasma in last month of pregnancy, cord plasma, maternal milk samples Measured PCBs (118, 138, 153, 180) in all biological samples Measured PCDDs and PCDFs measured in breast milk samples
Dutch cohort (cont) at 10-21 days:   breast fed infants had decreased tone and NOS values (Neurologic Optimality Score) at 3, 7, 18 months: Bayley assessments at 3 mo: PDI inversely associated with prenatal PCB levels, breast feeding did not effect PDI Bayley assessments at 18 mo: none of exposure measures associated with PDI at 18 mo : Neurologic exam higher maternal and cord plasma associated with lower NOS values Plasma and milk PCB levels neither related to NOS nor motor fluency PCBs in maternal plasma associated with K-ABC scores at 42 mo:  Neurologic exam Neither postnatal exposure nor current body burden associated with K-ABC or RDLS scores Cognitive deficits, especially in formula-fed associated with prenatal PCB levels
Schantz et al. 2003 Dutch cohort (cont)
D ü sseldorf (Germany) cohort 171 mother-infant pairs (1993-1995) Cord plasma and maternal milk samples Specific congeners and sum PCB levels Only first- or second-born infants from German speaking families and no illnesses or complications during pregnancy or delivery were included Families were primarily middle and upper class At 7 months, milk PCB levels (but not cord levels) related to poorer performance on MDI cognitive test but not FTII
Faroe Islands Birth Cohorts Diet high in fish, whale meat and blubber Maternal milk PCB levels higher than other studies 1 st  cohort: 1022 children, born 1986-1987 Cord blood, maternal hair, umbilical cord tissue for PCB and mercury Neuropsych assessment at 7 years – general lack of effects,  PCB level suggestive for deficit in Boston Naming Test only
Faroe Islands cohort (cont.) Second cohort 182 children (1994-1995) Maternal serum, cord blood, and milk PCB Analyzed for congeners Neurologic exam at 2 weeks with  no assoc of PCB exposure and neurologic exams,  muscle tone and reflexes
Ribas-Fito et al. 2001
Difficulties Comparing Human Studies   Selection bias – different populations studied Breast feeding PCB exposure levels, congener mix and rate of intake during pregnancy Differences in choice and timing of outcome assessment Confounding variables – concurrent exposure to other neurotoxins
Schantz et al. 2003
Prop 65 and PCB Should salmon carry warning labels?  Should breast milk?
PCBs and Prop 65 –  Should we be concerned? Ban on manufacture, processing, distribution and use of PCBs in all products that were not totally enclosed since 1977 Decreasing use of PCBs Efforts to remediate contamination sites PCB levels in humans are decreasing Neurodevelopment data inconsistent Most recent concern in PCB intake from fish
Primary source of exposure - diet Courtesy of the BC Salmon Farmers Association
FDA allowable tolerance limits 0.2 Finished animal feed for food producing animals (except feed concentrates, feed supplements, and feed premixes) 3 Red meat 0.2 Infant and junior foods 0.3 Eggs 3 Poultry 1.5 Cow Milk / Dairy (fat) 2 Fish (fat) Concentration (ppm) Commodity
Salmon While both farmed and wild salmon PCB levels were at least  40 times lower  than the FDA’s safety level, farmed salmon contained higher levels than wild salmon ( Science 2004) Attributed this to the fish used for fish feed Feed companies are exploring ways to reduce the PCBs in the feed ingredients
 
Farmed salmon Berkeley Bowl: discontinued most farmed salmon, both as a result of the reports and because supplier switched the type of salmon sold salmon is the fish department’s biggest seller Salmon sales steadily grown for years, promoted as a heart-healthy protein source salmon overtook fish sticks in 2003 as the third most popular seafood in the American diet, behind tuna and shrimp 23 million Americans eat salmon more than once a month, most of it farmed (EWG)
Farmed salmon & Prop. 65 2003: The Environmental Working Group (EWG) and the Center for Environmental Health (CEH) have filed legal notice under Proposition 65, of plans to sue the manufacturers, distributors and retailers of farmed salmon over potentially dangerous levels of cancer-causing PCBs in the fish  Brought against 50 of the largest farmed-salmon producers and retailers  2001: fish products represented less than 8% of total US consumption of meat poultry and fish. Out of that salmon represents just 1% of total US consumption (USDA Economic Research Service)
Farmed salmon risk assessment Exposure levels Consumption rates Sport fishers Consumers
American Academy of Pediatrics American Academy of Pediatrics issued a position paper in 1994 supporting breast feeding without testing for PCBs Laboratories do not have standard procedures for testing No established “normal” or “abnormal” levels Was this a wise recommendation?
Alternatives to PCB Silicone fluids Fluorocarbons High molecular weight hydrocarbons Low M.W. chlorinated hydrocarbons High boiling oils and esters Extra precautions needed for fire safety Transformers may need to be reconstructed
Breastfeeding and PCB Human development
Breast feeding – Dutch cohort In 42-month-old children who have been fully breast-fed for at least six weeks as babies, median PCB level at 42 mo was 4½ times as high as that in formula-fed children (0.81 µg/L vs. 0.18 µg/L).  PCB levels in cord blood and human milk, and duration of breast-feeding predict plasma PCB level - each additional week of full breastfeeding result in an increase of 0.3% of the milk PCB level. Conclusion: Lactation is a major source for the child’s PCB body burden at 42 months.
Inuit cohort Reside in Arctic regions of Quebec and Greenland rely on sea mammals (mainly seal, beluga whale, and walrus) as primary sources of protein and lipids in their diet.  have unusually high body burdens of PCBs and other organochlorine compounds early 1990s, collected PCB concentrations in breast milk samples women 7 times higher than the PCB concentrations in Caucasian women residing in southern Quebec (Dewailly et al. 1993)
 
 
Levels in breast milk ATSDR, 2000
Breast Feeding and PCB Jacobson and others (1992) – no association between breast-feeding and developmental deficits in Michigan fish consumers Rogan et al (1991) – no adverse effects from exposure to PCBs or DDE through breast milk in the North Carolina Breast Milk and Formula Project
PCBs Other health effects
PCBs and Cancer Animal studies support association of PCBs and cancer EPA, IARC, NTP considers PCBs to be animal carcinogens Occupational exposure does not seem linked to risk of cancer Yusho – increased liver cancer mortality but includes quaterphenyls, dioxins and furans EPA: animal carcinogens=potential human carcinogens

PCBs

  • 1.
    PCBs – PolychlorinatedBiphenyls Juliann Chen Laura Stachel
  • 2.
    PCBs and Prop65 Background on PCB Physiologic Effects Reproductive Effects Developmental Effects Should store bought salmon be included under Prop 65?
  • 3.
    PCBs No knownnatural sources Belong to class of halogenated aromatic hydrocarbons Family of chemicals with biphenyl nucleus and varying number of chlorine atoms (1 – 10) 209 different congeners – chemical and toxicologic properties vary Toxicity varies with degree of chlorination and position of chlorine atoms
  • 4.
    Properties and IndustrialAppeal Chemical stability over time Resistant to breakdown by light, heat and air High boiling point Not soluble in water Non flammable/low flammability Electrical insulating properties Light, oily fluids to greasy or waxy substances No taste or smell
  • 5.
    Commercial & IndustrialUses Electrical – insulating and cooling Heat exchange and dielectric fluids in capacitors and transformers Hydraulic equipment, hydraulic fluids Plasticizers in paints, plastics and rubber products In pigments, dyes and carbonless paper Adhesives, protective surface coatings for wood Microscope immersion oil Extenders for pesticides Flame retardants
  • 6.
    History of PCBs1800’s first discovered 1929 commercially produced Between 1929 and 1977, 1.1 billion lbs produced in US (Monsanto) At height of production, 5 million lbs produced annually 1960’s – Sweden found PCB in soil and water when studying DDT 1968 - Japan YUSHO – mass poisoning from contaminated rice oil 1979 – Taiwan poisoning (Yucheng) – rice oil contamination 1976 – Toxic Substance Control Act (TSCA) – prohibitions on the manufacture, processing and distribution in commerce 1979 – banning of production in U.S.
  • 7.
    How did theyenter environment? Past disposal of PCB waste products in rivers, streams, open land-fills Improper disposal of PCB-containing equipment or chemical products Intentional release into environment Reduce dust emission on dirt roads Extenders in agricultural pesticides Leakage of sealed PCB fluid compartments during commercial use of transformers and capacitors Leaching/leaking of PCB from malfunctioning heating coils into food Electrical fires – incomplete combustion products more toxic than PCB Ingestion of contaminated fish from contaminated water
  • 8.
    Environmental Cycling Cyclingof PCBs through the environment Volatilization from land and water surfaces into the atmosphere Redeposition back to land and surface water Adsorption to sediments and revolatilization North Atlantic Ocean is the dominant sink for PCBs accounting for 50 – 80% of PCBs in the environment. Major continental reservoir is freshwater sediments in US. High in Great Lakes. Ubiquitous in the environment, including remote places and the Arctic.
  • 9.
    Current Sources ofExposure Contaminated food (90%) Accidental release from existing electrical equipment Improper incineration Occupational exposure Hazardous waste sites
  • 10.
    Who’s at Risk?Fish and wildlife Domestic animals Humans Occupational exposure People living near incinerators, hazardous waste site Recreational fishers People who eat marine products or fresh water fish Offspring of fish consumers
  • 11.
    Bioaccumulation PCBs persistin the environment, concentrating upward in the food chain Adsorb strongly to soil and sediment Taken up by bottom feeding fish and other organisms Transferred through the food chain and biomagnified Stored in fat Half-lives of most congeners from months to years PCB levels in aquatic organisms can be up to one million times higher than the concentration in their aquatic environment
  • 12.
    Levels of PCB1.9 ppm Bottom-feeding and game fish ( EPA, 1992) 20 ppm Fish near hazardous waste sites ( ATSDR, 2000) <20 ppb Background levels in human serum (1980s) 1-2 ppm Human adipose tissue 40-100 ppb Human breast milk 40-100 ppb Recreational fishers
  • 13.
    Pharmacokinetics Absorption byskin, GI or inhalation Storage in fat Liver is primary site of metabolism Hydroxylation and conjugation with glucuronic acid and sulfates Metabolism and excretion dependent on specific molecular structure Percent chlorination inversely related to excretion rate Slow excretion – bioaccumulation occurs even at low exposure levels
  • 14.
    Physiologic Effects DermatologicReproductive and Developmental Effects Neurodevelopmental Endocrine Hepatic Carcinogenic Immune
  • 15.
    Evidence on physiologiceffect Industrial workers – occupational exposure Two episodes of mass poisoning in Japan and Taiwan Studies of adults and children exposed to PCB by consuming contaminated sport fish Background contamination Animal studies
  • 16.
    Difficulties of HumanStudies Assessing Exposures Concurrent Exposures, confounding variables Total PCB levels vs. Specific congeners Commercial products vs. degraded PCB products level of contaminants and breakdown products Biomarkers differ between studies Body compartment distribution Lifetime bioaccumulation vs. new exposure
  • 17.
    Reproductive Effects Animaland Human studies
  • 18.
    Reproduction - AnimalStudies Rats, Mice Rabbits Minks Monkeys Commercial mixtures Single congeners Contaminated fish Experimental mixtures Different dosings
  • 19.
    Animal Reproductive Effects Female Male Prolonged estrus cycle rates Decreased sexual receptivity Reduced implantation rates Decreased conception Increased abortions, resorptions or stillbirths Reduced seminal vesicles and epididymal weights Decreased mating success Reduced fertility in offspring Decreased epididymal sperm count Decreased number of implants and offspring
  • 20.
    Reproductive Effects -Women Taylor et al, (1989 ) no apparent effect of occupational exposure to various Aroclor mixtures on mean number of pregnancies Mendola et al. (1997 ) Great Lakes fish consumption associated with shorter menstrual cycle. No increased in spontaneous fetal death (1995) Gelhard et al (1998) PCB level assoc with history of miscarriage but not future pregnancy outcome Buck et al (1997, 1999, 2000) One cohort of Great Lakes fish eaters indicated that women were more likely to have positive associations with conception delay than their exposed husbands Courval et al (1999) association between conception delay and Great Lakes fish consumption in exposed men, but not in their wives Conclusion: Effects of PCB on human conception is unclear
  • 21.
    Reproductive Effects –Men Hauser (2003) studied 212 male partners of subfertile couples at Mass General Hosp 57 PCP congeners and DDE measured Dose-response relation among PCB-138 and sperm motility and morphology Inverse relationship of same sperm parameters with sum of PCBs, & PCBs that induce CYP450 Suggest different toxicity between congeners Environ Health Perspect. 2003 Sep;111(12):1505-11
  • 22.
    Reproductive Effects -Men Dallinga (2002) – compared PCB levels in men with poor semen quality to levels in men with normal semen quality – no difference Within subgroup of men with normal semen quality - Sperm count and sperm motility were inversely related to PCB metabolite concentrations Hum Reprod. 2002 Aug;17(8):1973-9.
  • 23.
    Reproductive Effects (cont) Guo (2002) – follow of offspring from 1979 Taiwan poisoning shows sperm of exposed children with increased abnormal morphology, reduced motility, decreased sperm penetration Guo, Lancet. 2000 Oct 7; 356:1240-1. CONCLUSION: Studies suggest specific congeners may affect sperm parameters
  • 24.
    Human Development BirthWeight and Gestational Age
  • 25.
    Birth Weight andGestational Age Jacobson -Michigan cohort (fish consumption): decrease in gestational age (4.9 days), BW (160-190 g), head circ. (0.6 cm) Taylor – N.Y.(occupational exposure): small decrease in birth weight and gestational age (33 gm)
  • 26.
    Birthweight and GestationalAge Lake Ontario fisheaters – no assoc of prenatal PCB with BW, HC or GA (Lonky, 1996) North Carolina – no assoc of BW, HC and PCB Netherlands – prenatal PCB exposure assoc with reduced BW, not HC Association gone at 3 months in breast fed infants Smith (1984) Wisconsin PCB associated with higher birthweight
  • 27.
    Increase 72 Wisconsinfish eaters Smith Decrease 179 Netherlands Pantandin No change 912 North Carolina background Rogan No change Lake Ontario fisheaters Lonky Decrease 200 Occupational exposure Taylor Decrease 241 Michigan fish eaters Jacobson Birthweight number Location Study
  • 28.
  • 29.
    Neurodevelopmental Studies Accidentalpoisoning Japan Taiwan Fish Consumption Michigan Oswego (New York) General population Rotterdam-Groningen - Netherlands (Dutch) Dusseldorf, Germany North Carolina Inuit Children (Canada), Collaborative Perinatal Project (U.S.), Child Health and Development Study (CA)
  • 30.
  • 31.
    Neurodevelopment Yusho andYu-Cheng experience
  • 32.
    Yusho (1968) -Japan 1300 people ill after consuming rice bran oil contaminated with 2000 – 3000 ppm of PCB heat-transfer agent Disease: Severe chloracne, dark brown pigmentation, ocular swelling High rate of stillbirth, newborns small size, discolored skin & nails, premature teeth Follow-up of a subset of children showed lethargy, hypotonia, jerkiness, clumsy movement, apathy, and low IQ. Raised concern about potential neurotoxicity of PCBs
  • 33.
    Yucheng: Taiwan, 1979 prenatal exposure Intrauterine growth retardation Hyperbilirubinemia, hyperpigmentation, acne, abnormal teeth, nails, gingiva Later childhood – lower weight and height Lower IQ (4 pts) and behavioral disorders Contaminated rice oil contained PCDFs as thermal degradation products. Level of PCB intake 1000-fold> U.S. intake
  • 34.
    Mean Difference inFull Mental Scales – Taiwan
  • 35.
  • 36.
    Michigan Cohort 313 infants, Maternal fish consumption in 242 Exposure estimated between 168 and 3012 ppb, PCB of cord serum, maternal serum and milk Maternal serum level 6.1 ppb in fish eating group, 4.1 ppb in no fish group Testing at birth, 5 months, 7 months, 4 years and 11 years Fein et al, 1984; Jacobson et al. 1984, 1990, 1996, 1997 Methodology flaws – exposure data based on recall Cord PCB below detection limits in 70%, maternal serum in 22% poor correlation of fish consumption and cord PCB levels lack of testing for concurrent toxicant exposures, exposed women consumed more alcohol and caffeine, took more cold medication during pregnancy, lower weight
  • 37.
    Michigan cohort resultsBirth –neuromuscular immaturity, greater startle and weaker reflexes associated with fish consumption but not cord PCB levels 7 months – impaired visual recognition memory assoc with cord PCB levels and fish consumption 4 years –declines in cognition and memory assoc with prenatal PCB exposure in the most highly exposed children 11 years – prenatal PCB exposure associated with lower full-scale and verbal IQ scores, poorer word comprehension and reading comprehension
  • 38.
    Oswego Cohort Lonkyet al (1996): 569 mothers with Lake Ontario fish consumption, enrolled 1991-1994 3 groups: high, low and no fish consumption High maternal fish consumption assoc with less mature autonomic responses and increased abnormal reflexes in newborns Stewart et al (1999): 279 women Heavy chlorinated PCB congeners most valid index of fish-borne exposure Poor NBAS performance associated with highly chlorinated PCBs
  • 39.
  • 40.
    North Carolina Cohort880 women with background exposure, 931 infants PCB levels in cord blood, placenta, maternal serum at birth and 6 weeks, milk and formula samples (birth, 6 wk, 3 mo, 6 mo) Evaluations at <1, 6, 12, 18 and 24 months Newborn – PCB levels associated with hyporeflexia and general tone 6 and 12 months – Bayley scales showed PCB assoc with psychomotor delay, not Mental Development Index 18 and 24 mos: similar effects, though not significant 3, 4 and 5 years: Deficits not apparent on McCarthy scales
  • 41.
    Collaborative Perinatal Project12 U.S. sites , 1207 women, 1959-1965 Maternal serum PCB levels 8 month olds no relation between the maternal prenatal PCB level and the children’s mental or motor development as measured by the Bayley Scales of Infant Development. Psychomotor score varied by center, some showed increased PDI, others showed decrease ( Daniels et al. 2003)
  • 42.
    Dutch cohort 418infants born between 1990-1992 Compare breast-fed vs. formula-fed infants Collected maternal plasma in last month of pregnancy, cord plasma, maternal milk samples Measured PCBs (118, 138, 153, 180) in all biological samples Measured PCDDs and PCDFs measured in breast milk samples
  • 43.
    Dutch cohort (cont)at 10-21 days: breast fed infants had decreased tone and NOS values (Neurologic Optimality Score) at 3, 7, 18 months: Bayley assessments at 3 mo: PDI inversely associated with prenatal PCB levels, breast feeding did not effect PDI Bayley assessments at 18 mo: none of exposure measures associated with PDI at 18 mo : Neurologic exam higher maternal and cord plasma associated with lower NOS values Plasma and milk PCB levels neither related to NOS nor motor fluency PCBs in maternal plasma associated with K-ABC scores at 42 mo: Neurologic exam Neither postnatal exposure nor current body burden associated with K-ABC or RDLS scores Cognitive deficits, especially in formula-fed associated with prenatal PCB levels
  • 44.
    Schantz et al.2003 Dutch cohort (cont)
  • 45.
    D ü sseldorf(Germany) cohort 171 mother-infant pairs (1993-1995) Cord plasma and maternal milk samples Specific congeners and sum PCB levels Only first- or second-born infants from German speaking families and no illnesses or complications during pregnancy or delivery were included Families were primarily middle and upper class At 7 months, milk PCB levels (but not cord levels) related to poorer performance on MDI cognitive test but not FTII
  • 46.
    Faroe Islands BirthCohorts Diet high in fish, whale meat and blubber Maternal milk PCB levels higher than other studies 1 st cohort: 1022 children, born 1986-1987 Cord blood, maternal hair, umbilical cord tissue for PCB and mercury Neuropsych assessment at 7 years – general lack of effects, PCB level suggestive for deficit in Boston Naming Test only
  • 47.
    Faroe Islands cohort(cont.) Second cohort 182 children (1994-1995) Maternal serum, cord blood, and milk PCB Analyzed for congeners Neurologic exam at 2 weeks with no assoc of PCB exposure and neurologic exams, muscle tone and reflexes
  • 48.
  • 49.
    Difficulties Comparing HumanStudies Selection bias – different populations studied Breast feeding PCB exposure levels, congener mix and rate of intake during pregnancy Differences in choice and timing of outcome assessment Confounding variables – concurrent exposure to other neurotoxins
  • 50.
  • 51.
    Prop 65 andPCB Should salmon carry warning labels? Should breast milk?
  • 52.
    PCBs and Prop65 – Should we be concerned? Ban on manufacture, processing, distribution and use of PCBs in all products that were not totally enclosed since 1977 Decreasing use of PCBs Efforts to remediate contamination sites PCB levels in humans are decreasing Neurodevelopment data inconsistent Most recent concern in PCB intake from fish
  • 53.
    Primary source ofexposure - diet Courtesy of the BC Salmon Farmers Association
  • 54.
    FDA allowable tolerancelimits 0.2 Finished animal feed for food producing animals (except feed concentrates, feed supplements, and feed premixes) 3 Red meat 0.2 Infant and junior foods 0.3 Eggs 3 Poultry 1.5 Cow Milk / Dairy (fat) 2 Fish (fat) Concentration (ppm) Commodity
  • 55.
    Salmon While bothfarmed and wild salmon PCB levels were at least 40 times lower than the FDA’s safety level, farmed salmon contained higher levels than wild salmon ( Science 2004) Attributed this to the fish used for fish feed Feed companies are exploring ways to reduce the PCBs in the feed ingredients
  • 56.
  • 57.
    Farmed salmon BerkeleyBowl: discontinued most farmed salmon, both as a result of the reports and because supplier switched the type of salmon sold salmon is the fish department’s biggest seller Salmon sales steadily grown for years, promoted as a heart-healthy protein source salmon overtook fish sticks in 2003 as the third most popular seafood in the American diet, behind tuna and shrimp 23 million Americans eat salmon more than once a month, most of it farmed (EWG)
  • 58.
    Farmed salmon &Prop. 65 2003: The Environmental Working Group (EWG) and the Center for Environmental Health (CEH) have filed legal notice under Proposition 65, of plans to sue the manufacturers, distributors and retailers of farmed salmon over potentially dangerous levels of cancer-causing PCBs in the fish Brought against 50 of the largest farmed-salmon producers and retailers 2001: fish products represented less than 8% of total US consumption of meat poultry and fish. Out of that salmon represents just 1% of total US consumption (USDA Economic Research Service)
  • 59.
    Farmed salmon riskassessment Exposure levels Consumption rates Sport fishers Consumers
  • 60.
    American Academy ofPediatrics American Academy of Pediatrics issued a position paper in 1994 supporting breast feeding without testing for PCBs Laboratories do not have standard procedures for testing No established “normal” or “abnormal” levels Was this a wise recommendation?
  • 61.
    Alternatives to PCBSilicone fluids Fluorocarbons High molecular weight hydrocarbons Low M.W. chlorinated hydrocarbons High boiling oils and esters Extra precautions needed for fire safety Transformers may need to be reconstructed
  • 62.
    Breastfeeding and PCBHuman development
  • 63.
    Breast feeding –Dutch cohort In 42-month-old children who have been fully breast-fed for at least six weeks as babies, median PCB level at 42 mo was 4½ times as high as that in formula-fed children (0.81 µg/L vs. 0.18 µg/L). PCB levels in cord blood and human milk, and duration of breast-feeding predict plasma PCB level - each additional week of full breastfeeding result in an increase of 0.3% of the milk PCB level. Conclusion: Lactation is a major source for the child’s PCB body burden at 42 months.
  • 64.
    Inuit cohort Residein Arctic regions of Quebec and Greenland rely on sea mammals (mainly seal, beluga whale, and walrus) as primary sources of protein and lipids in their diet. have unusually high body burdens of PCBs and other organochlorine compounds early 1990s, collected PCB concentrations in breast milk samples women 7 times higher than the PCB concentrations in Caucasian women residing in southern Quebec (Dewailly et al. 1993)
  • 65.
  • 66.
  • 67.
    Levels in breastmilk ATSDR, 2000
  • 68.
    Breast Feeding andPCB Jacobson and others (1992) – no association between breast-feeding and developmental deficits in Michigan fish consumers Rogan et al (1991) – no adverse effects from exposure to PCBs or DDE through breast milk in the North Carolina Breast Milk and Formula Project
  • 69.
  • 70.
    PCBs and CancerAnimal studies support association of PCBs and cancer EPA, IARC, NTP considers PCBs to be animal carcinogens Occupational exposure does not seem linked to risk of cancer Yusho – increased liver cancer mortality but includes quaterphenyls, dioxins and furans EPA: animal carcinogens=potential human carcinogens