Downloaded 134 times
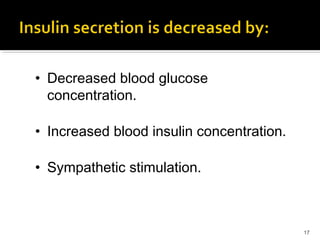
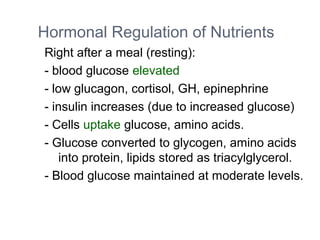
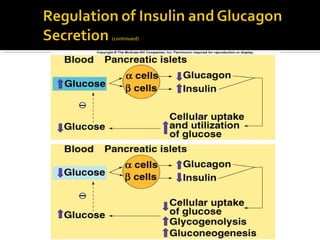
![ Mainly regulated by blood [glucose].
Lesser effect: blood [amino acid].
Regulated by negative feedback.
Glucose enters the brain by facilitated
diffusion.
Normal fasting [glucose] is 70-110 mg/dl.](https://image.slidesharecdn.com/pancreas-140609083830-phpapp02/85/Pancreas-28-320.jpg)
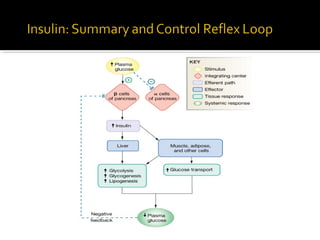
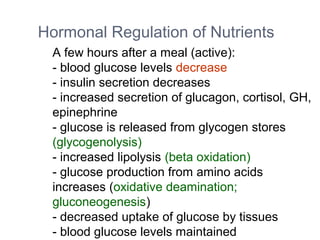
![ When blood [glucose] increases:
Glucose binds to GLUT2 receptor protein in
β cells, stimulating the production and release
of insulin.
Insulin:
Stimulates skeletal muscle cells and adipocytes
to incorporate GLUT4 (glucose facilitated
diffusion carrier) into plasma membranes.
▪ Promotes anabolism.](https://image.slidesharecdn.com/pancreas-140609083830-phpapp02/85/Pancreas-29-320.jpg)
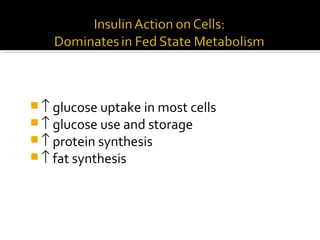
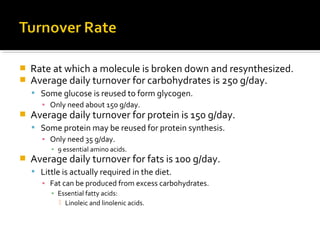
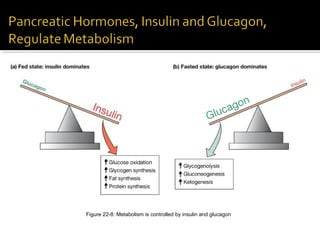
![ Insulin is the major hormone that promotes
anabolism in the body.
When blood [insulin] increases:
Promotes cellular uptake of glucose.
Stimulates glycogen storage in the liver and muscles.
Stimulates triglyceride storage in adipose cells.
Promotes cellular uptake of amino acids and synthesis of
proteins.](https://image.slidesharecdn.com/pancreas-140609083830-phpapp02/85/Pancreas-34-320.jpg)
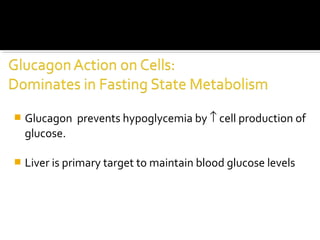
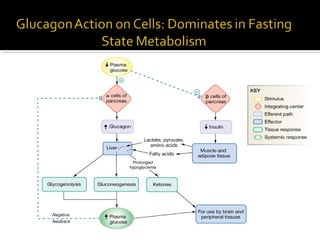
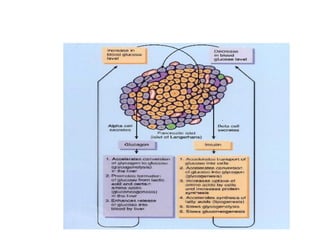
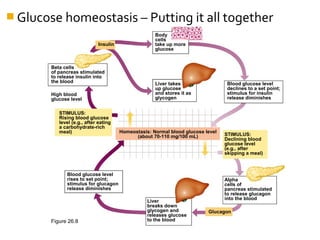
![ Maintains blood glucose concentration.
When blood [glucagon] increased:
Stimulates glycogenolysis in the liver (glucose-
6-phosphatase).
Stimulates gluconeogenesis.
Skeletal muscle, heart, liver, and kidneys use
fatty acids as major source of fuel (hormone-
sensitive lipase).
Stimulates lipolysis and ketogenesis.](https://image.slidesharecdn.com/pancreas-140609083830-phpapp02/85/Pancreas-35-320.jpg)
![ Chronic high blood [glucose].
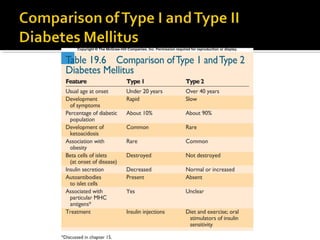
2 forms of diabetes mellitus:
Type I: insulin dependent diabetes (IDDM).
Type II: non-insulin dependent diabetes (NIDDM).](https://image.slidesharecdn.com/pancreas-140609083830-phpapp02/85/Pancreas-38-320.jpg)
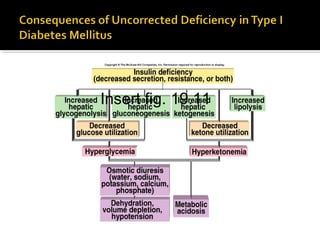
![ β cells of the islets of Langerhans are destroyed
by autoimmune attack which may be provoked
by environmental agent.
Killer T cells target glutamate decarboxylase in the β
cells.
Glucose cannot enter the adipose cells.
Rate of fat synthesis lags behind the rate of lipolysis.
▪ Fatty acids converted to ketone bodies, producing
ketoacidosis.
Increased blood [glucagon].
Stimulates glycogenolysis in liver.](https://image.slidesharecdn.com/pancreas-140609083830-phpapp02/85/Pancreas-40-320.jpg)
![ Slow to develop.
Genetic factors are
significant.
Occurs most often in
people who are
overweight.
Decreased sensitivity to
insulin or an insulin
resistance.
Obesity.
Do not usually develop
ketoacidosis.
May have high blood
[insulin] or normal
[insulin].
Insert fig. 19.12](https://image.slidesharecdn.com/pancreas-140609083830-phpapp02/85/Pancreas-42-320.jpg)
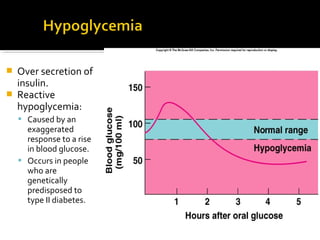
![ Measurement of
the ability of β
cells to secrete
insulin.
Ability of insulin to
lower blood
glucose.
Normal person’s
rise in blood
[glucose] after
drinking solution is
reversed to normal
in 2 hrs.
Insert fig. 19.8](https://image.slidesharecdn.com/pancreas-140609083830-phpapp02/85/Pancreas-46-320.jpg)

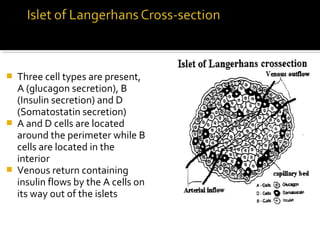
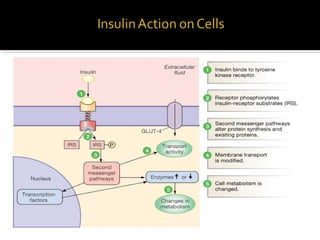
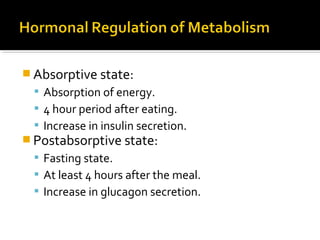
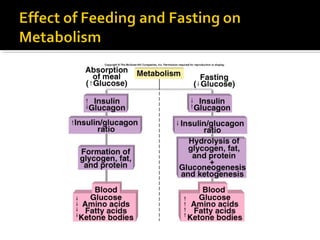
The pancreas regulates carbohydrate metabolism through the hormones insulin and glucagon. Insulin promotes anabolism by stimulating glucose uptake and glycogen/lipid synthesis. Glucagon promotes catabolism by stimulating glycogenolysis and gluconeogenesis to maintain blood glucose levels. Disorders like diabetes occur when insulin/glucagon secretion is impaired, leading to chronic high or low blood glucose.


