
Downloaded 149 times
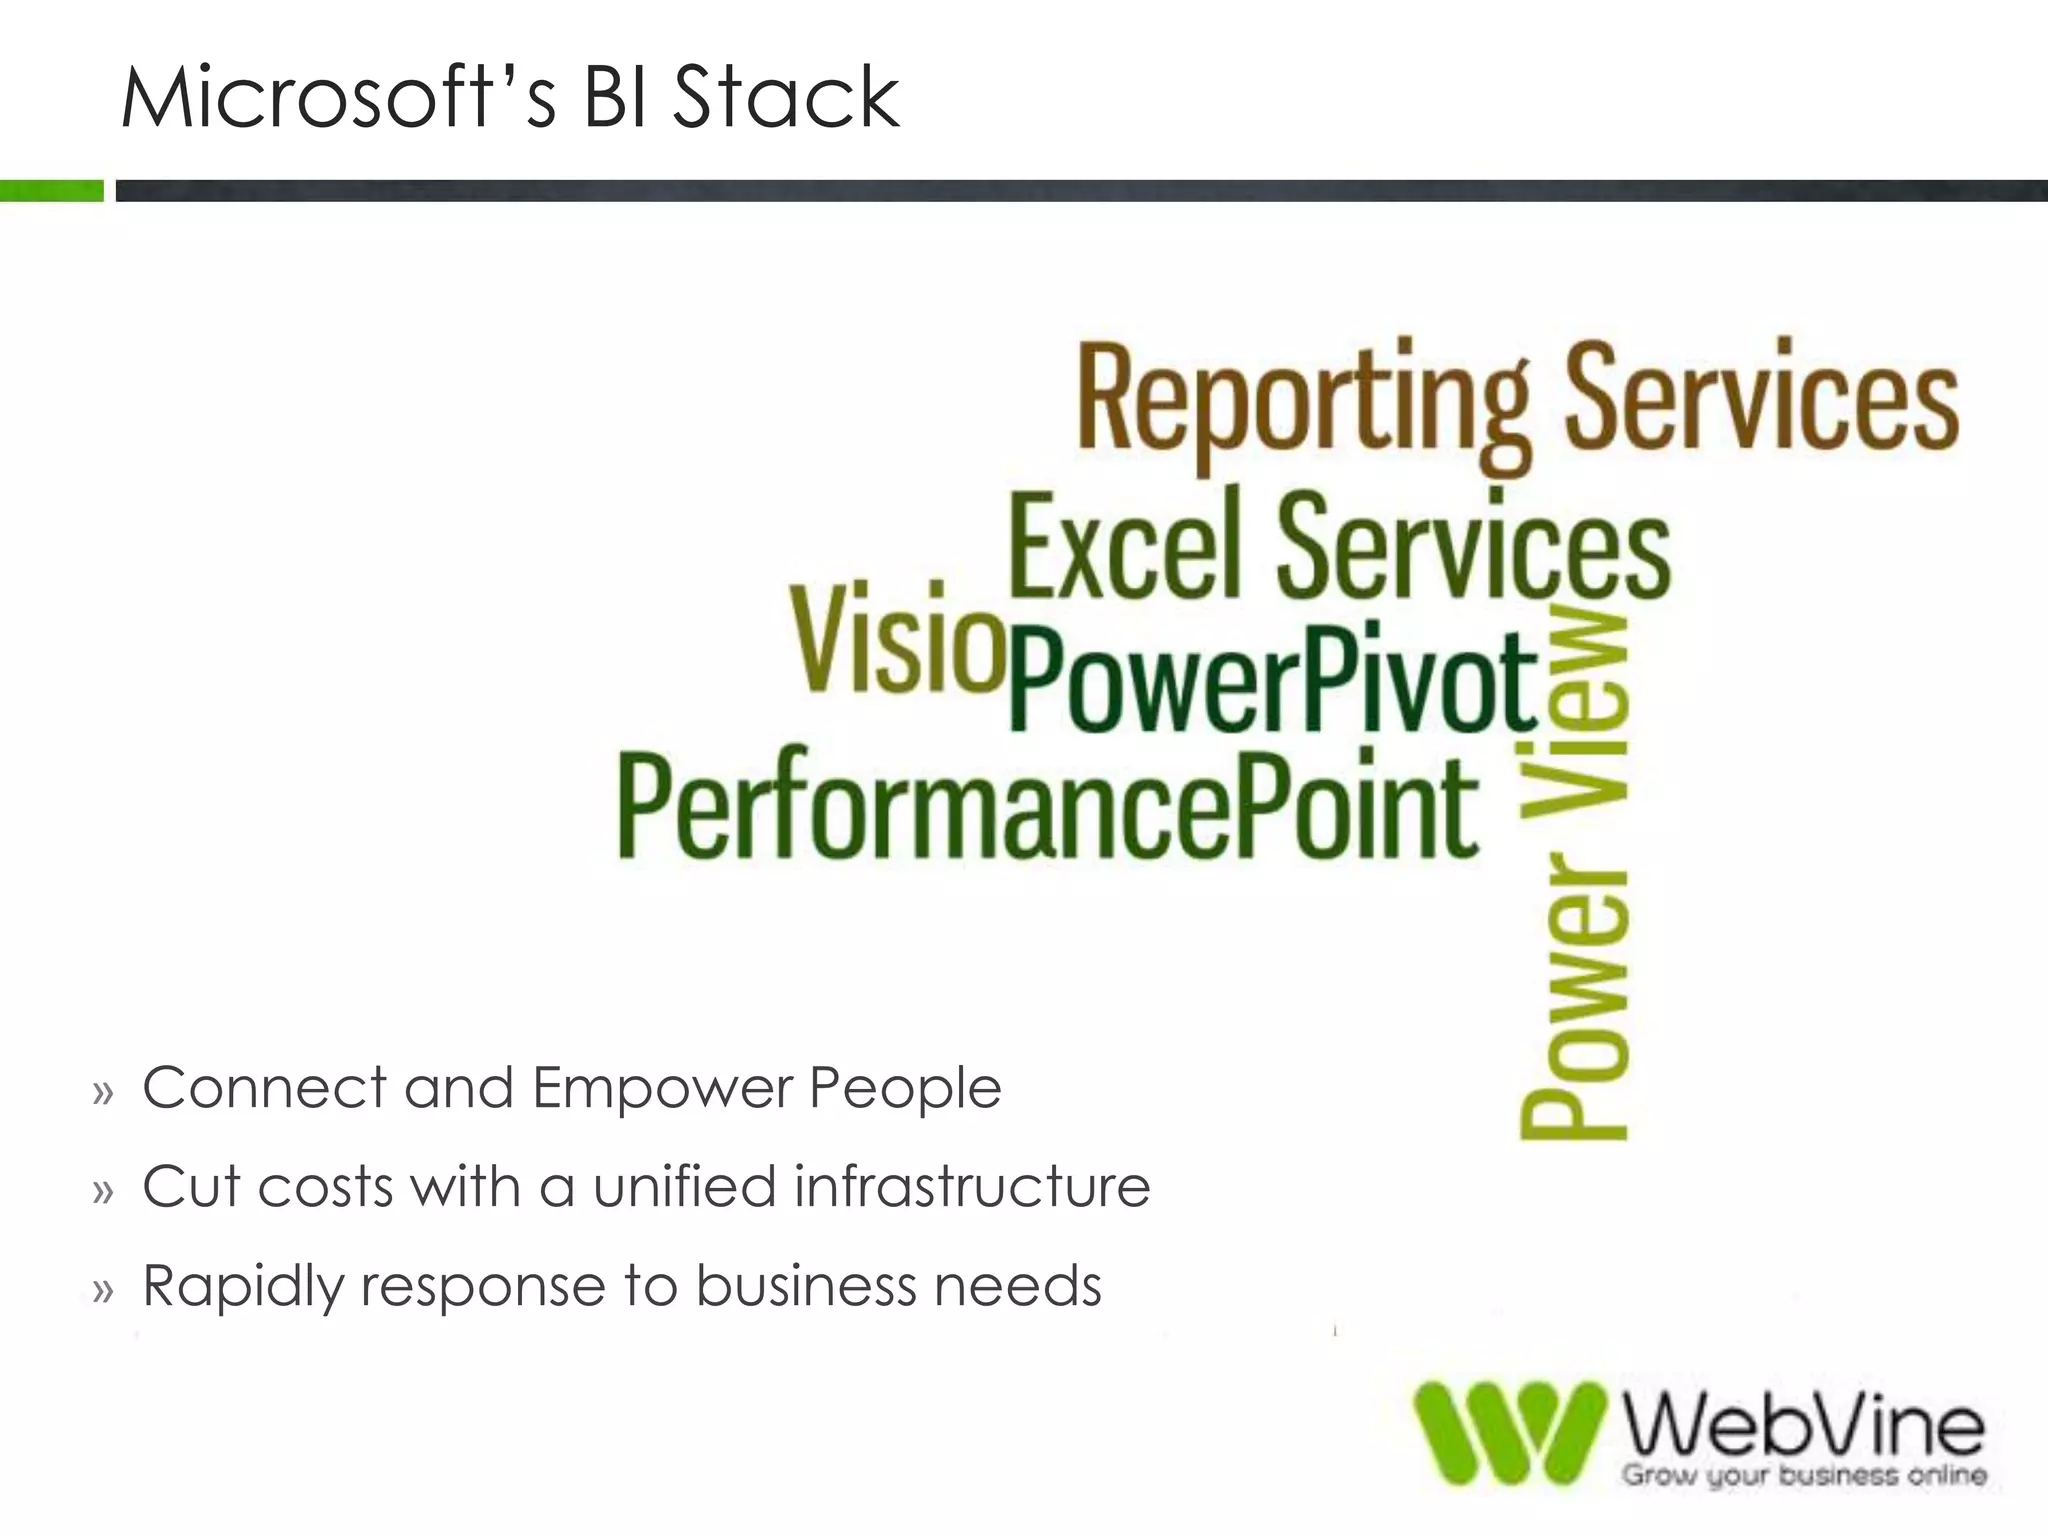
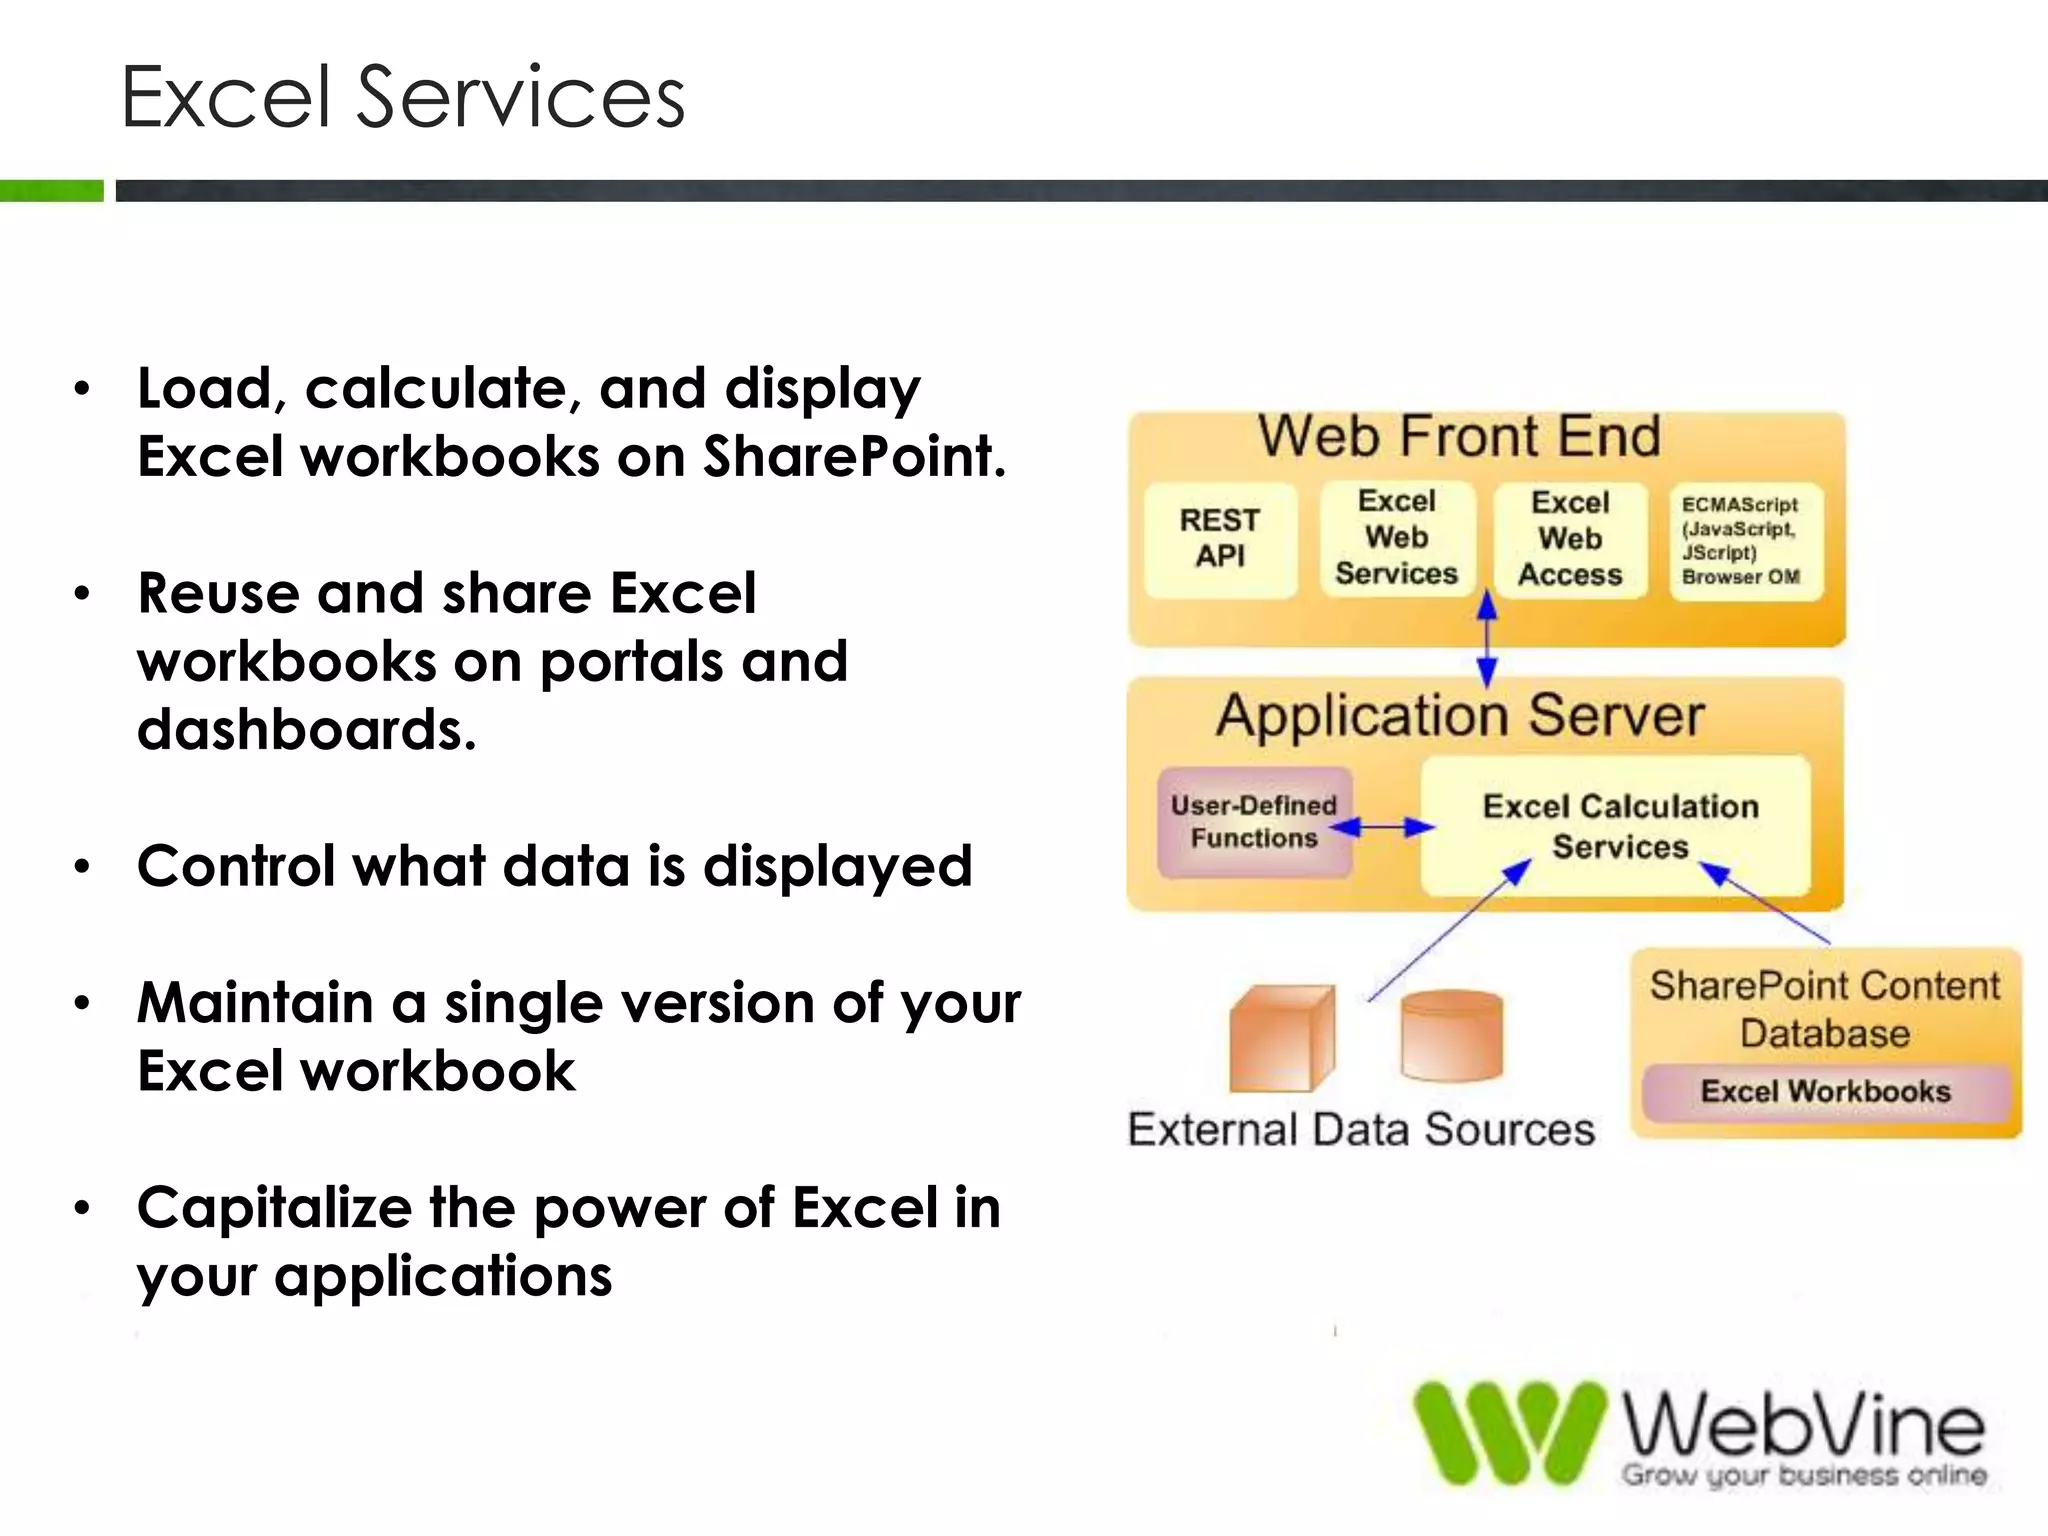
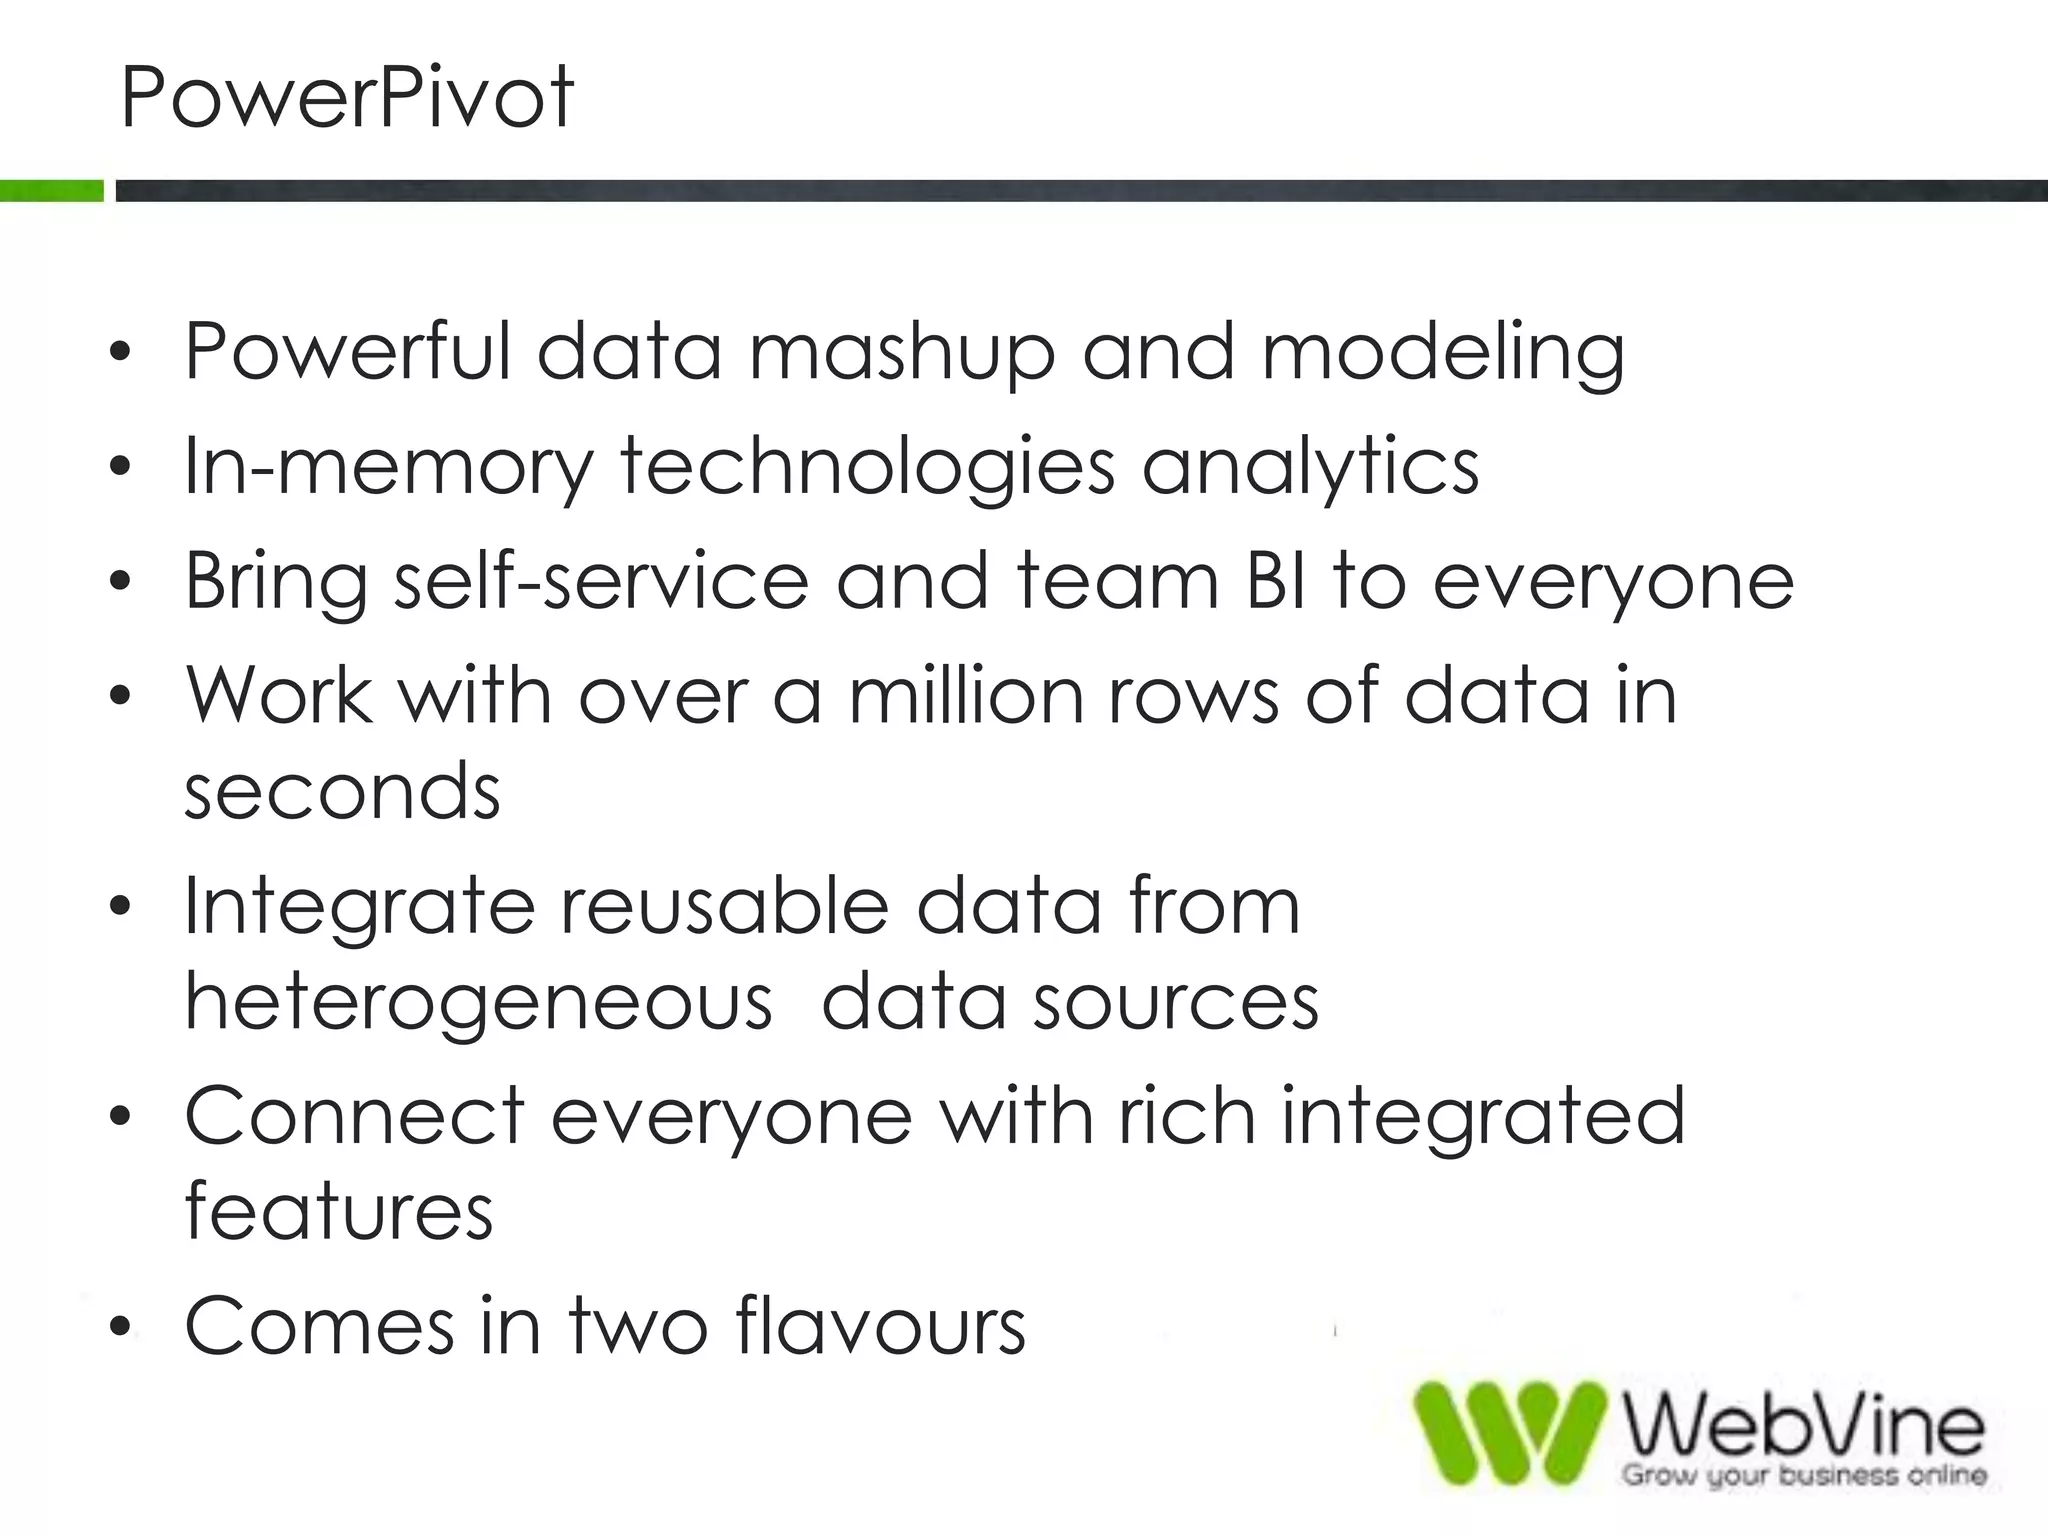
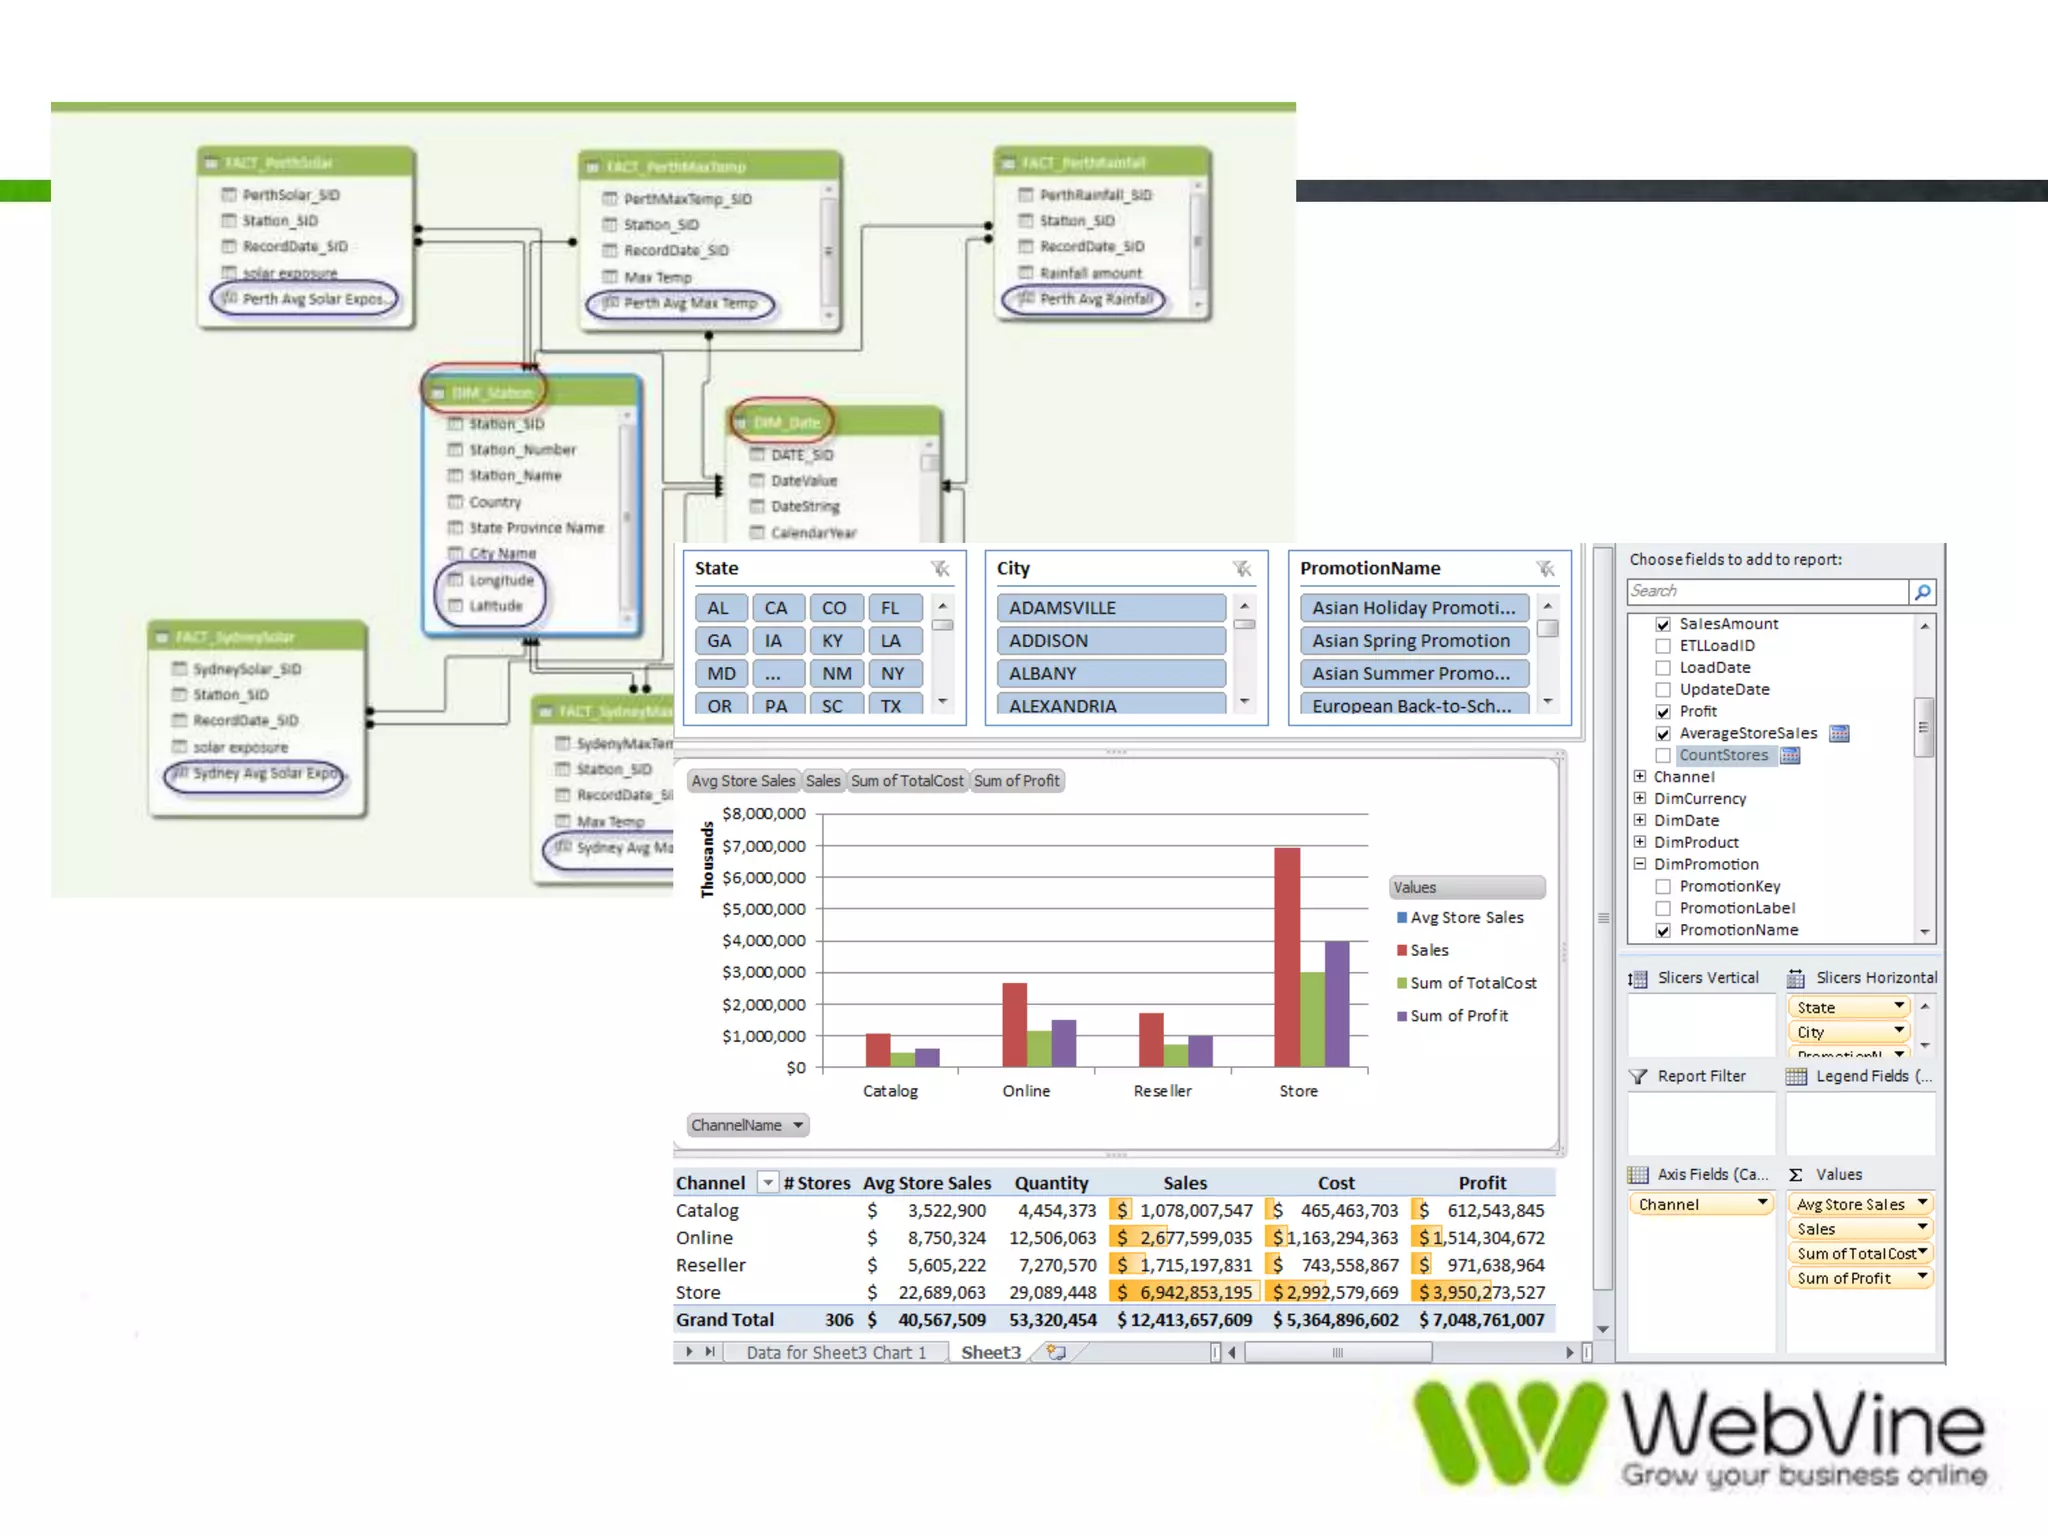
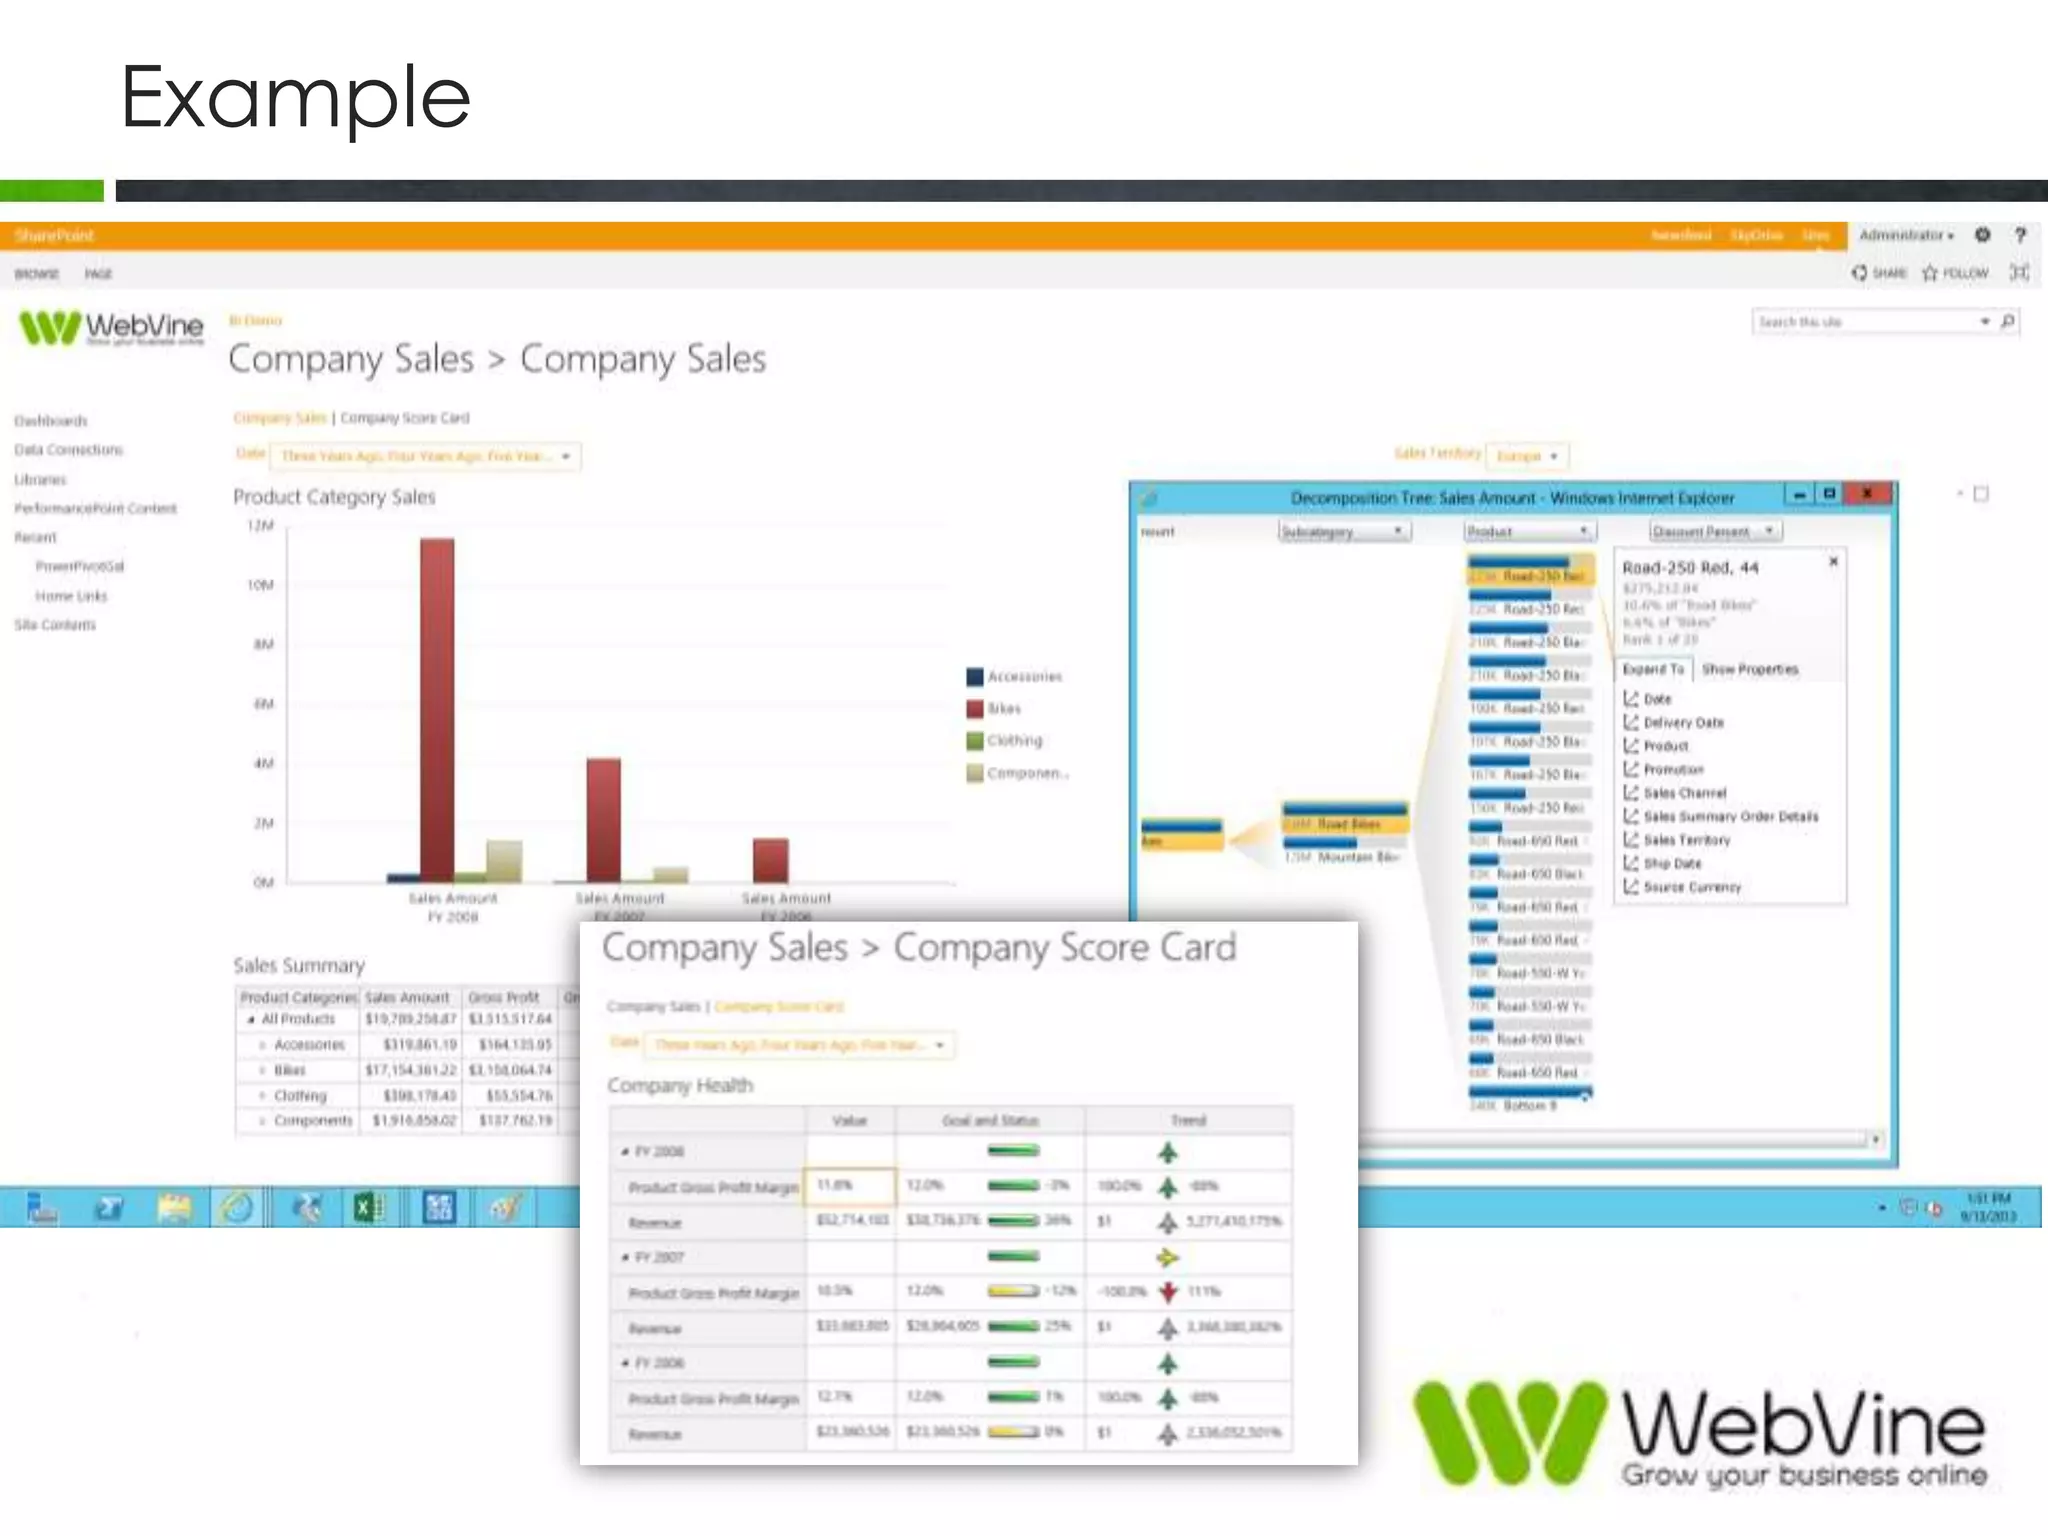
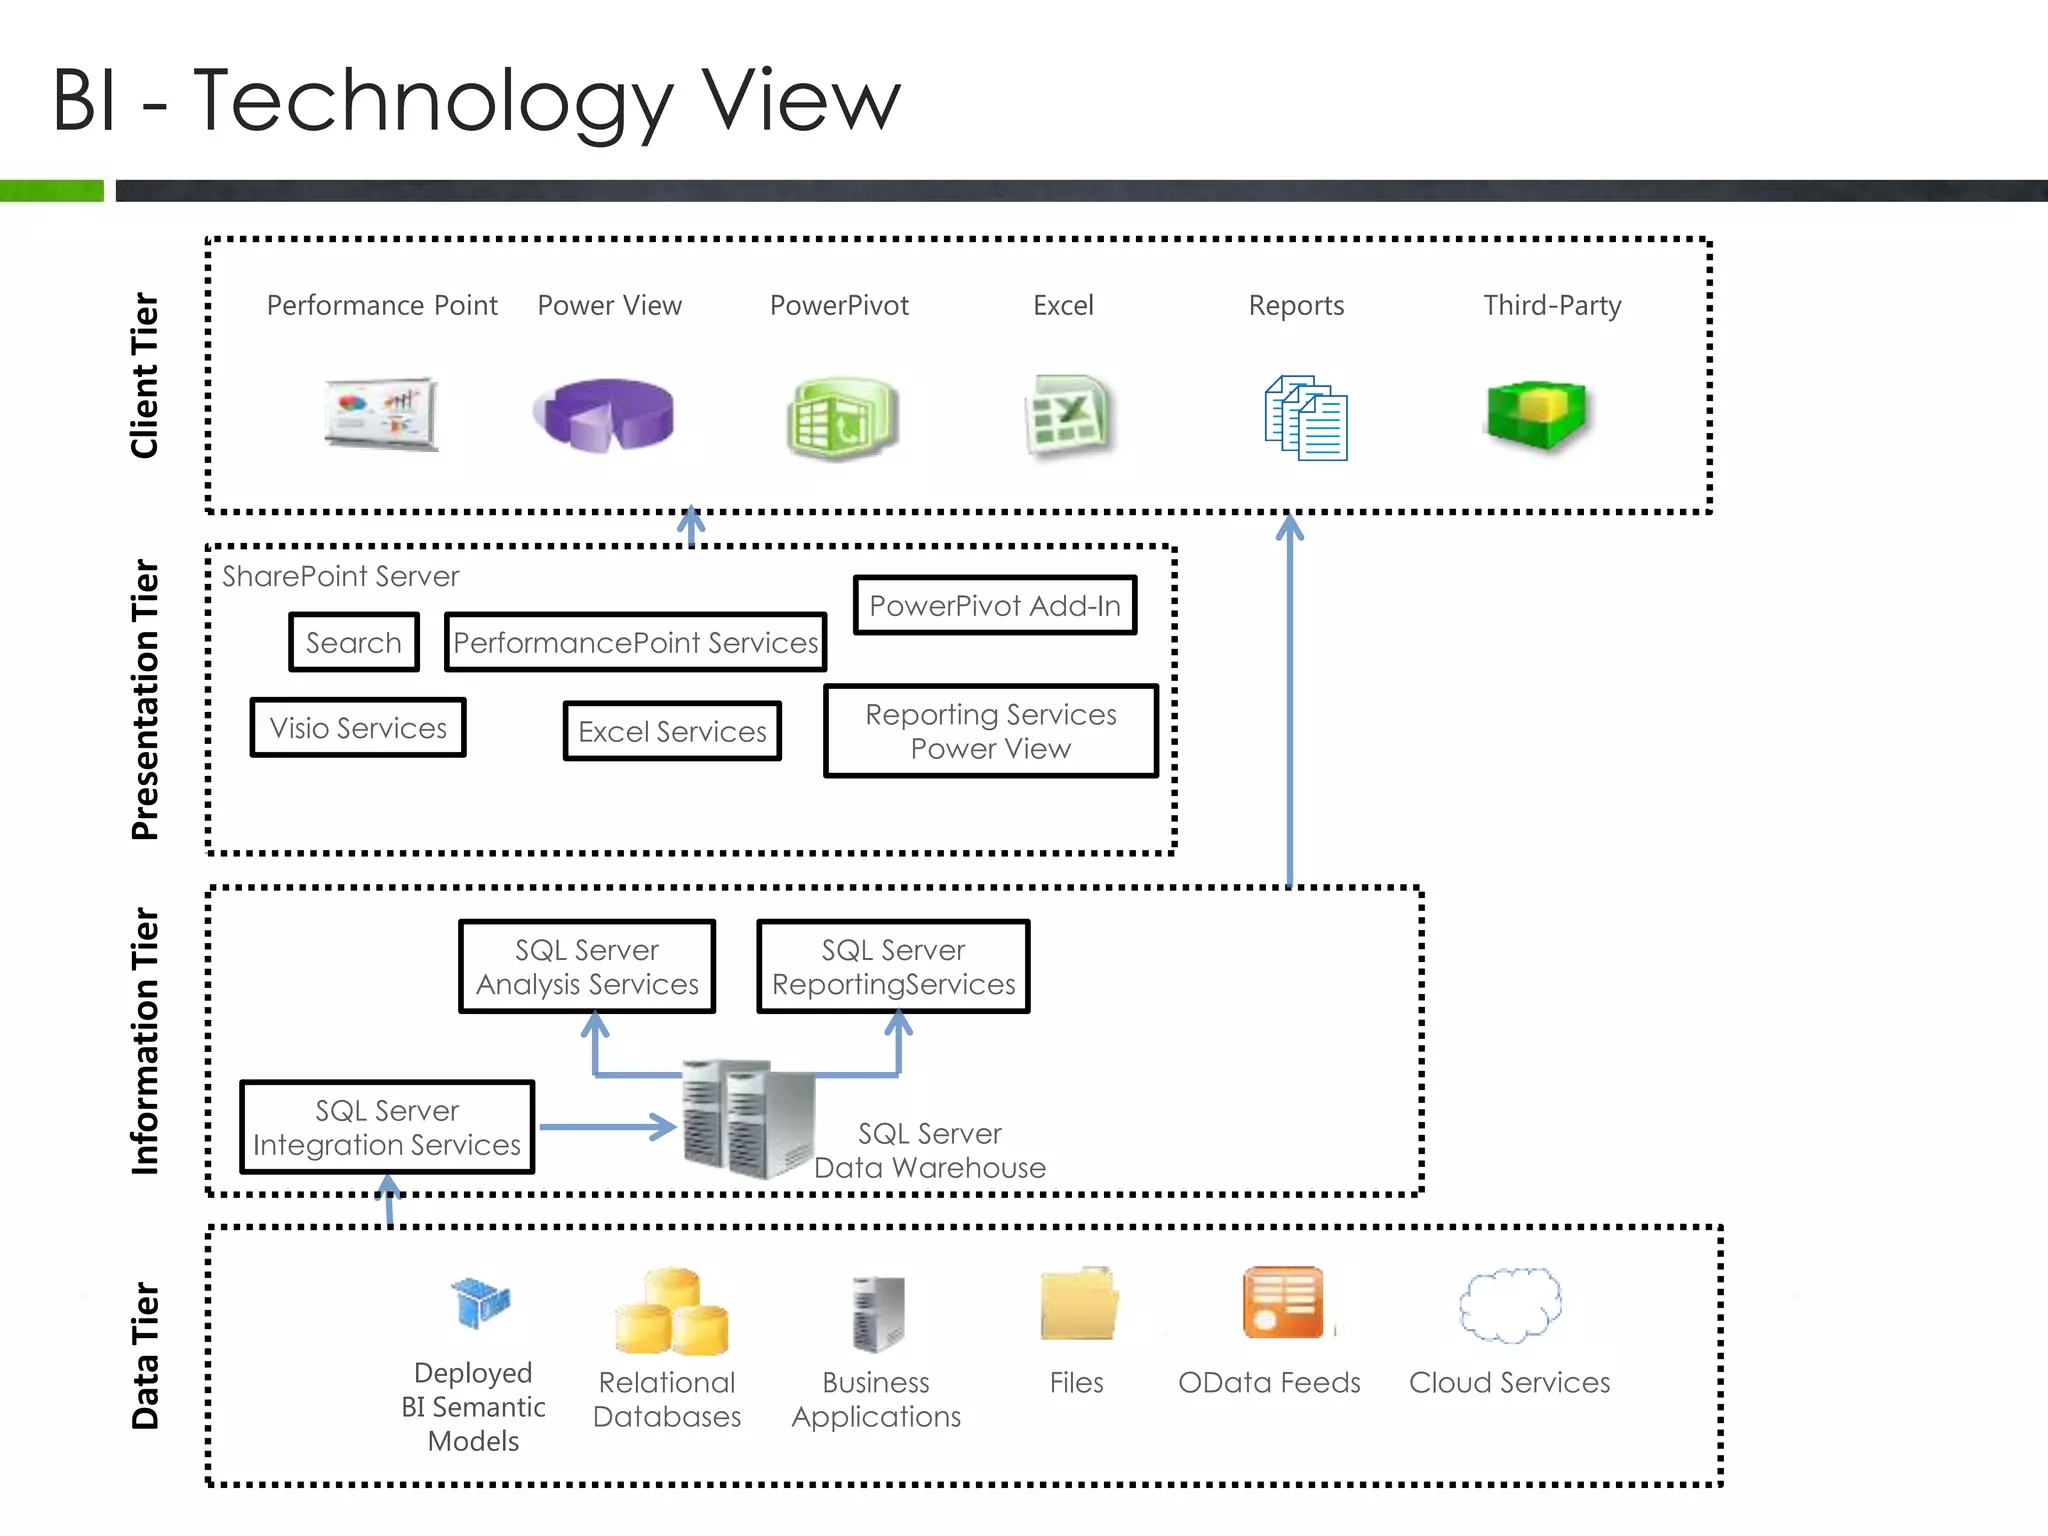
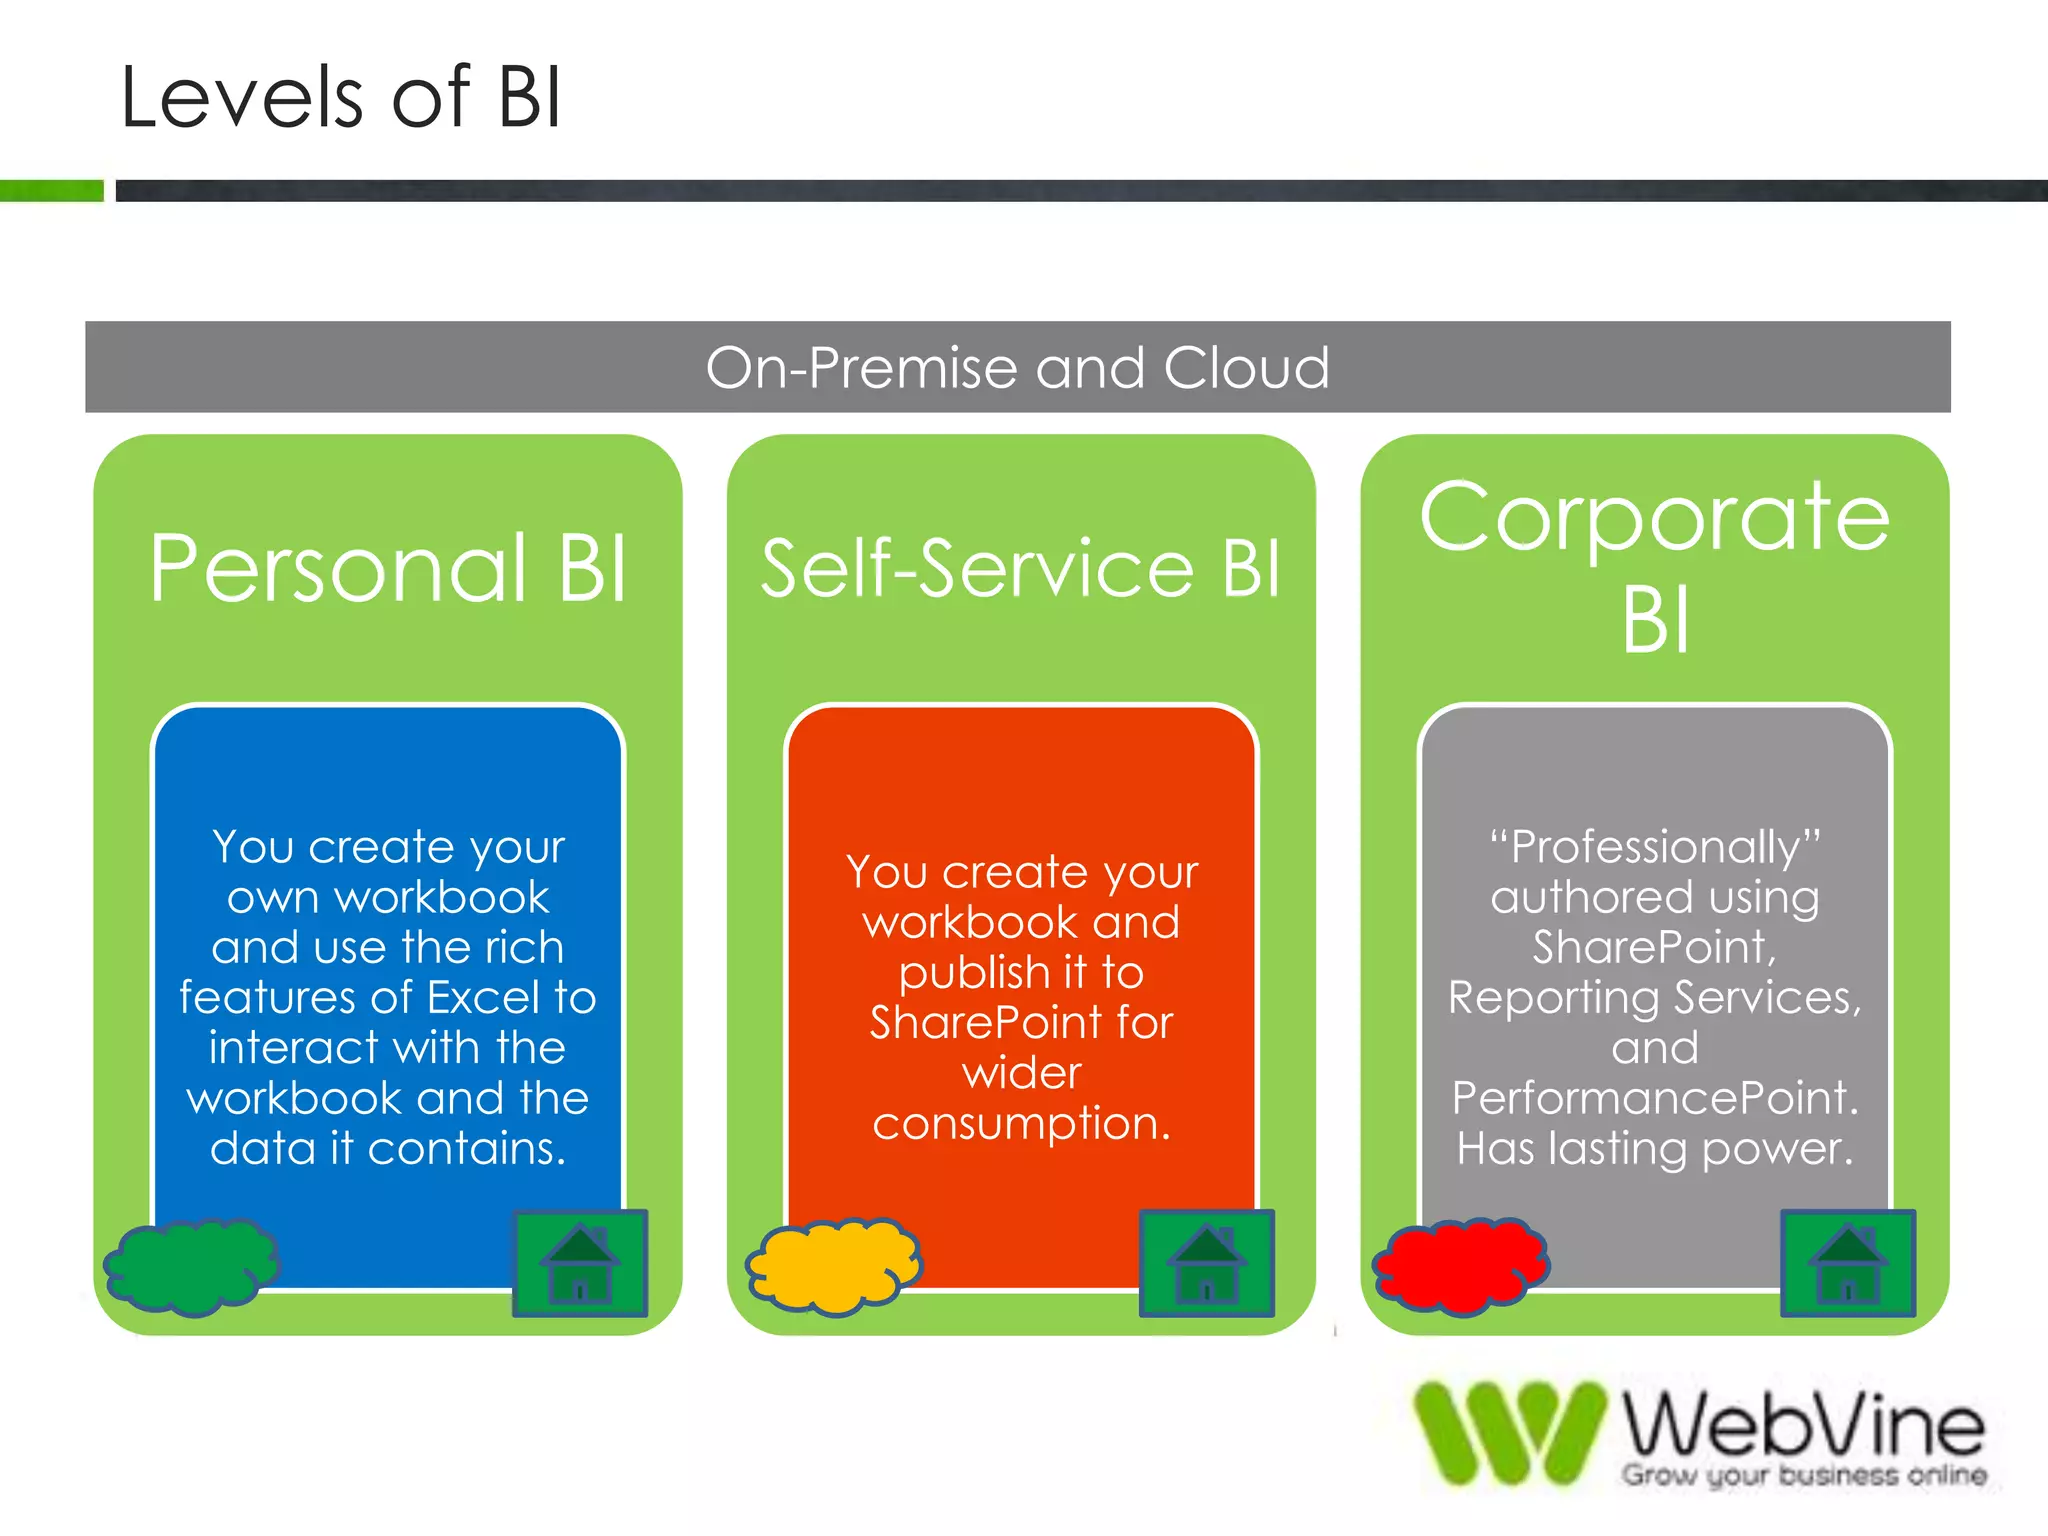
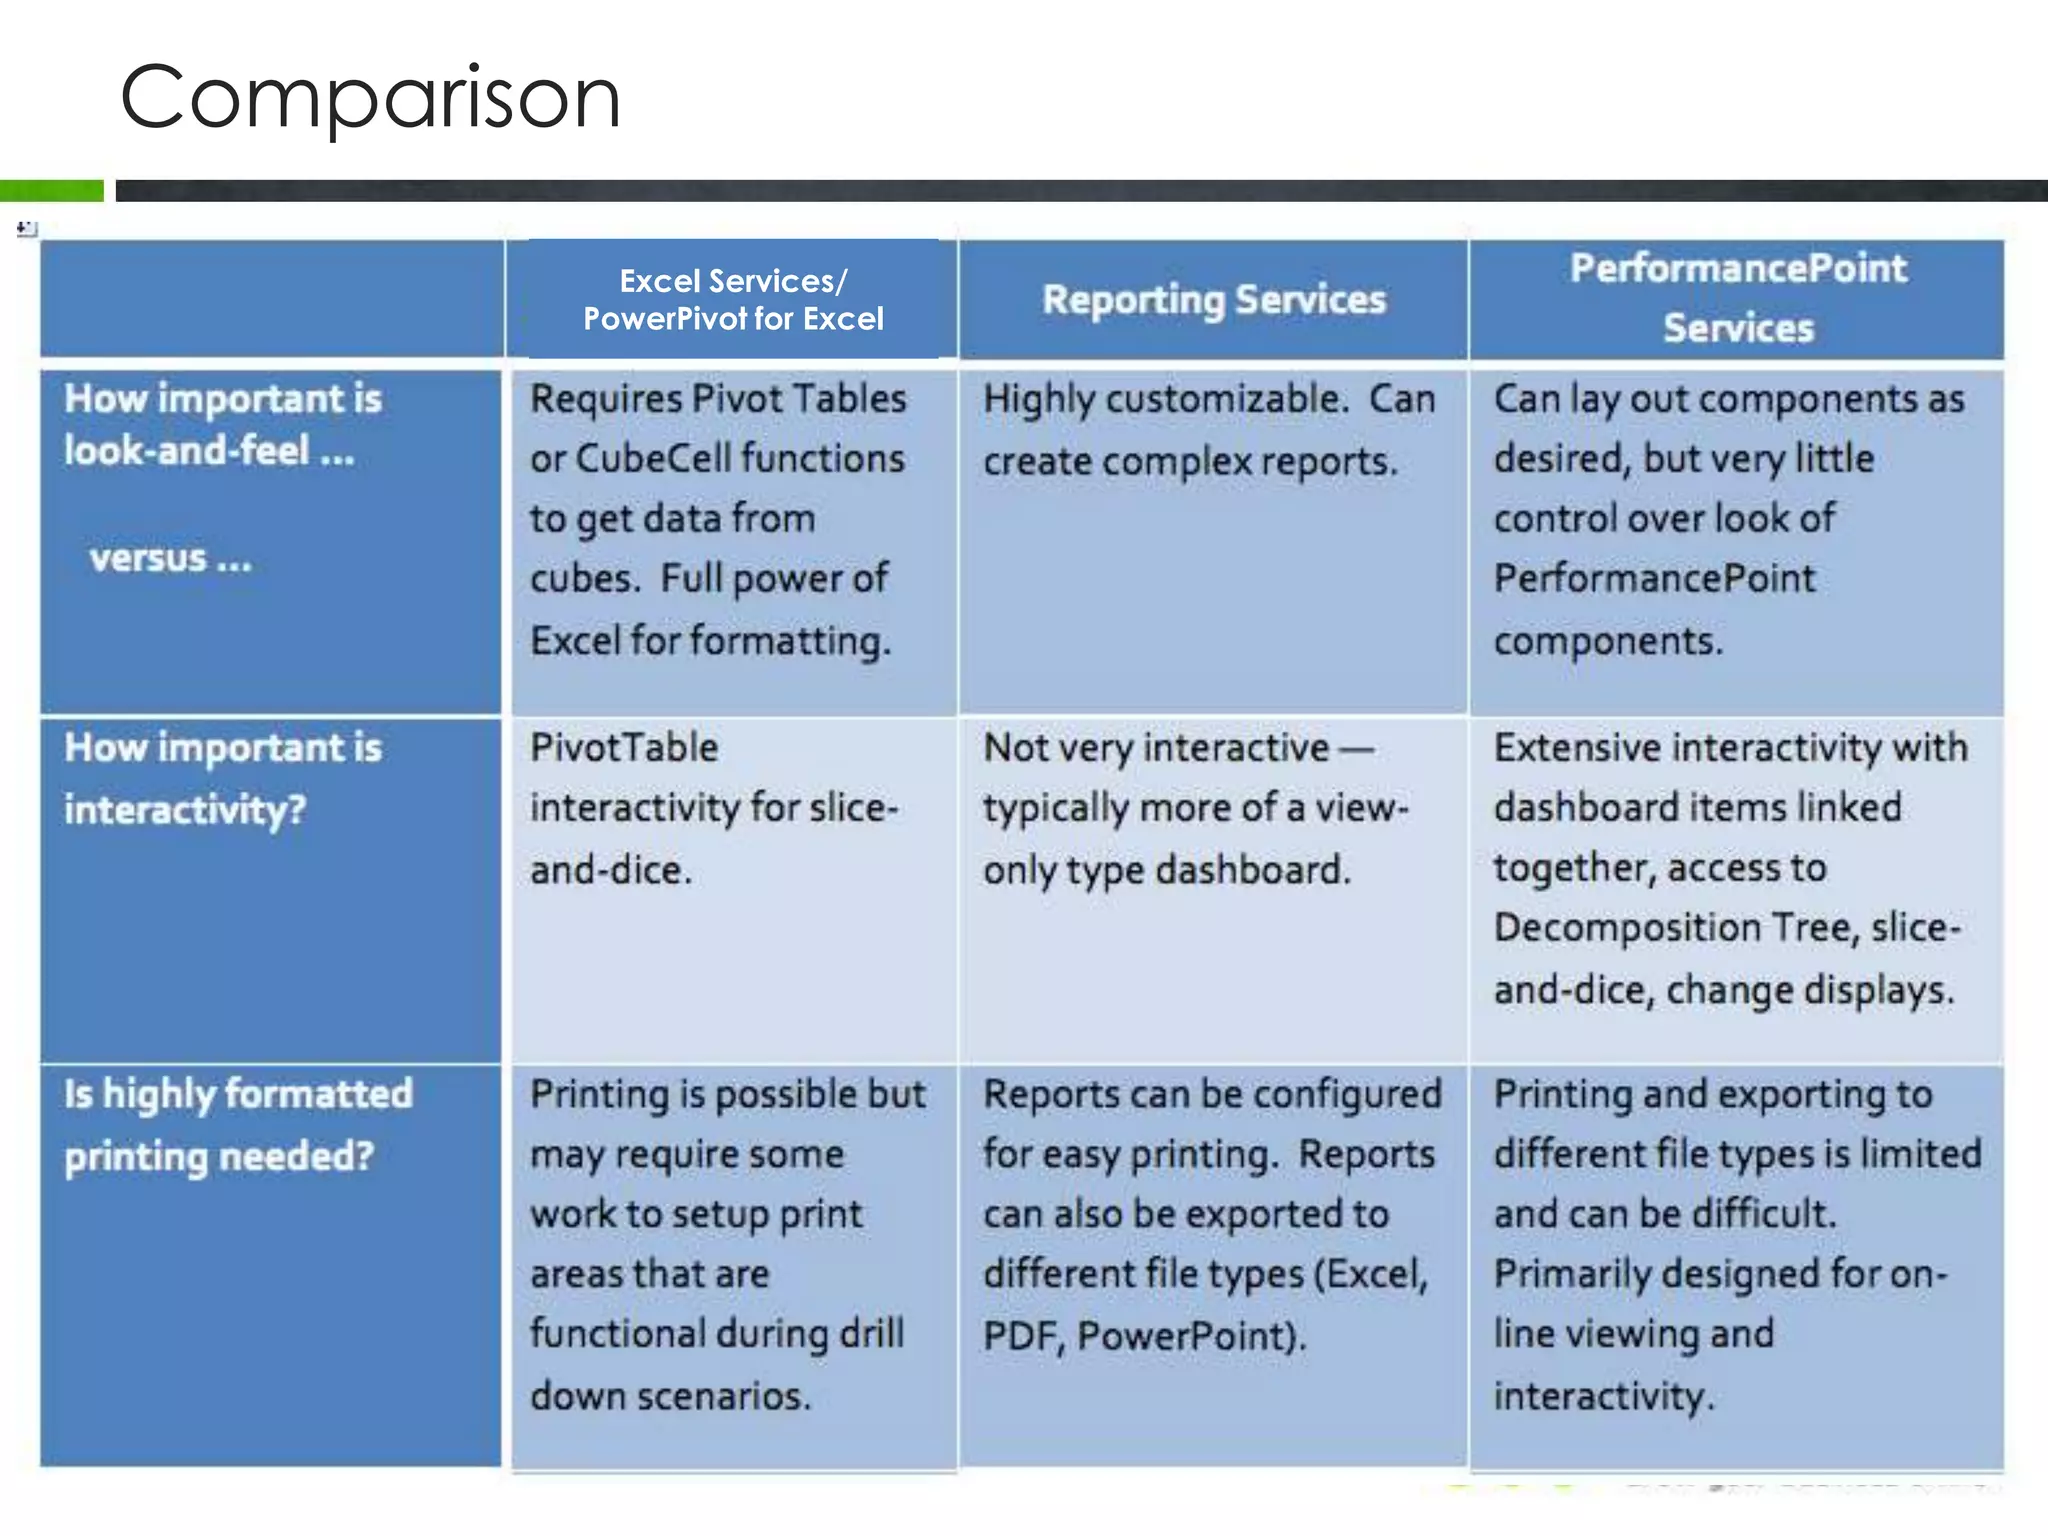
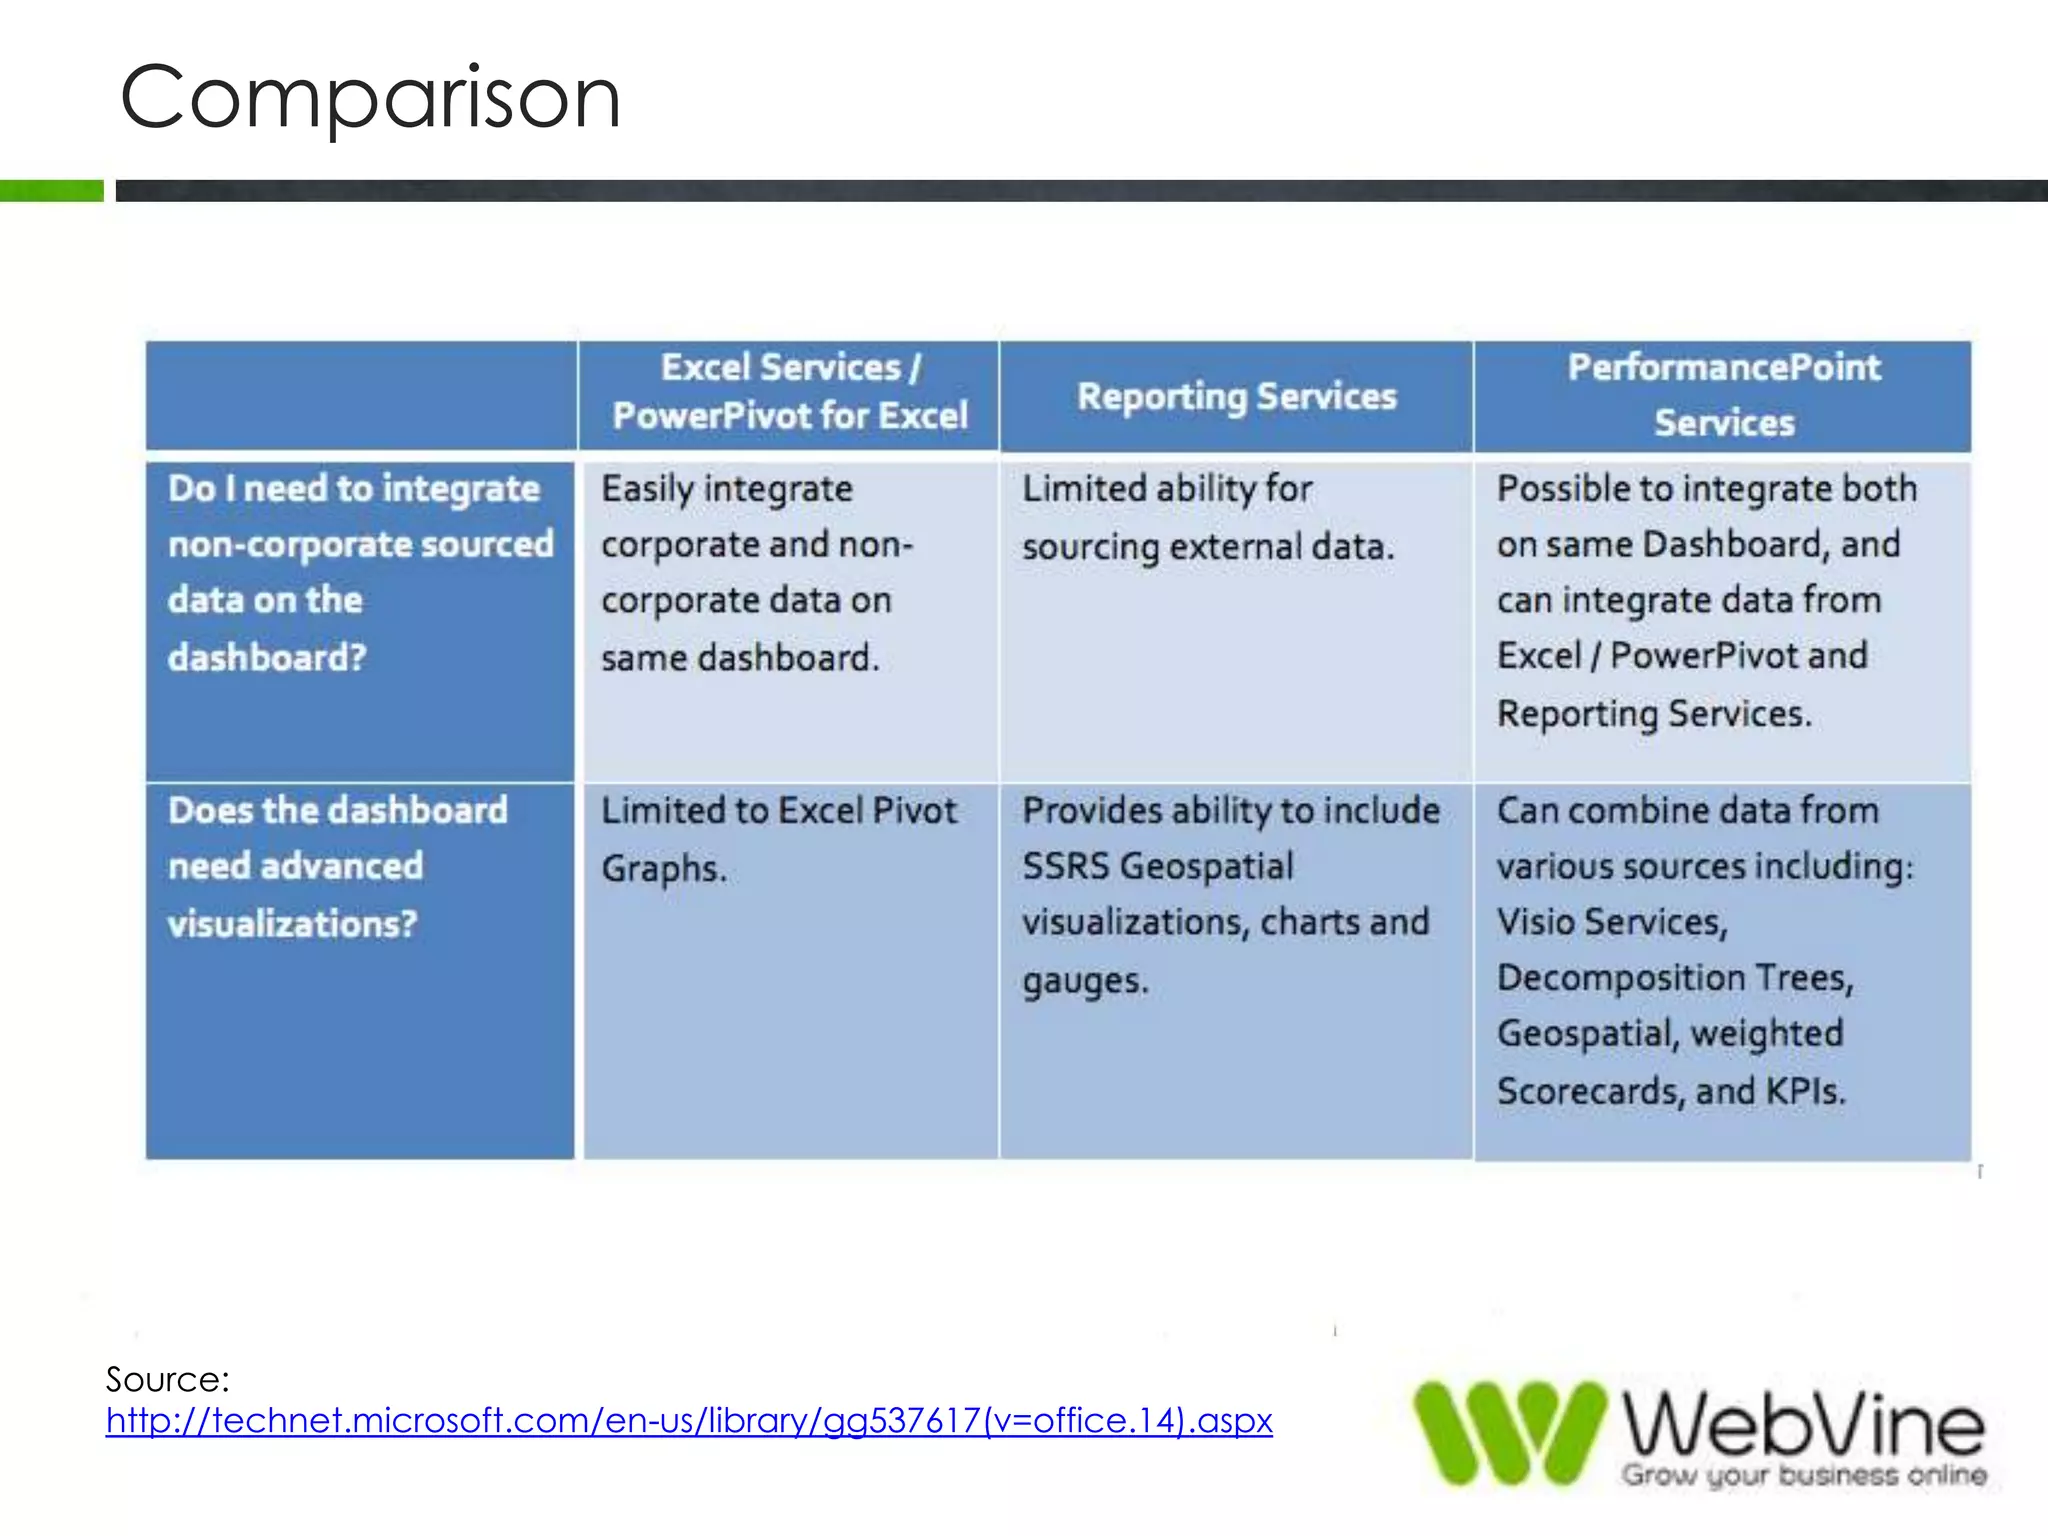
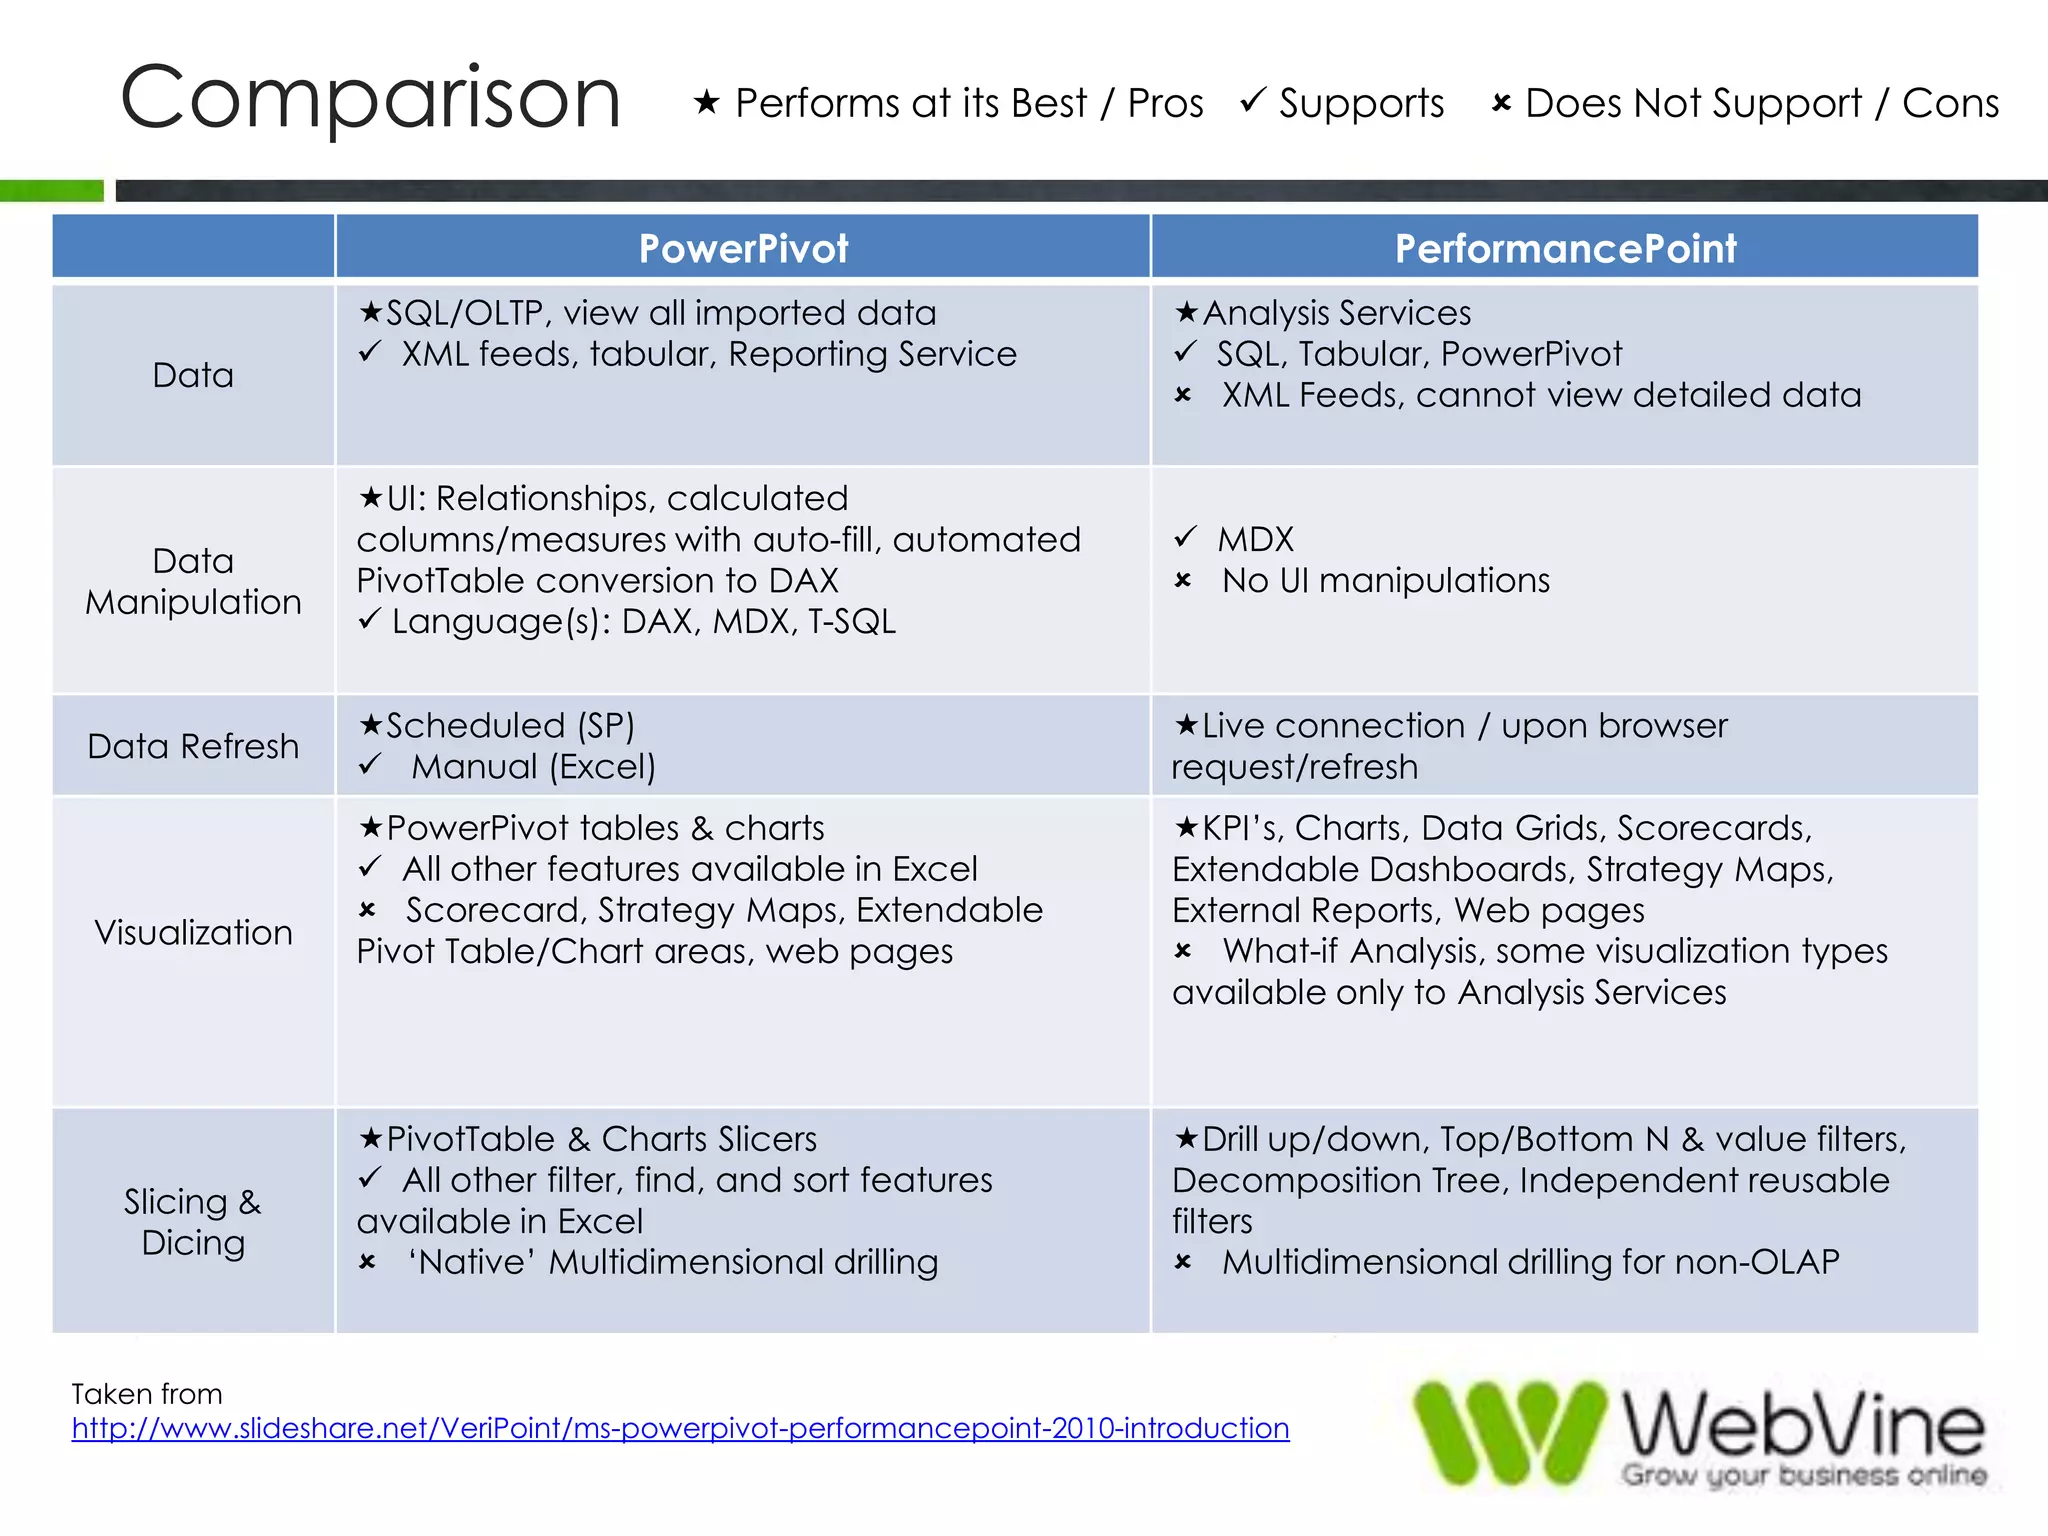
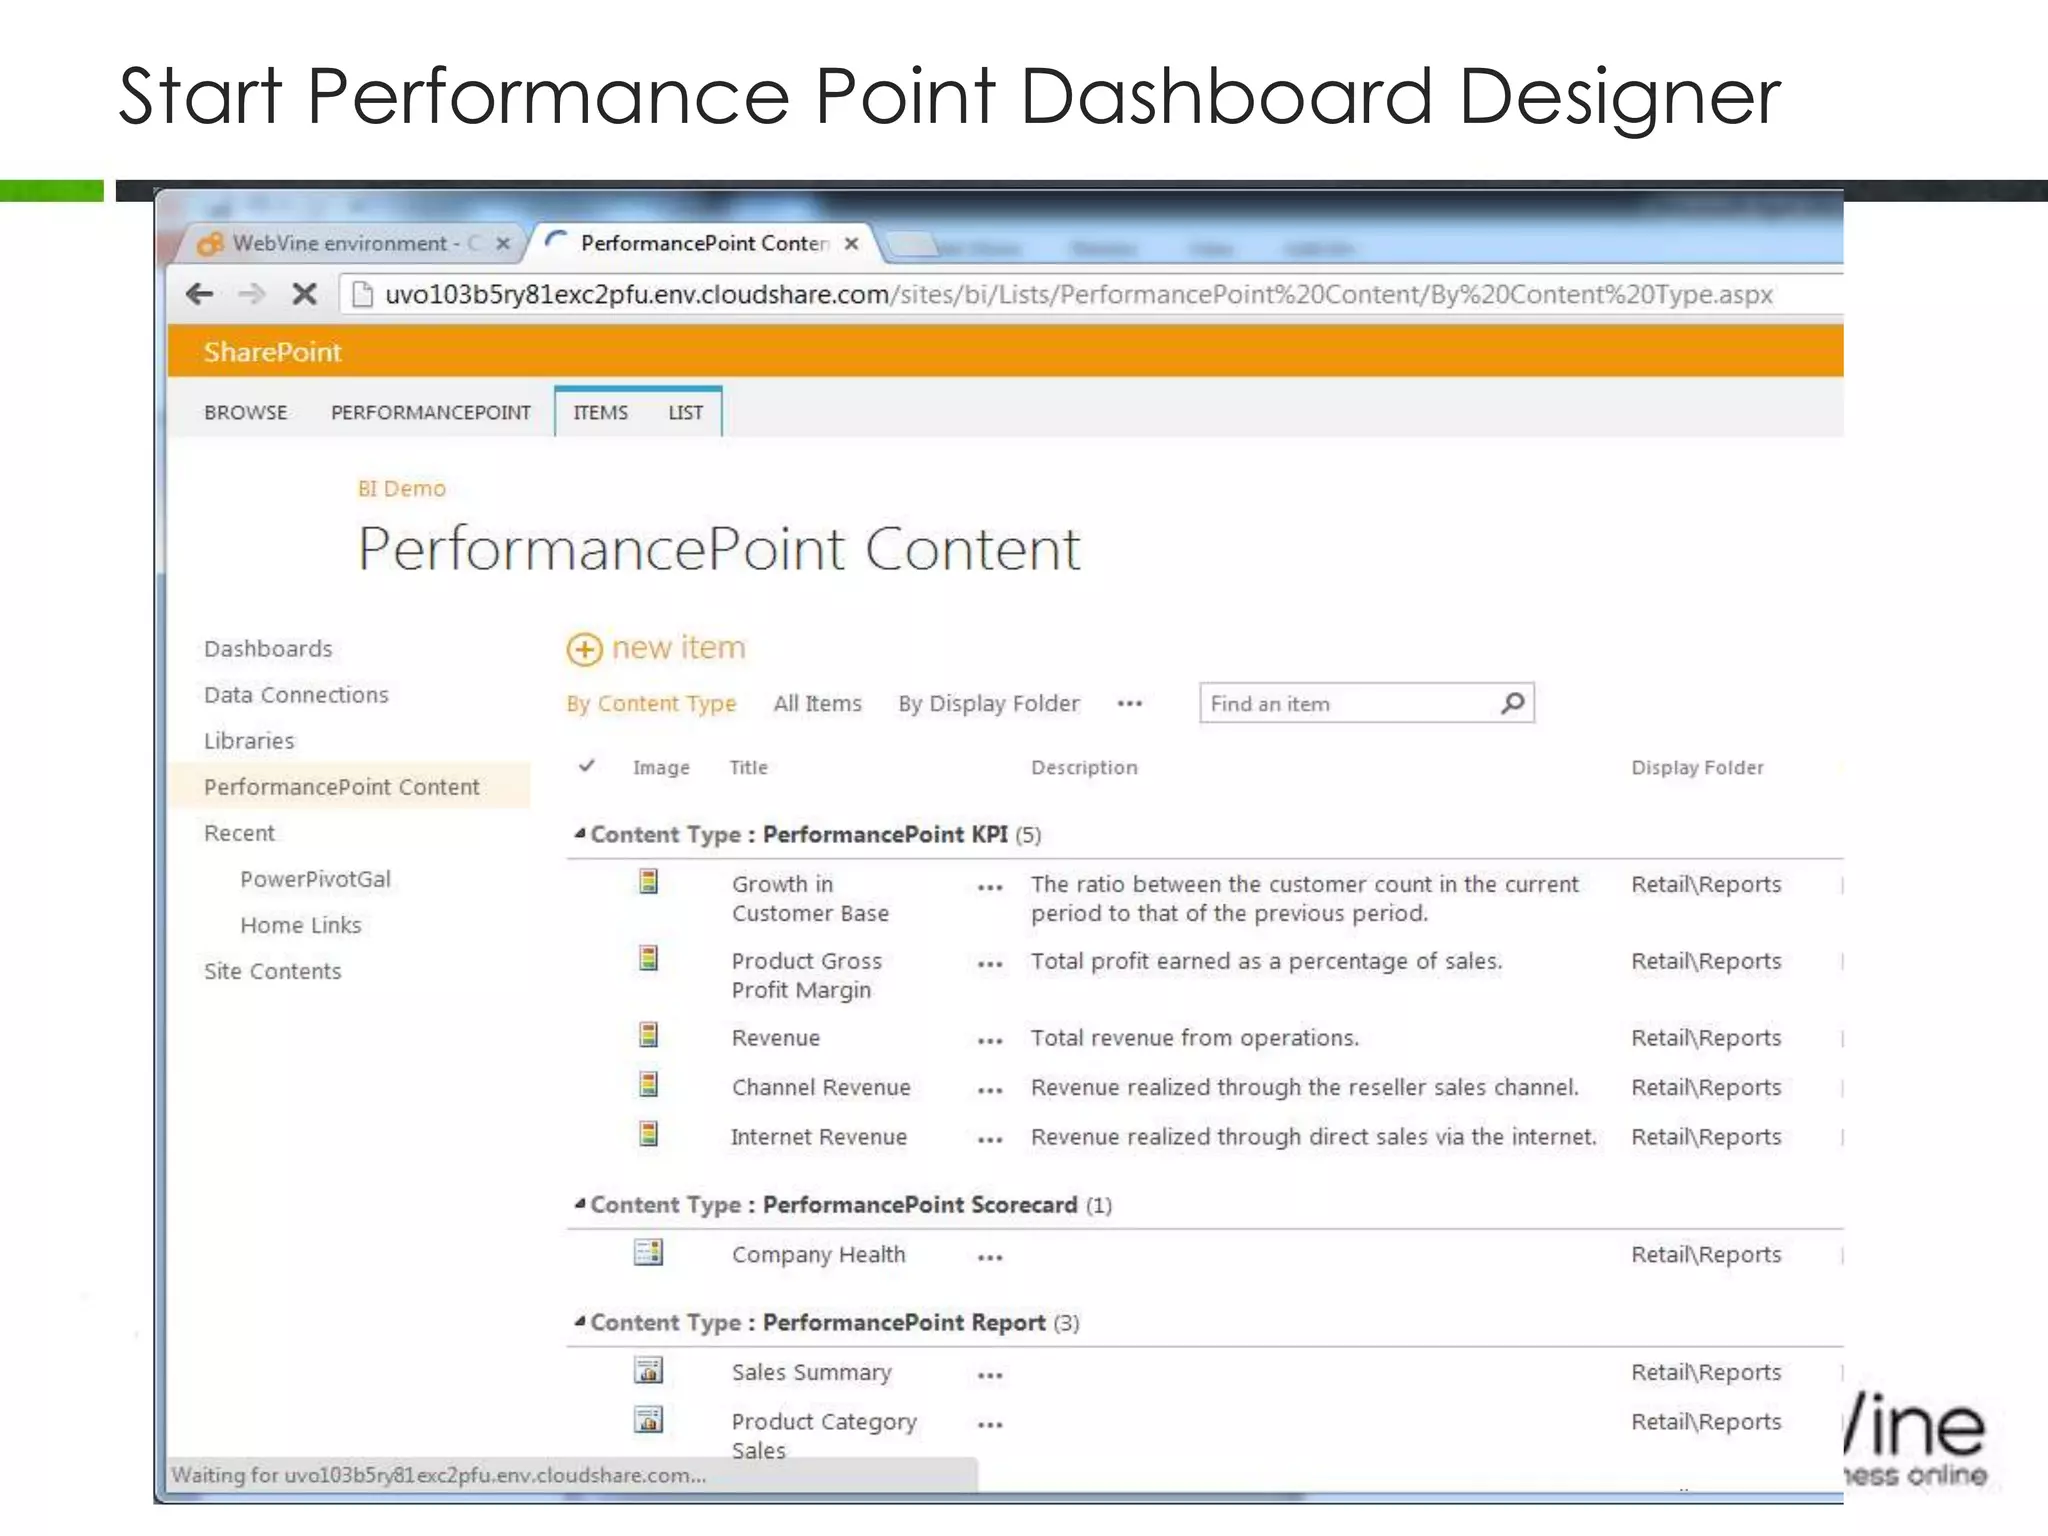
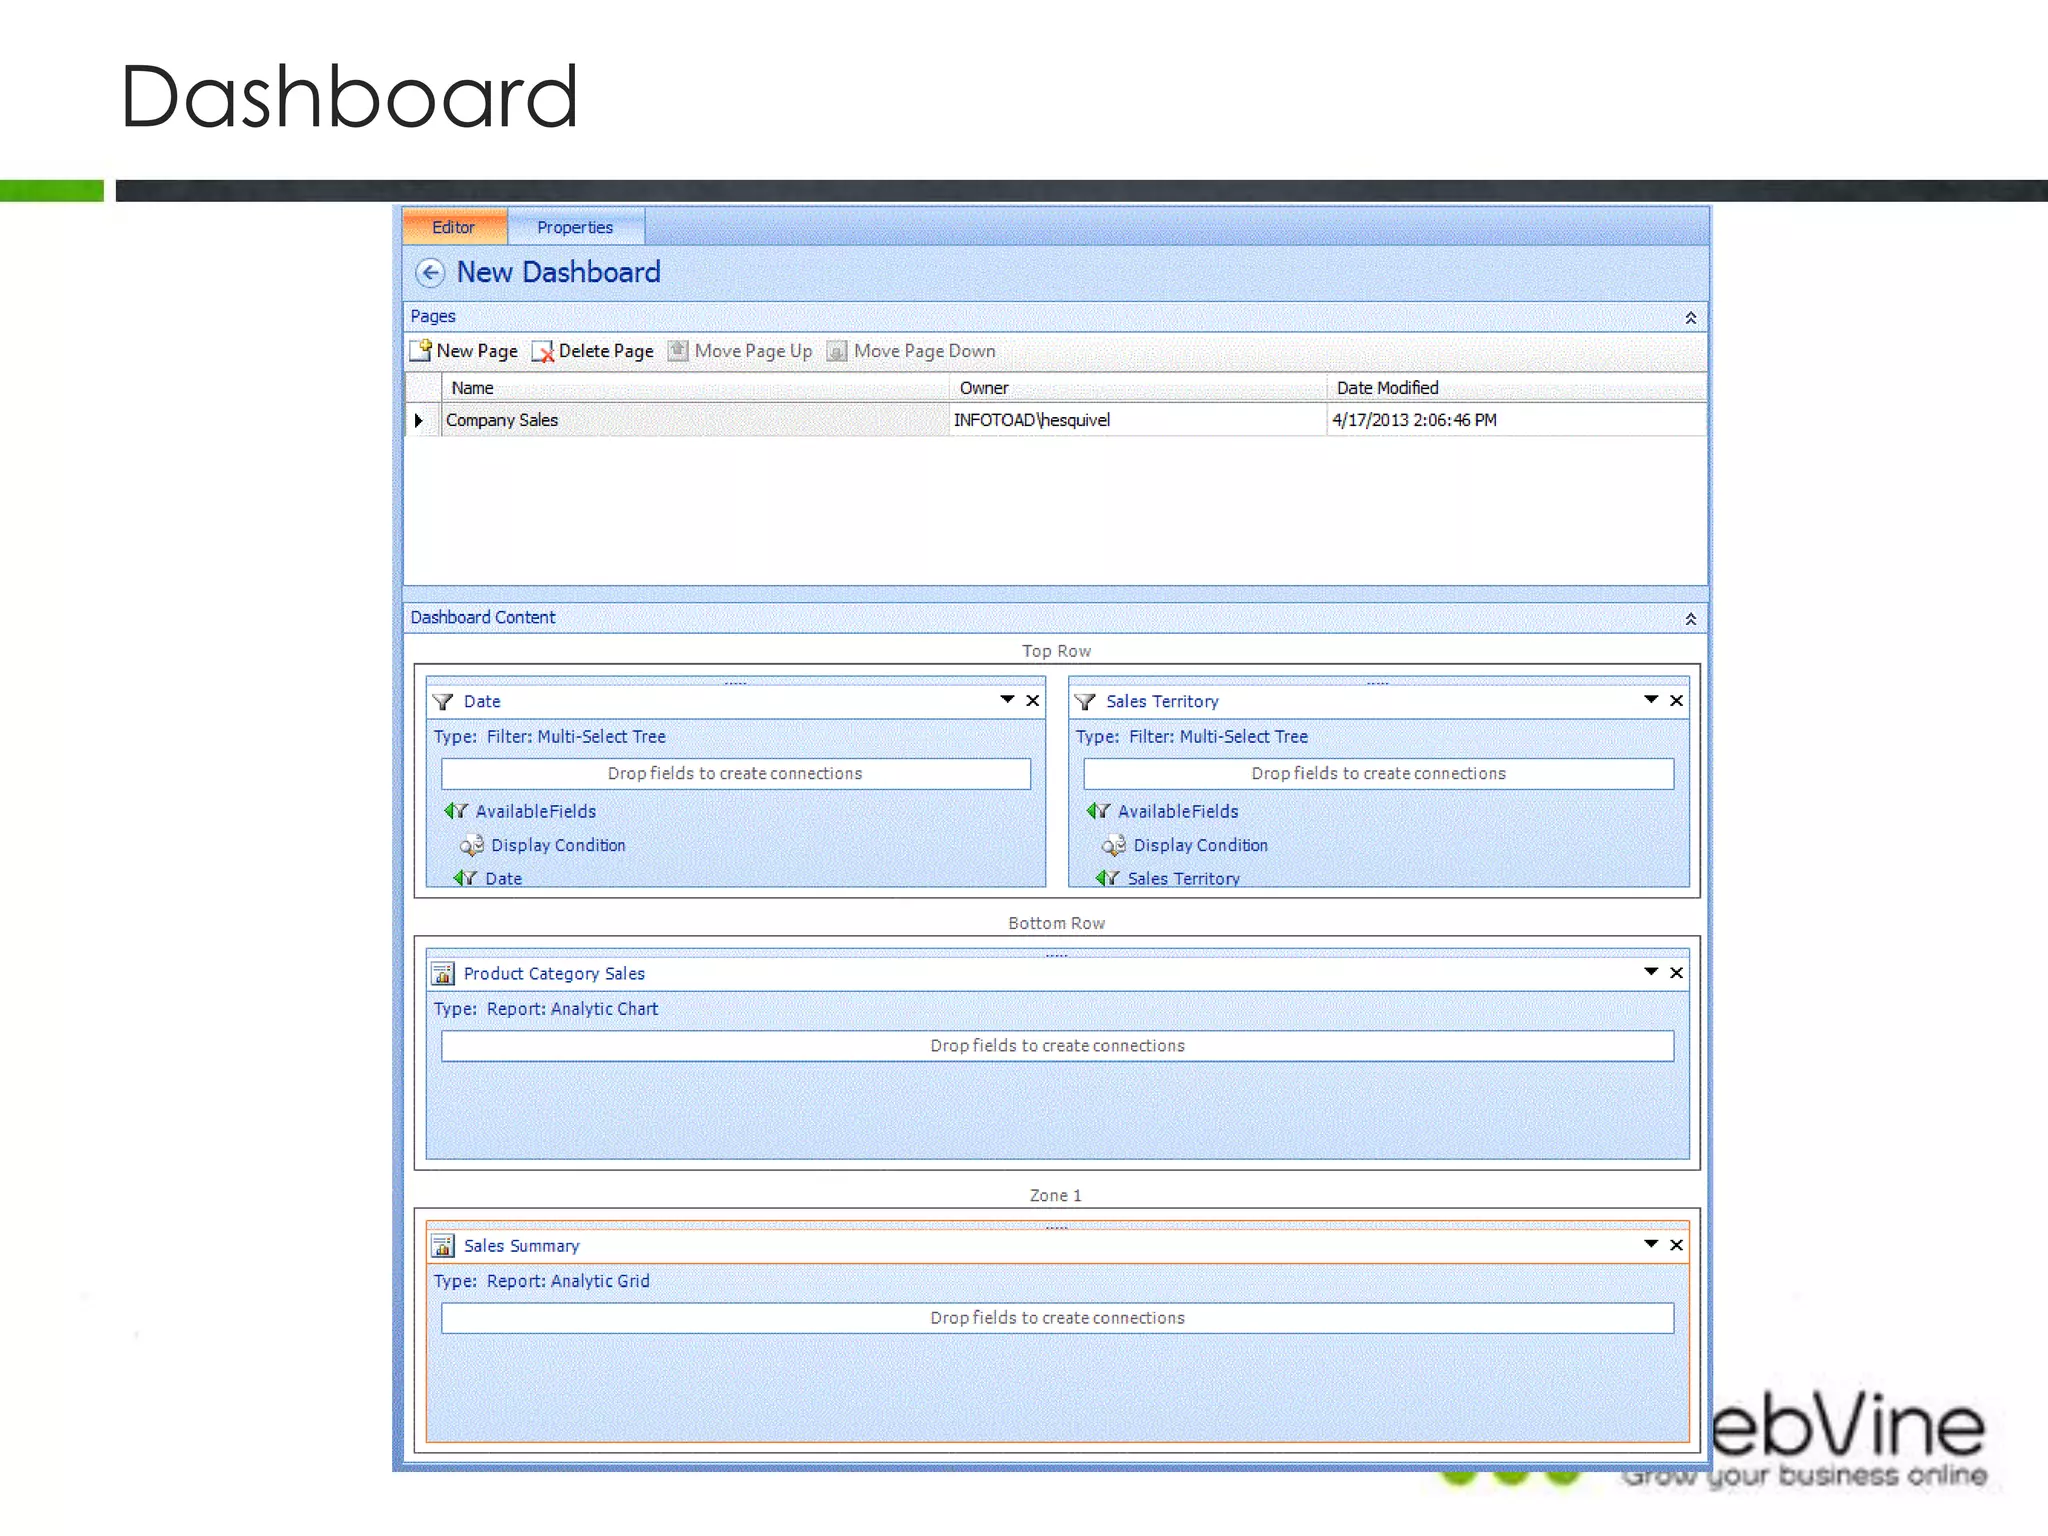
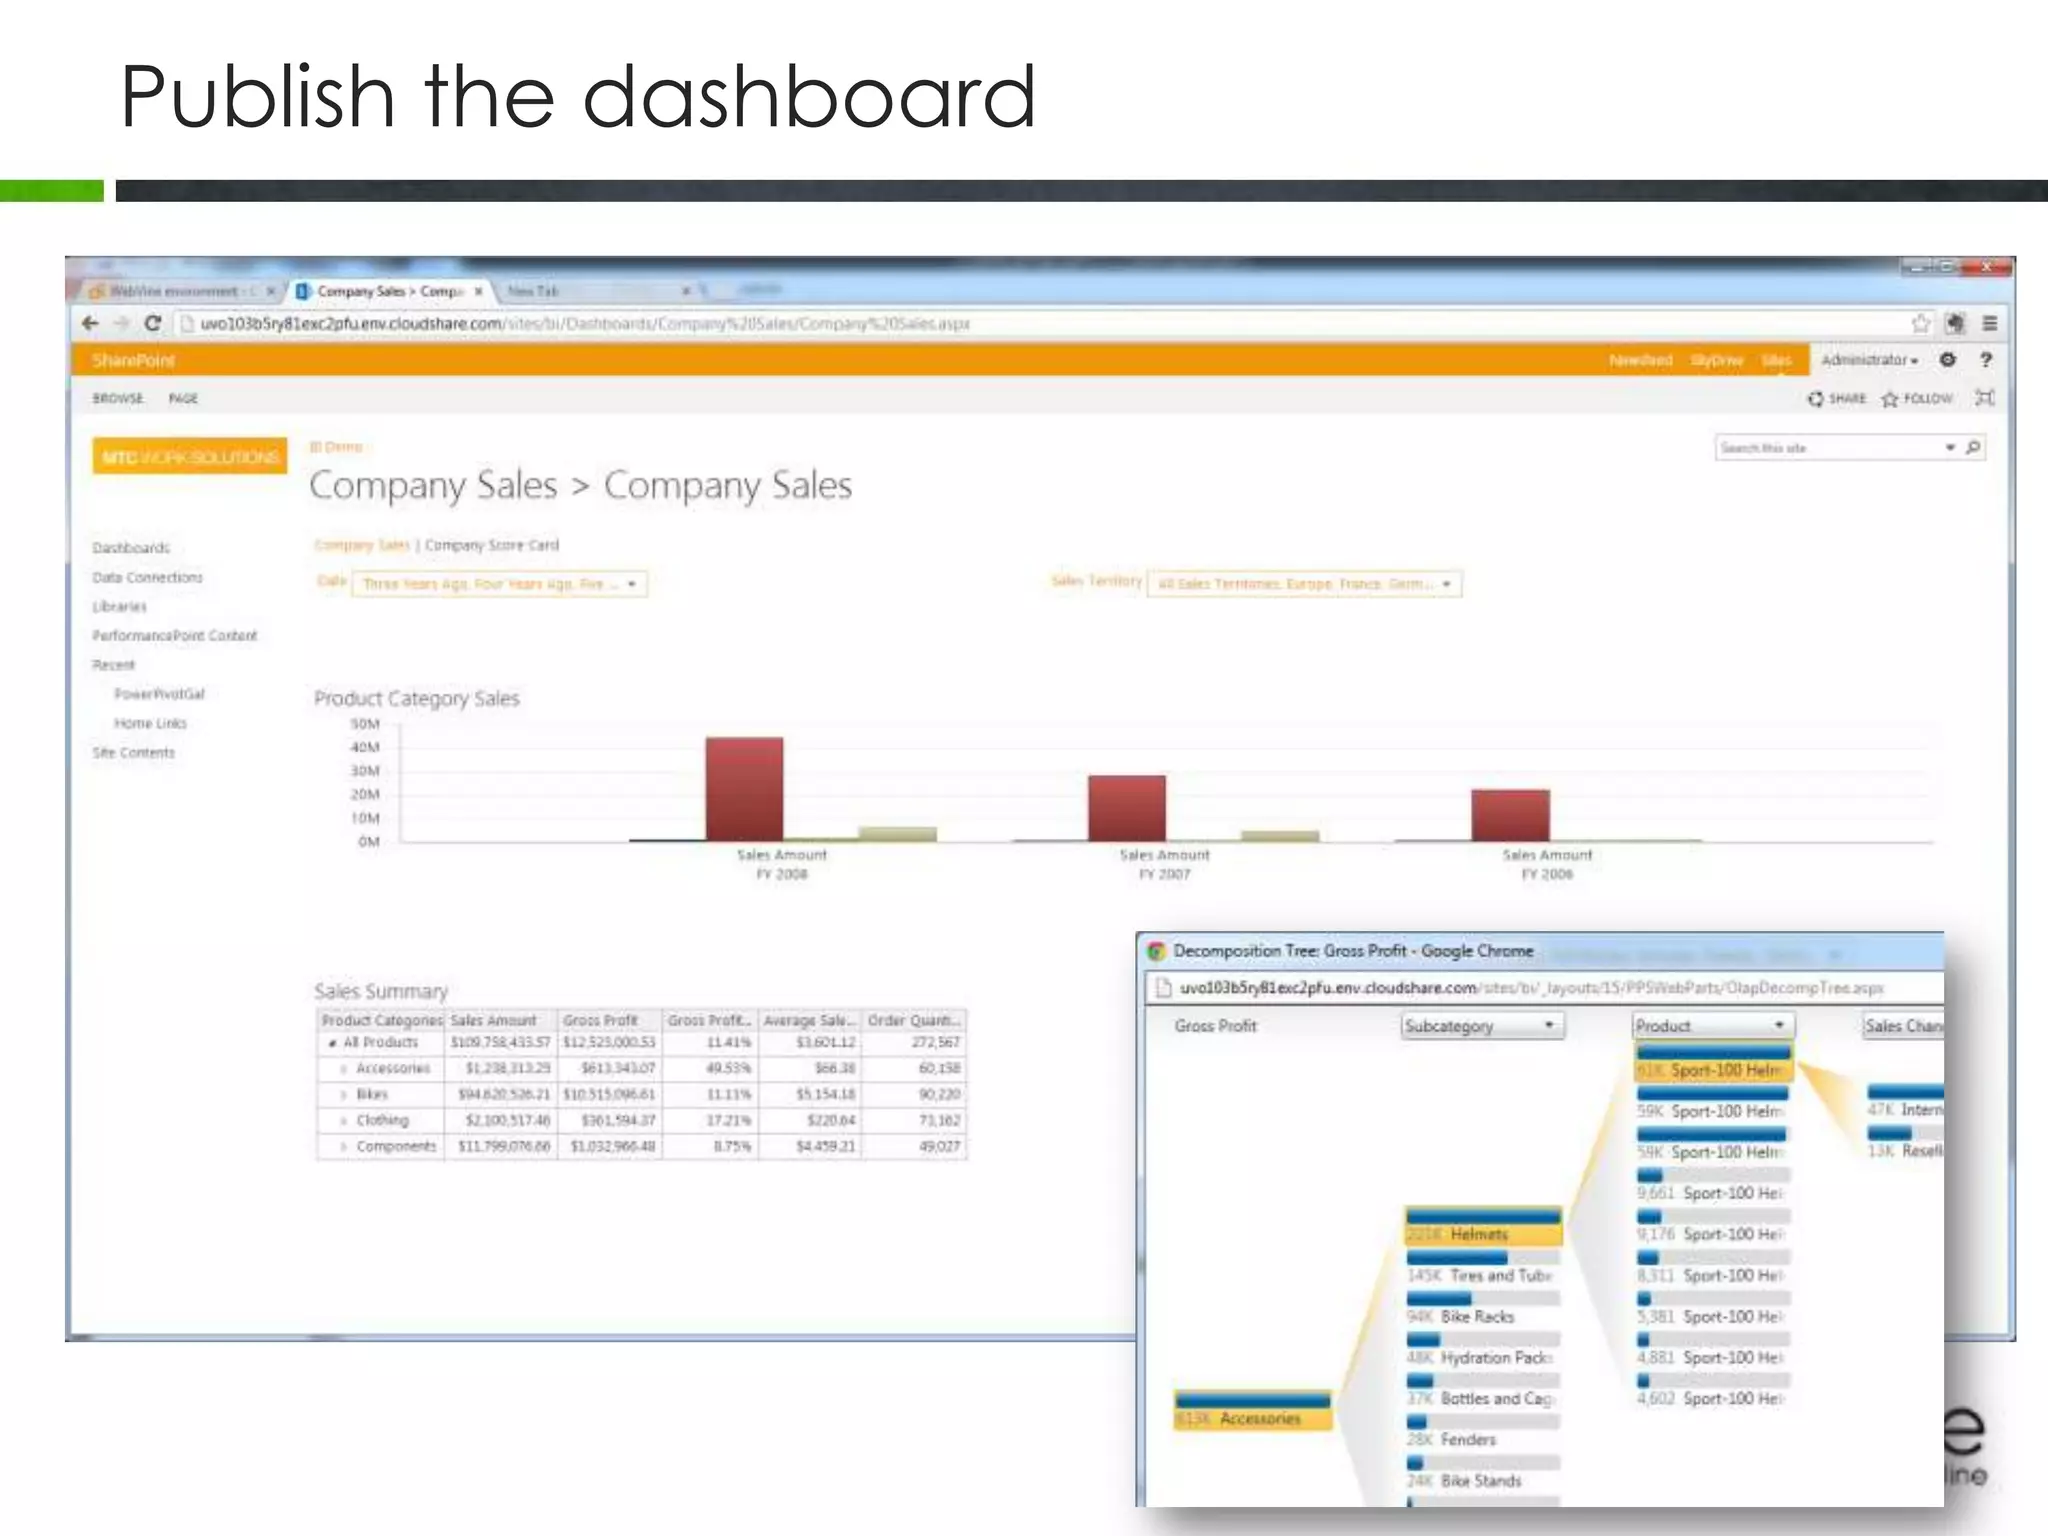
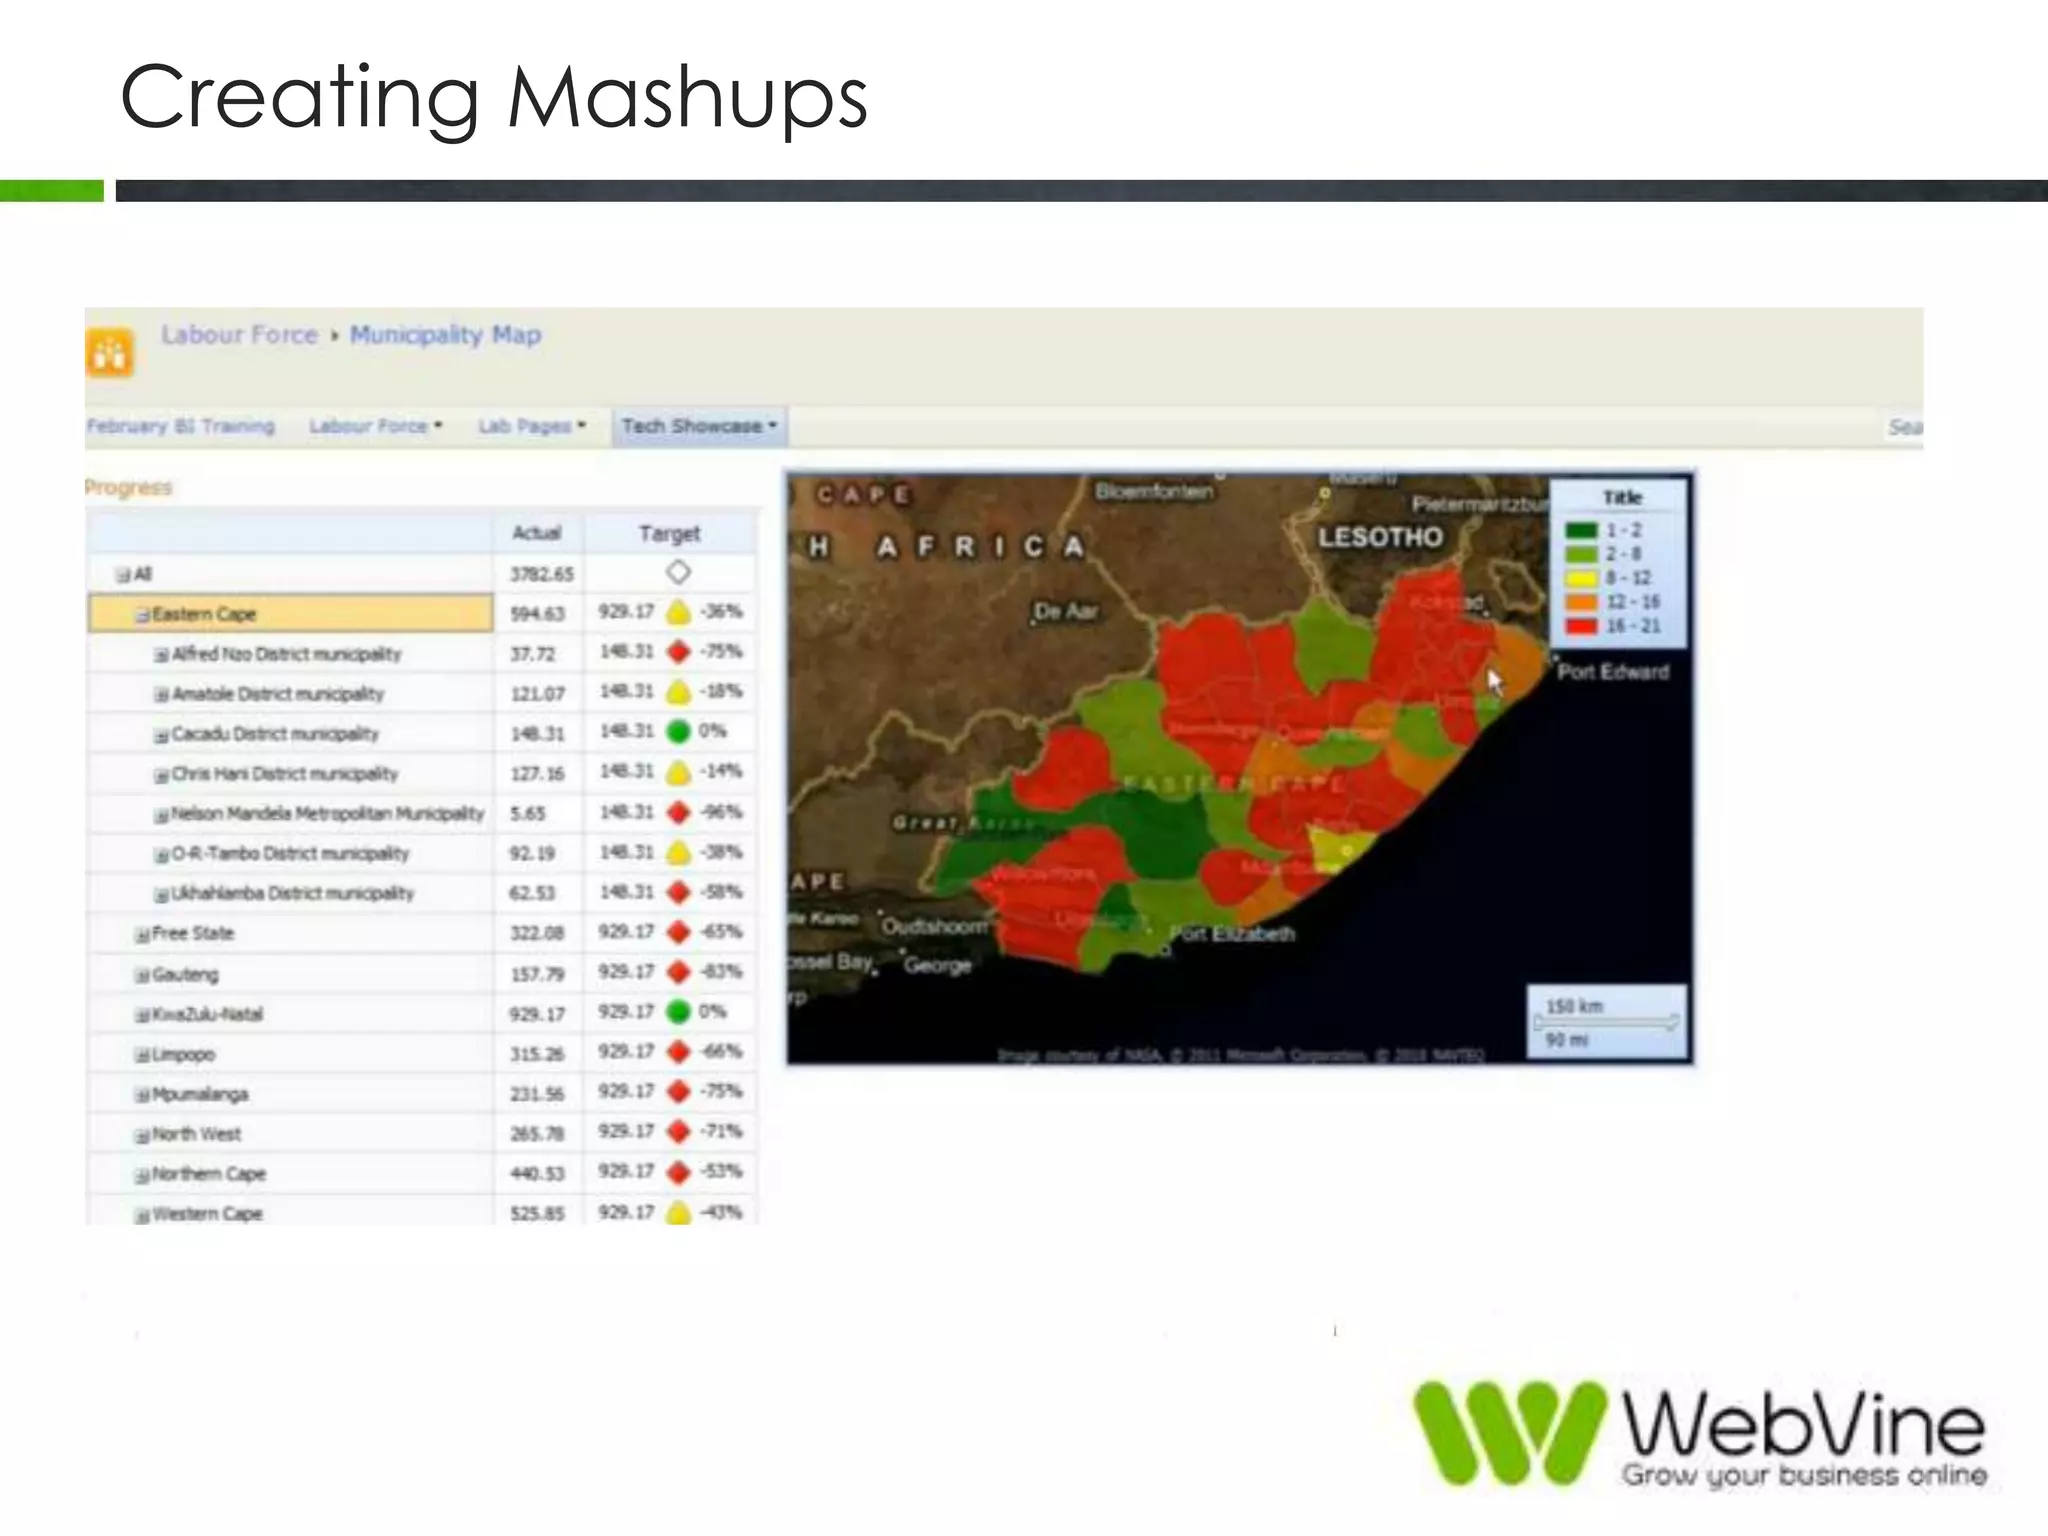

The document discusses Microsoft’s Business Intelligence (BI) offerings through SharePoint, covering tools like Excel Services, PowerPivot, and PerformancePoint, along with their functionalities and integrations. It outlines the comparison between different BI technologies and how they cater to various levels of business needs, from personal to corporate BI. The presentation emphasizes the importance of balancing data management and analytics for effective decision-making in organizations.


![Vibe Coding vs. Spec-Driven Development [Free Meetup]](https://cdn.slidesharecdn.com/ss_thumbnails/vibecodingvsspecdrivendevelopment-251209105622-43f455e7-thumbnail.jpg?width=640&height=640&fit=bounds)


