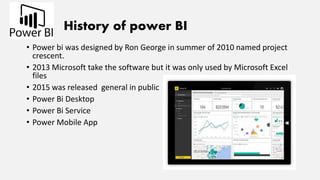
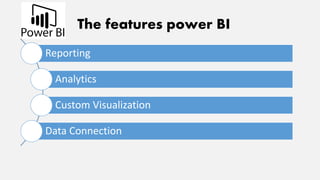
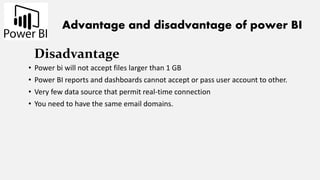
Power BI is a business analytics service by Microsoft that provides interactive visualizations and business intelligence capabilities, allowing users to create their own reports and dashboards. Initially designed in 2010, Power BI has since evolved with features like reporting analytics and custom visualization, but has limitations such as a 1 GB file size constraint and restricted user account sharing. Overall, it is a valuable tool for data analysis and dashboard customization.