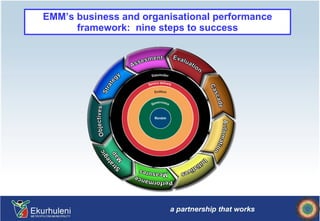
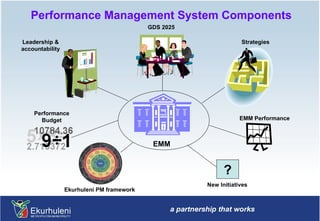
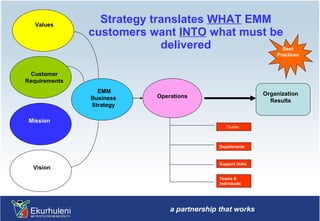
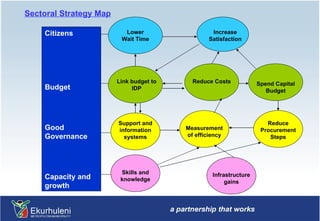
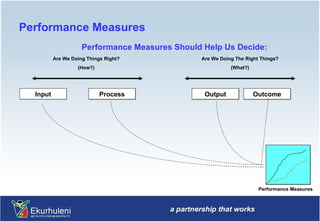
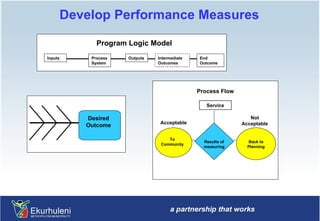
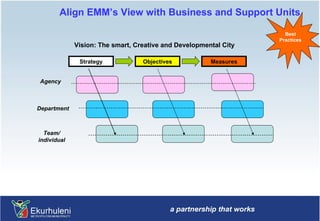
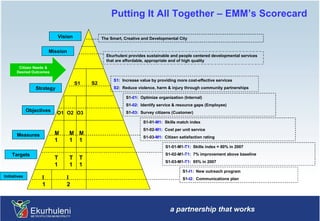
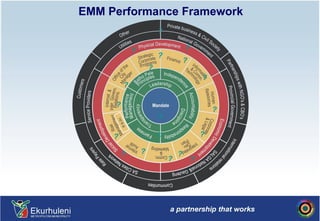
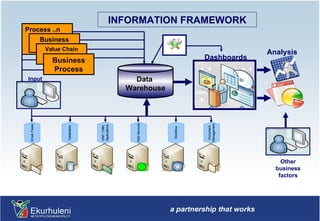
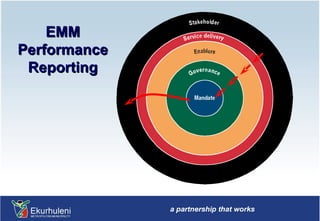
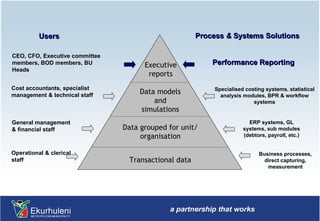
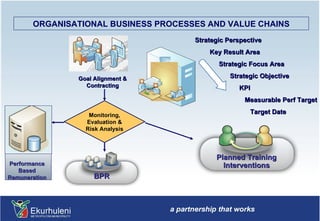
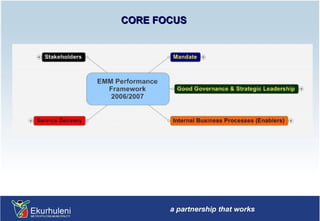
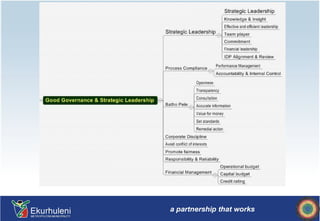
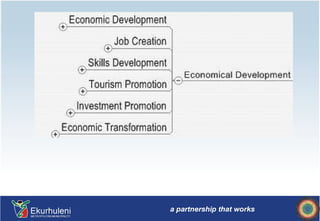
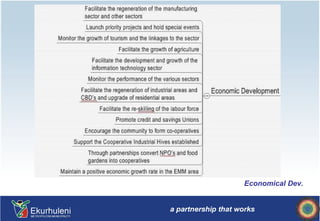
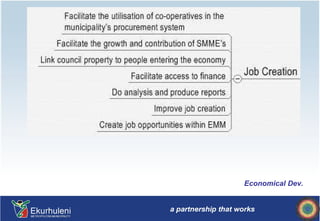
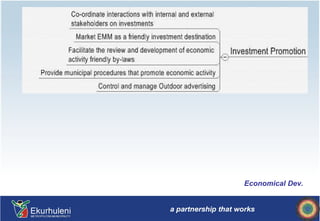
WORKSHOP OBJECTIVES Describe the framework for building and implementing EMM’s business scorecard for the performance management system Understand how the scorecard system helps to align EMM’s effort with its Mission, Vision and Strategy
EMM’s business and organisational performance framework:  nine steps to success
Performance Management System Components ? New Initiatives EMM Performance Strategies GDS 2025 Performance Budget Leadership & accountability Ekurhuleni PM framework EMM
Strategy Mapping Performance Measures Implementation
“ People and their managers are working so hard to be sure  things are done right , that they hardly have time to decide if they are  doing the right things”   Stephen R. Covey
Focus on the Organisation Strategy Continuous Leadership Make Strategy Actionable Manage for Performance Align Work with Mission Strategy = our approach to accomplishing our Mission Develop Strategy to Support Mission Budget for Performance, SDBIP
Define Strategies Mission:  Provide sustainable and people centered services…… Vision: The Smart, Creative and Developmental City Strategic Themes: As per the Growth and Development Strategy 2025 Good governance, 3 landscapes and 18 focus areas Integrated Development Plan (IDP) Short and medium term Departmental Strategies and programs (SDBIP)
Strategy translates  WHAT  EMM customers want  INTO  what must be delivered Support Units Departments Teams & Individuals Cluster Organization Results Values Vision Mission Customer Requirements EMM Business Strategy Operations Best Practices
Strategy Mapping   Performance Measures Implementation
Our Strategy is a Hypothesis about what Drives EMM’s Success Training Information Technology Leadership Service Quality Customer Confidence Customer Satisfaction Program Effectiveness Identify the Key Performance Drivers that Lead to Successful Strategy Execution
Sectoral Strategy Map Lower Wait Time Increase Satisfaction Reduce Costs Link budget to IDP Spend Capital Budget Support and information systems Measurement of efficiency Reduce Procurement Steps Skills and knowledge Infrastructure gains Citizens Budget Good Governance Capacity and growth
Strategy Mapping Performance Measures Implementation
Performance Measures Performance Measures Should Help Us Decide: Are We Doing Things Right? (How?) Are We Doing The Right Things? (What?) Input Process Output Outcome Performance Measures
Develop Performance Measures Program Logic Model Inputs Process System Outputs Intermediate Outcomes End Outcome Desired Outcome Process Flow Service Results of measuring To Community Back to Planning Acceptable Not Acceptable
The Finished Scorecard Tells The Story Infrastructure and growth Perspective Good governance Perspective Internal business and process Perspective Stakeholder Perspective Objectives  Measures  Initiatives Strategy: The Approach to Accomplishing the Mission
Strategy Mapping Performance Measures Implementation
Align EMM’s View with Business and Support Units Vision: The smart, Creative and Developmental City Strategy Objectives Measures Best Practices Agency Team/ individual Department
Putting It All Together – EMM’s Scorecard Citizen Needs & Desired Outcomes S1 S2 M1 O3 O2 O1 M1 M1 T1 T1 T1 I2 I1 Targets Strategy Objectives Measures Initiatives Vision The Smart, Creative and Developmental City Ekurhuleni provides sustainable and people centered developmental services that are affordable, appropriate and of high quality S1 :  Increase value by providing more cost-effective services S2 :  Reduce violence, harm & injury through community partnerships S1- 01 :  Optimize organization (Internal) S1- 02 :  Identify service & resource gaps (Employee) S1- 03 :  Survey citizens (Customer) S1-01- M1 :  Skills match index S1-02- M1 :  Cost per unit service S1-03- M1 :  Citizen satisfaction rating S1-01-M1- T1 :  Skills index = 80% in 2007 S1-02-M1- T1 :  7% improvement above baseline S1-03-M1- T1 :  95% in 2007 S1- I1 :  New outreach program S1- I2 :  Communications plan Mission
Data Warehouse Features:  Strategic Performance Management Collect and transform data from virtually any data source and manage the process. Fully automated solution. Communicate on strategy, provide early indicators. Collaborate on knowledge and share best practices enterprise-wide  Integrate with any performance framework. Robust analytics, including predicative analysis, cost analysis, correlation/ impact analysis, trend analysis, and data mining. Dynamic, customizable strategy maps. Ability to integrate with other enterprise solutions. One consistent Intelligence Architecture across the enterprise.
Automation Software Solution Space Enterprise Requirements Links to legacy systems Composite measures Many data/reporting locations Integrate with enterprise  systems Advanced executive reporting Web input & publishing Advanced analysis Numerous measures Composite measures Visualization & charting Multiple locations Web input & publishing Commentary Few measures Basic tracking Small office Data Warehouse Data Base PMIS Time and Cost to Implement
Performance Based Budget 18 Strategic focus   areas Scorecard  Budget Recipients Goal 1 Goal 3 Goal 2 Goal 4 Goal 5 Goal 6 Goal 7 Goal 8 Goal 9 M E A S U R E S Citizens Contractors  Suppliers Project 1 R xx M Project 2 R xx M Project 3 R xx M Project 4 R xx M Project 5 R xx M Infrastructure Other Indirects
Summary
Scorecard Implementation: Challenges Fear of measurement and new system. Lack of common definitions and terms. Inconsistent or weak buy-in and lack of understanding. Visions and strategies that are poorly defined and understood, not actionable and not linked to individual actions. Treating budget development separately from strategy development. Measures set independently of a performance framework, or measures with no ownership. Loosing momentum. No performance targets or targets set too high or too low. Little or no strategic feedback. Lack of meaningful employee involvement.
The Scorecard Is (Is Not) Is Not: Is: Aligning vision with operations  A re-engineering project Balancing non-financial, efficiency, infrastructure  Putting your existing metrics into 4 bins and financial views of performance Increased accountability  Tighter individual control A challenge initiative  “Business as Usual” Hard work  Easy A journey  A project A communications tool for the whole organization  A tool for executives only A strategy-based management system  A performance measurement tool
“ It’s about management and change first;  measurement and technology are second” Howard Rohm
Keeping All The Balls In The Air Performance Management Cost Measure-ment Process Improve-ment Risk Assess-ment Motivation Reward Technology
Implementation Plan Goal Alignment Design of Performance Framework Cascading of Goals downwards Contracting with Departments and Employees Building of Information Framework Monitoring & Reporting Evaluation Reward and corrective action
Goal Alignment Performance Framework Information Framework Data Warehouse
EMM Performance Framework
EMM Performance Framework – High level to detail
EMM Performance Framework R & D
EMM Performance Framework a b R & Dc ? ? ? ? ? ? ? ? ?   ? ? ?   ? ? ? ? ?
Goal Alignment Performance Framework Information Framework Data Warehouse
INFORMATION FRAMEWORK Process ..n  Business Process Value Chain Business Process Data  Warehouse Dashboards Input Analysis Other business factors
EMM Performance Reporting
Users Process  &  Systems Solutions Transactional data Operational & clerical staff Business processes, direct capturing, measurement Data grouped for unit/organisation General management & financial staff ERP systems, GL systems, sub modules (debtors, payroll, etc.) Data models and simulations Cost accountants, specialist management & technical staff Specialised costing systems, statistical analysis modules, BPR & workflow systems Executive reports CEO, CFO, Executive committee members, BOD members, BU Heads Performance Reporting
Performance Based Remuneration BPR Planned Training Interventions Monitoring, Evaluation & Risk Analysis ORGANISATIONAL BUSINESS PROCESSES AND VALUE CHAINS Goal Alignment & Contracting Strategic Perspective Key Result Area  Strategic Focus Area Strategic Objective KPI Measurable Perf Target  Target Date
CORE FOCUS
The following slides are for the hyperlinks
Vision:  The smart, creative and developmental city. Mission:  Ekurhuleni provides sustainable and people centred development services that are affordable, appropriate and of high quality. We are focused on social, environmental and economic regeneration of our  city and communities, as guided by the principles of Batho Pele and through the commitment of a motivated and dedicated team.


Not well covered in the strategy, IDP & SDBIP


Not well covered in the strategy, IDP & SDBIP


Physical Dev.
Physical Dev.
Physical Dev.
Physical Dev.
Physical Dev.
Physical Dev.
 
Economical Dev.
Economical Dev.
Not well covered in the strategy, IDP & SDBIP Economical Dev.
Economical Dev.
Economical Dev.
Economical Dev.
 
Social Dev.
Social Dev.
Social Dev.
Social Dev.
Social Dev. Social Dev.
 
End of presentation

Organizational Performance framework-

  • 1.
    WORKSHOP OBJECTIVES Describethe framework for building and implementing EMM’s business scorecard for the performance management system Understand how the scorecard system helps to align EMM’s effort with its Mission, Vision and Strategy
  • 2.
    EMM’s business andorganisational performance framework: nine steps to success
  • 3.
    Performance Management SystemComponents ? New Initiatives EMM Performance Strategies GDS 2025 Performance Budget Leadership & accountability Ekurhuleni PM framework EMM
  • 4.
    Strategy Mapping PerformanceMeasures Implementation
  • 5.
    “ People andtheir managers are working so hard to be sure things are done right , that they hardly have time to decide if they are doing the right things” Stephen R. Covey
  • 6.
    Focus on theOrganisation Strategy Continuous Leadership Make Strategy Actionable Manage for Performance Align Work with Mission Strategy = our approach to accomplishing our Mission Develop Strategy to Support Mission Budget for Performance, SDBIP
  • 7.
    Define Strategies Mission: Provide sustainable and people centered services…… Vision: The Smart, Creative and Developmental City Strategic Themes: As per the Growth and Development Strategy 2025 Good governance, 3 landscapes and 18 focus areas Integrated Development Plan (IDP) Short and medium term Departmental Strategies and programs (SDBIP)
  • 8.
    Strategy translates WHAT EMM customers want INTO what must be delivered Support Units Departments Teams & Individuals Cluster Organization Results Values Vision Mission Customer Requirements EMM Business Strategy Operations Best Practices
  • 9.
    Strategy Mapping Performance Measures Implementation
  • 10.
    Our Strategy isa Hypothesis about what Drives EMM’s Success Training Information Technology Leadership Service Quality Customer Confidence Customer Satisfaction Program Effectiveness Identify the Key Performance Drivers that Lead to Successful Strategy Execution
  • 11.
    Sectoral Strategy MapLower Wait Time Increase Satisfaction Reduce Costs Link budget to IDP Spend Capital Budget Support and information systems Measurement of efficiency Reduce Procurement Steps Skills and knowledge Infrastructure gains Citizens Budget Good Governance Capacity and growth
  • 12.
    Strategy Mapping PerformanceMeasures Implementation
  • 13.
    Performance Measures PerformanceMeasures Should Help Us Decide: Are We Doing Things Right? (How?) Are We Doing The Right Things? (What?) Input Process Output Outcome Performance Measures
  • 14.
    Develop Performance MeasuresProgram Logic Model Inputs Process System Outputs Intermediate Outcomes End Outcome Desired Outcome Process Flow Service Results of measuring To Community Back to Planning Acceptable Not Acceptable
  • 15.
    The Finished ScorecardTells The Story Infrastructure and growth Perspective Good governance Perspective Internal business and process Perspective Stakeholder Perspective Objectives Measures Initiatives Strategy: The Approach to Accomplishing the Mission
  • 16.
    Strategy Mapping PerformanceMeasures Implementation
  • 17.
    Align EMM’s Viewwith Business and Support Units Vision: The smart, Creative and Developmental City Strategy Objectives Measures Best Practices Agency Team/ individual Department
  • 18.
    Putting It AllTogether – EMM’s Scorecard Citizen Needs & Desired Outcomes S1 S2 M1 O3 O2 O1 M1 M1 T1 T1 T1 I2 I1 Targets Strategy Objectives Measures Initiatives Vision The Smart, Creative and Developmental City Ekurhuleni provides sustainable and people centered developmental services that are affordable, appropriate and of high quality S1 : Increase value by providing more cost-effective services S2 : Reduce violence, harm & injury through community partnerships S1- 01 : Optimize organization (Internal) S1- 02 : Identify service & resource gaps (Employee) S1- 03 : Survey citizens (Customer) S1-01- M1 : Skills match index S1-02- M1 : Cost per unit service S1-03- M1 : Citizen satisfaction rating S1-01-M1- T1 : Skills index = 80% in 2007 S1-02-M1- T1 : 7% improvement above baseline S1-03-M1- T1 : 95% in 2007 S1- I1 : New outreach program S1- I2 : Communications plan Mission
  • 19.
    Data Warehouse Features: Strategic Performance Management Collect and transform data from virtually any data source and manage the process. Fully automated solution. Communicate on strategy, provide early indicators. Collaborate on knowledge and share best practices enterprise-wide Integrate with any performance framework. Robust analytics, including predicative analysis, cost analysis, correlation/ impact analysis, trend analysis, and data mining. Dynamic, customizable strategy maps. Ability to integrate with other enterprise solutions. One consistent Intelligence Architecture across the enterprise.
  • 20.
    Automation Software SolutionSpace Enterprise Requirements Links to legacy systems Composite measures Many data/reporting locations Integrate with enterprise systems Advanced executive reporting Web input & publishing Advanced analysis Numerous measures Composite measures Visualization & charting Multiple locations Web input & publishing Commentary Few measures Basic tracking Small office Data Warehouse Data Base PMIS Time and Cost to Implement
  • 21.
    Performance Based Budget18 Strategic focus areas Scorecard Budget Recipients Goal 1 Goal 3 Goal 2 Goal 4 Goal 5 Goal 6 Goal 7 Goal 8 Goal 9 M E A S U R E S Citizens Contractors Suppliers Project 1 R xx M Project 2 R xx M Project 3 R xx M Project 4 R xx M Project 5 R xx M Infrastructure Other Indirects
  • 22.
  • 23.
    Scorecard Implementation: ChallengesFear of measurement and new system. Lack of common definitions and terms. Inconsistent or weak buy-in and lack of understanding. Visions and strategies that are poorly defined and understood, not actionable and not linked to individual actions. Treating budget development separately from strategy development. Measures set independently of a performance framework, or measures with no ownership. Loosing momentum. No performance targets or targets set too high or too low. Little or no strategic feedback. Lack of meaningful employee involvement.
  • 24.
    The Scorecard Is(Is Not) Is Not: Is: Aligning vision with operations A re-engineering project Balancing non-financial, efficiency, infrastructure Putting your existing metrics into 4 bins and financial views of performance Increased accountability Tighter individual control A challenge initiative “Business as Usual” Hard work Easy A journey A project A communications tool for the whole organization A tool for executives only A strategy-based management system A performance measurement tool
  • 25.
    “ It’s aboutmanagement and change first; measurement and technology are second” Howard Rohm
  • 26.
    Keeping All TheBalls In The Air Performance Management Cost Measure-ment Process Improve-ment Risk Assess-ment Motivation Reward Technology
  • 27.
    Implementation Plan GoalAlignment Design of Performance Framework Cascading of Goals downwards Contracting with Departments and Employees Building of Information Framework Monitoring & Reporting Evaluation Reward and corrective action
  • 28.
    Goal Alignment PerformanceFramework Information Framework Data Warehouse
  • 29.
  • 30.
    EMM Performance Framework– High level to detail
  • 31.
  • 32.
    EMM Performance Frameworka b R & Dc ? ? ? ? ? ? ? ? ? ? ? ? ? ? ? ? ?
  • 33.
    Goal Alignment PerformanceFramework Information Framework Data Warehouse
  • 34.
    INFORMATION FRAMEWORK Process..n Business Process Value Chain Business Process Data Warehouse Dashboards Input Analysis Other business factors
  • 35.
  • 36.
    Users Process & Systems Solutions Transactional data Operational & clerical staff Business processes, direct capturing, measurement Data grouped for unit/organisation General management & financial staff ERP systems, GL systems, sub modules (debtors, payroll, etc.) Data models and simulations Cost accountants, specialist management & technical staff Specialised costing systems, statistical analysis modules, BPR & workflow systems Executive reports CEO, CFO, Executive committee members, BOD members, BU Heads Performance Reporting
  • 37.
    Performance Based RemunerationBPR Planned Training Interventions Monitoring, Evaluation & Risk Analysis ORGANISATIONAL BUSINESS PROCESSES AND VALUE CHAINS Goal Alignment & Contracting Strategic Perspective Key Result Area Strategic Focus Area Strategic Objective KPI Measurable Perf Target Target Date
  • 38.
  • 39.
    The following slidesare for the hyperlinks
  • 40.
    Vision: Thesmart, creative and developmental city. Mission: Ekurhuleni provides sustainable and people centred development services that are affordable, appropriate and of high quality. We are focused on social, environmental and economic regeneration of our city and communities, as guided by the principles of Batho Pele and through the commitment of a motivated and dedicated team.
  • 41.
  • 42.
  • 43.
  • 44.
  • 45.
  • 46.
  • 47.
  • 48.
    Not well coveredin the strategy, IDP & SDBIP
  • 49.
  • 50.
  • 51.
  • 52.
    Not well coveredin the strategy, IDP & SDBIP
  • 53.
    Not well coveredin the strategy, IDP & SDBIP
  • 54.
  • 55.
  • 56.
  • 57.
  • 58.
  • 59.
  • 60.
  • 61.
  • 62.
  • 63.
  • 64.
  • 65.
  • 66.
  • 67.
  • 68.
    Not well coveredin the strategy, IDP & SDBIP Economical Dev.
  • 69.
  • 70.
  • 71.
  • 72.
  • 73.
  • 74.
  • 75.
  • 76.
  • 77.
  • 78.
  • 79.