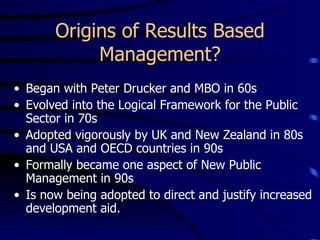
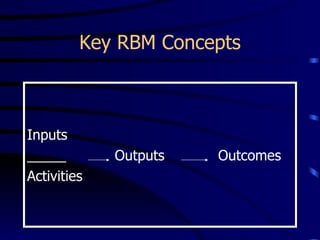
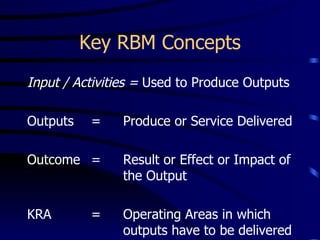
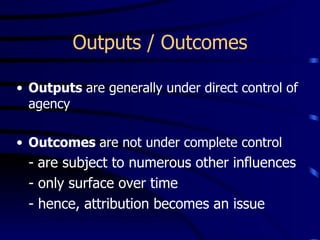
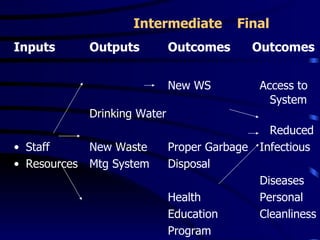
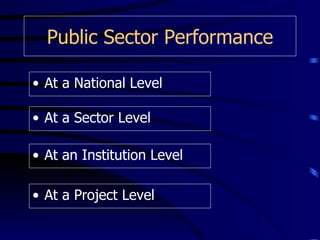
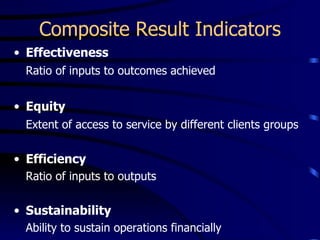
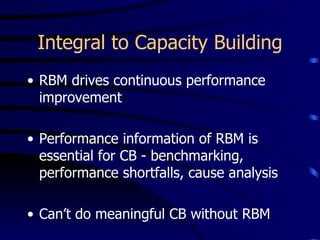
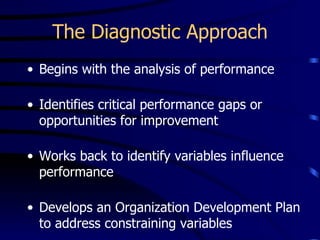
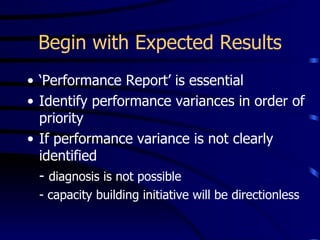
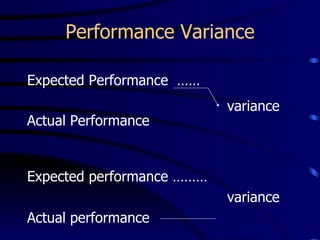
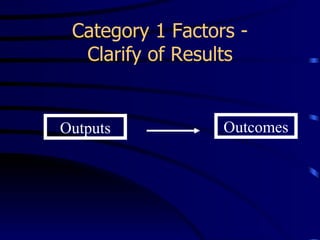
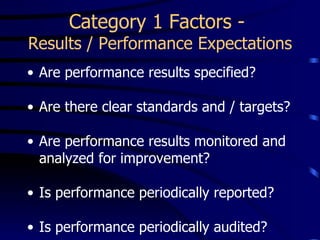
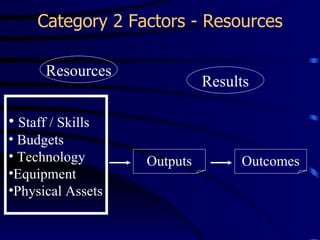
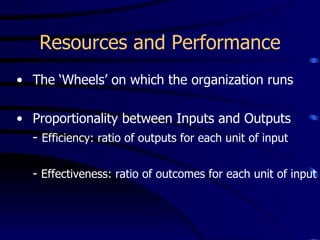
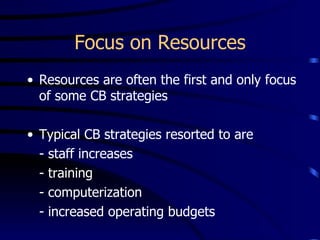
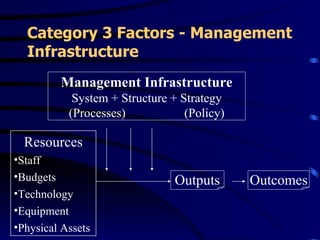
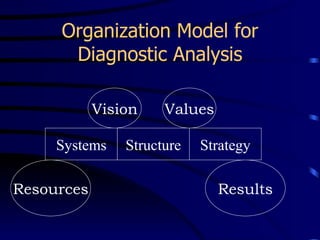
Results Based Management

  Introduction to Results Based
          Management
Origins of Results Based
            Management?
• Began with Peter Drucker and MBO in 60s
• Evolved into the Logical Framework for the Public
  Sector in 70s
• Adopted vigorously by UK and New Zealand in 80s
  and USA and OECD countries in 90s
• Formally became one aspect of New Public
  Management in 90s
• Is now being adopted to direct and justify increased
  development aid.
What is Results Based
         Management
• Focuses on tangible results to be
  delivered
• Clarifies Clients and Mandate of
  Organization
• Promotes Benchmarking and
  Performance Analysis
• It emphasizes value-for-money
Why Results Based
          Management?
• The public want better services
• More effective resource allocation
• Private sector seeks improved
  infrastructure and services
• The public sector agency wants to perform
  more efficiently and effectively
Starting Point is Performance/
             Results
• Why does this organization exist?

• What would be lost if it did not exist?

• Who does it serve?

• What is it supposed to deliver for them?
Alternative Approaches to
    Managing Performance

Management by Inputs/Activities

• Success is measured by expenditure
  and/or extent of activity.

 (How much did we spend on this workshop?)
Alternative Approaches to
    Managing Performance
Management by Outputs

• Success is measured by the extent of
  goods/services delivered and the ratio
  of inputs to outputs.
Alternative Approaches to
    Managing Performance
• Success is measured by effects/impacts
  achieved, and their sustainability.

 (What were the concrete agreements
  arrived at?
 - After six months: Have these been
  fulfilled?
 - Is the quality of Performance Management
  improving?)
Recent Approaches to
      Performance (Results)
           Management

• Input - Output - Outcome Indicators

• Client Satisfaction Surveys

• Balanced Scorecard Approach
Key RBM Concepts


Inputs
_____        Outputs   Outcomes
Activities
Key RBM Concepts
Input / Activities = Used to Produce Outputs

Outputs    =    Produce or Service Delivered

Outcome =       Result or Effect or Impact of
                the Output

KRA        =    Operating Areas in which
                outputs have to be delivered
Outputs / Outcomes

• Outputs are generally under direct control of
  agency

• Outcomes are not under complete control
  - are subject to numerous other influences
  - only surface over time
  - hence, attribution becomes an issue
Intermediate         Final
Inputs        Outputs          Outcomes         Outcomes


                               New WS           Access to
                                                  System
              Drinking Water
                                                  Reduced
• Staff       New Waste        Proper Garbage   Infectious
• Resources   Mtg System       Disposal
                                                Diseases
                               Health           Personal
                               Education        Cleanliness
                               Program
Public Sector Performance

• At a National Level

• At a Sector Level

• At an Institution Level

• At a Project Level
Client Satisfaction - The Report
• Covers Essential Services

• Focus on Processes, Outputs, Outcomes

• Uses Sample Surveys
Composite Result Indicators
• Effectiveness
 Ratio of inputs to outcomes achieved


• Equity
 Extent of access to service by different clients groups


• Efficiency
 Ratio of inputs to outputs

• Sustainability
 Ability to sustain operations financially
Integral to Capacity Building
• RBM drives continuous performance
  improvement

• Performance information of RBM is
  essential for CB - benchmarking,
  performance shortfalls, cause analysis

• Can’t do meaningful CB without RBM
The Diagnostic Approach
• Begins with the analysis of performance

• Identifies critical performance gaps or
  opportunities for improvement

• Works back to identify variables influence
  performance

• Develops an Organization Development Plan
  to address constraining variables
Begin with Expected Results
• ‘Performance Report’ is essential
• Identify performance variances in order of
  priority
• If performance variance is not clearly
  identified
  - diagnosis is not possible
 - capacity building initiative will be directionless
Performance Variance

Expected Performance ……
                           variance
Actual Performance


Expected performance ………
                           variance
Actual performance
Category 1 Factors -
  Clarify of Results


Outputs           Outcomes
Category 1 Factors -
Results / Performance Expectations
• Are performance results specified?

• Are there clear standards and / targets?

• Are performance results monitored and
  analyzed for improvement?

• Is performance periodically reported?

• Is performance periodically audited?
Category 2 Factors - Resources

       Resources
                             Results

• Staff / Skills
• Budgets
• Technology       Outputs        Outcomes
•Equipment
•Physical Assets
Resources and Performance
• The ‘Wheels’ on which the organization runs

• Proportionality between Inputs and Outputs
  - Efficiency: ratio of outputs for each unit of input

   - Effectiveness: ratio of outcomes for each unit of input
Focus on Resources
• Resources are often the first and only focus
  of some CB strategies

• Typical CB strategies resorted to are
  - staff increases
  - training
  - computerization
  - increased operating budgets
Category 3 Factors - Management
  Infrastructure
         Management Infrastructure
            System + Structure + Strategy
           (Processes)            (Policy)

  Resources
•Staff
•Budgets                        Outputs      Outcomes
•Technology
•Equipment
•Physical Assets
Structure
• Clarity of Accountabilities & Reporting
  Relationships

• Span of Control

• Level of Delegation

• Quality of Outreach to Client

• Checks and Balances

• Structure can complicate Processes
Systems and Processes
•   Planning and Decision Making Systems
•   The Client Interface System
•   The Product Delivery System
•   The Financial Management System
•   The HR Management System
•   The Information Management System
•   Performance Monitoring and Reporting System
Structure
• Clarity of Accountabilities & Reporting
  Relationships

• Span of Control

• Level of Delegation

• Quality of Outreach to Client

• Checks and Balances

• Structure can complicate Processes
Systems and Processes

•   Planning and Decision Making Systems
•   The Client Interface System
•   The Product Delivery System
•   The Financial Management System
•   The HR Management System
•   The Information Management System
•   Performance Monitoring and Reporting System
Vision (Leadership)

• Is the “Core Ideology”

• Primary Driver

• Impels Change & Results

• Is the priority accountability of leadership

• Is the clearest reflection of quality of leadership
Typical Values

• Quality Consciousness

• Client orientation

• Teamwork

• Innovation

• Openness to Change
Values - Culture

• The fundamental Guiding Principles
• The unsaid but expected behaviors
• The ‘norms’; what is considered
  important
• The favored patterns of interaction
• The way we do things around here
• The ‘management style’
The Drivers

              Vision and Values
                      OR
            Leadership and Culture

• Efficiency is a function of Management
  Infrastructure

• Effectiveness is a function of Leadership and
  Culture
Organization Model for
      Diagnostic Analysis

            Vision    Values

     Systems    Structure   Strategy

Resources                      Results

Introduction to RBM

  • 1.
    Results Based Management Introduction to Results Based Management
  • 2.
    Origins of ResultsBased Management? • Began with Peter Drucker and MBO in 60s • Evolved into the Logical Framework for the Public Sector in 70s • Adopted vigorously by UK and New Zealand in 80s and USA and OECD countries in 90s • Formally became one aspect of New Public Management in 90s • Is now being adopted to direct and justify increased development aid.
  • 3.
    What is ResultsBased Management • Focuses on tangible results to be delivered • Clarifies Clients and Mandate of Organization • Promotes Benchmarking and Performance Analysis • It emphasizes value-for-money
  • 4.
    Why Results Based Management? • The public want better services • More effective resource allocation • Private sector seeks improved infrastructure and services • The public sector agency wants to perform more efficiently and effectively
  • 5.
    Starting Point isPerformance/ Results • Why does this organization exist? • What would be lost if it did not exist? • Who does it serve? • What is it supposed to deliver for them?
  • 6.
    Alternative Approaches to Managing Performance Management by Inputs/Activities • Success is measured by expenditure and/or extent of activity. (How much did we spend on this workshop?)
  • 7.
    Alternative Approaches to Managing Performance Management by Outputs • Success is measured by the extent of goods/services delivered and the ratio of inputs to outputs.
  • 8.
    Alternative Approaches to Managing Performance • Success is measured by effects/impacts achieved, and their sustainability. (What were the concrete agreements arrived at? - After six months: Have these been fulfilled? - Is the quality of Performance Management improving?)
  • 9.
    Recent Approaches to Performance (Results) Management • Input - Output - Outcome Indicators • Client Satisfaction Surveys • Balanced Scorecard Approach
  • 10.
    Key RBM Concepts Inputs _____ Outputs Outcomes Activities
  • 11.
    Key RBM Concepts Input/ Activities = Used to Produce Outputs Outputs = Produce or Service Delivered Outcome = Result or Effect or Impact of the Output KRA = Operating Areas in which outputs have to be delivered
  • 12.
    Outputs / Outcomes •Outputs are generally under direct control of agency • Outcomes are not under complete control - are subject to numerous other influences - only surface over time - hence, attribution becomes an issue
  • 13.
    Intermediate Final Inputs Outputs Outcomes Outcomes New WS Access to System Drinking Water Reduced • Staff New Waste Proper Garbage Infectious • Resources Mtg System Disposal Diseases Health Personal Education Cleanliness Program
  • 14.
    Public Sector Performance •At a National Level • At a Sector Level • At an Institution Level • At a Project Level
  • 15.
    Client Satisfaction -The Report • Covers Essential Services • Focus on Processes, Outputs, Outcomes • Uses Sample Surveys
  • 16.
    Composite Result Indicators •Effectiveness Ratio of inputs to outcomes achieved • Equity Extent of access to service by different clients groups • Efficiency Ratio of inputs to outputs • Sustainability Ability to sustain operations financially
  • 17.
    Integral to CapacityBuilding • RBM drives continuous performance improvement • Performance information of RBM is essential for CB - benchmarking, performance shortfalls, cause analysis • Can’t do meaningful CB without RBM
  • 18.
    The Diagnostic Approach •Begins with the analysis of performance • Identifies critical performance gaps or opportunities for improvement • Works back to identify variables influence performance • Develops an Organization Development Plan to address constraining variables
  • 19.
    Begin with ExpectedResults • ‘Performance Report’ is essential • Identify performance variances in order of priority • If performance variance is not clearly identified - diagnosis is not possible - capacity building initiative will be directionless
  • 20.
    Performance Variance Expected Performance…… variance Actual Performance Expected performance ……… variance Actual performance
  • 21.
    Category 1 Factors- Clarify of Results Outputs Outcomes
  • 22.
    Category 1 Factors- Results / Performance Expectations • Are performance results specified? • Are there clear standards and / targets? • Are performance results monitored and analyzed for improvement? • Is performance periodically reported? • Is performance periodically audited?
  • 23.
    Category 2 Factors- Resources Resources Results • Staff / Skills • Budgets • Technology Outputs Outcomes •Equipment •Physical Assets
  • 24.
    Resources and Performance •The ‘Wheels’ on which the organization runs • Proportionality between Inputs and Outputs - Efficiency: ratio of outputs for each unit of input - Effectiveness: ratio of outcomes for each unit of input
  • 25.
    Focus on Resources •Resources are often the first and only focus of some CB strategies • Typical CB strategies resorted to are - staff increases - training - computerization - increased operating budgets
  • 26.
    Category 3 Factors- Management Infrastructure Management Infrastructure System + Structure + Strategy (Processes) (Policy) Resources •Staff •Budgets Outputs Outcomes •Technology •Equipment •Physical Assets
  • 27.
    Structure • Clarity ofAccountabilities & Reporting Relationships • Span of Control • Level of Delegation • Quality of Outreach to Client • Checks and Balances • Structure can complicate Processes
  • 28.
    Systems and Processes • Planning and Decision Making Systems • The Client Interface System • The Product Delivery System • The Financial Management System • The HR Management System • The Information Management System • Performance Monitoring and Reporting System
  • 29.
    Structure • Clarity ofAccountabilities & Reporting Relationships • Span of Control • Level of Delegation • Quality of Outreach to Client • Checks and Balances • Structure can complicate Processes
  • 30.
    Systems and Processes • Planning and Decision Making Systems • The Client Interface System • The Product Delivery System • The Financial Management System • The HR Management System • The Information Management System • Performance Monitoring and Reporting System
  • 31.
    Vision (Leadership) • Isthe “Core Ideology” • Primary Driver • Impels Change & Results • Is the priority accountability of leadership • Is the clearest reflection of quality of leadership
  • 32.
    Typical Values • QualityConsciousness • Client orientation • Teamwork • Innovation • Openness to Change
  • 33.
    Values - Culture •The fundamental Guiding Principles • The unsaid but expected behaviors • The ‘norms’; what is considered important • The favored patterns of interaction • The way we do things around here • The ‘management style’
  • 34.
    The Drivers Vision and Values OR Leadership and Culture • Efficiency is a function of Management Infrastructure • Effectiveness is a function of Leadership and Culture
  • 35.
    Organization Model for Diagnostic Analysis Vision Values Systems Structure Strategy Resources Results