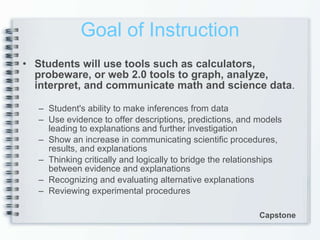
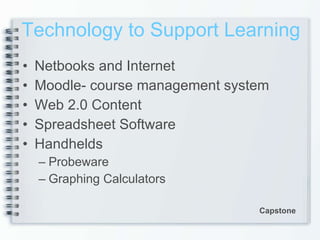
Dwayne Squires Oral Defense
Introduction Part I
Eleanor McKenzie Penny Squires WGU Alumni ‘04 Dwayne Squires December 2010 Introduction Family
Personal Interests Introduction © BBC 2010
Canton Middle School Technology Facilitator (2 years) Math & Science Teacher (5 years) Christ School Math, Technology Teacher, Dorm Parent (2.5 years) A-B Tech Cisco & Networking Teacher (.5 years) Mars Hill College Education Department Technology Facilitator &  Library of Congress American Memory Fellow (1.5 years) Buncombe County Schools Math & Science Teacher (3 years) Asheville City Schools Technology Facilitator (2 years) Math & Science Teacher (2 years) Introduction Career
Capstone Part II LOC.gov
Problem Overview Students have trouble in the four areas of graph and data analysis :  identifying and collecting data  organizing data analyzing and interpreting data* translating and displaying data* By the eighth grade students are expected to understand concepts that seem too abstract and have little concrete reality in the life of a typical thirteen year old.   Capstone
What are the needs for and causes of remediation -> leading to appropriate course design;   Lack of rigor, lack of understanding of college expectations, graduation standards not meeting college requirements? Course design offers solution to these issues Change in curriculum and instruction  Using innovative methods, tools, technology Attitude and Achievement What  technology offers promising research results; Handheld technology tool of choice (ex.: graphing calculator). Immediacy of results Engagement beyond pencil paper tasks Prediction of results and repetition of activities What are some innovative methods of instruction using these tools and technology in the science and mathematics classrooms. technology integration when combined with appropriate pedagogies provides additional opportunities for learning and understanding, makes learning more relevant, challenging, authentic, and exploratory  uniqueness of the hand-held technology allows for students to collect data in real time, to view graphs of the data in real time, and to make a more immediate connection between the concepts being studied and the representations of that concept  Literature Review Overview Capstone
Needs Analysis Population Characteristics Demographics: Education, poverty, ethnicity Cultural: Physical/Social Division, employment, technology access Unique: Standardized Testing Scores, EC/504 Identification, Attitude/Achievement Requisite Skills & Knowledge Basic reading and mathematics skills and knowledge Prior Skills & Knowledge Correlation of state Math and Science goals Attitude & Motivation Cultural Middle School Students Capstone
Goal of Instruction Students will use tools such as calculators, probeware, or web 2.0 tools to graph, analyze, interpret, and communicate math and science data .  Student's ability to make inferences from data Use evidence to offer descriptions, predictions, and models leading to explanations and further investigation Show an increase in communicating scientific procedures, results, and explanations Thinking critically and logically to bridge the relationships between evidence and explanations Recognizing and evaluating alternative explanations Reviewing experimental procedures Capstone
Overview of Objectives Graph, Analyze, Interpret and Communicate Math and Science Data Students have trouble in the four areas of graph and data analysis: identifying and collecting data organizing data analyzing and interpreting data translating and displaying data Concepts too abstract and have little concrete reality in the life of a 13yr old  "Science as Inquiry" relies on the ability and desire of students to go beyond the simple completion of a task  The Goal of Instruction and afore mentioned concerns are addressed in the 17 objectives Capstone
Instructional Strategies Three lessons ~ 10 hours of instruction Lesson 1: Virtual Owl Pellet Dissection None of the specific 17 performance objectives High Interest  Groundwork Addresses important science and mathematics standards Lesson 2: Description and Measurement Performance Objectives 7-11, 13-15, 17 Lesson 3: Drawings, Tables, Graphs Performance Objectives 1-6, 12, 16 Capstone
Technology to Support Learning Netbooks and Internet Moodle- course management system Web 2.0 Content Spreadsheet Software Handhelds Probeware Graphing Calculators Capstone
Examples of Technology Netbooks and Internet provided at school and in class as a part of the regular routine of learning and instruction  (IMPACT Grant) Moodle- Every teacher has access to a moodle classroom.  This was setup outside of the school for simplicity sake.  ( Moodlehub.com ) Web 2.0 Content Virtual Owl Pellet Dissection Lab ( KidsWings.com ) Dirty Jobs Video (Discovery.com) Flash games: food-chains and food-webs (BBC.com) Slideshare.net: Powerpoint presentation moodle plug-in Spreadsheet software   Microsoft Office Excel Handhelds Probeware: Temperature mini-Lab Graphing Calculators: Display of data collected in labs Capstone
Phases of Formative Evaluation SME (2) One-to-One (3) Small Group (26) Capstone Dick & Carey © 2001
Evaluation Instruments Subject Matter Experts  SME Checklist  SME Interview Questionnaire  One-to-One  Post Test: Multiple Choice & Lab Interview Questionnaire & Open Ended Small Group  Post Test: Multiple Choice & Lab Interview Questionnaire & Open Ended Capstone
Results:  Summary of Objectives and Post Test Data SME No major revisions necessary One-to-One Need for a revision in the criteria for meeting seven of the objectives: 2, 7, 10, 12, 16, and 17  Some post test questions reworded for clarity Interview uninformative Students felt better about their understanding than they actually mastered the content Small Group Revision paid off Lengthen post test.  Further validity assessment Interview again uninformative Triangulation of Data Showed no problems Capstone
Domains Part II Instructional Design Research Fundamentals Technology Integration Measurement and Evaluation
Instructional Design What I Learned ADDIE Model Dick and Carey Model Instructional Theories Behaviorism Constructivism Cognitivism Social Learning Domains Application to Workspace More Reflective Practitioner Look at instruction for the first time through an ID framework. Dick & Carey © 2001
Research Fundamentals Domains What I Learned Was less of what I learned and more of how it was refreshed. Since my undergraduate degree was from a undergraduate research based institution. Application to Workspace Reminded me that  research is appropriate conducted in the classroom Research is important to be consumed by the classroom teacher Instruction should be research based Was the source of research for the IMPACT grant at our school.
Technology Integration Domains What I Learned M.D. Roblyer Vast amounts of technology research relating directly to my  instruction Application to Workspace Modeled classroom instructional methods and options for technology integrated instruction to other teachers. Staff Development Became the Tech Facilitator for our school
Measurement and Evaluation Domains What I Learned Evaluation vs. Assessment Formative vs. Summative Application to Workspace These fit in so well again with the IMPACT model We are doing a lot of evaluation and assessment at CMS Helps me explain to colleagues what these really mean
Summary Research: Technology does work @ CMS and is supported by research Handheld technology is beneficial to math and science classroom More research to be done in this area Personal Full time: student, parent, spouse…  What is important vs. What is necessary Surprised at what I had learned since I was an undergraduate, and at what I was able to learn in an online setting Open doors and opportunities to serve in a greater capacity working with students and teachers PowerPoint  note pad template www.presentationmagazine.com

Oral Defense presentation

  • 1.
  • 2.
  • 3.
    Eleanor McKenzie PennySquires WGU Alumni ‘04 Dwayne Squires December 2010 Introduction Family
  • 4.
  • 5.
    Canton Middle SchoolTechnology Facilitator (2 years) Math & Science Teacher (5 years) Christ School Math, Technology Teacher, Dorm Parent (2.5 years) A-B Tech Cisco & Networking Teacher (.5 years) Mars Hill College Education Department Technology Facilitator & Library of Congress American Memory Fellow (1.5 years) Buncombe County Schools Math & Science Teacher (3 years) Asheville City Schools Technology Facilitator (2 years) Math & Science Teacher (2 years) Introduction Career
  • 6.
  • 7.
    Problem Overview Studentshave trouble in the four areas of graph and data analysis : identifying and collecting data organizing data analyzing and interpreting data* translating and displaying data* By the eighth grade students are expected to understand concepts that seem too abstract and have little concrete reality in the life of a typical thirteen year old.  Capstone
  • 8.
    What are theneeds for and causes of remediation -> leading to appropriate course design; Lack of rigor, lack of understanding of college expectations, graduation standards not meeting college requirements? Course design offers solution to these issues Change in curriculum and instruction Using innovative methods, tools, technology Attitude and Achievement What technology offers promising research results; Handheld technology tool of choice (ex.: graphing calculator). Immediacy of results Engagement beyond pencil paper tasks Prediction of results and repetition of activities What are some innovative methods of instruction using these tools and technology in the science and mathematics classrooms. technology integration when combined with appropriate pedagogies provides additional opportunities for learning and understanding, makes learning more relevant, challenging, authentic, and exploratory uniqueness of the hand-held technology allows for students to collect data in real time, to view graphs of the data in real time, and to make a more immediate connection between the concepts being studied and the representations of that concept Literature Review Overview Capstone
  • 9.
    Needs Analysis PopulationCharacteristics Demographics: Education, poverty, ethnicity Cultural: Physical/Social Division, employment, technology access Unique: Standardized Testing Scores, EC/504 Identification, Attitude/Achievement Requisite Skills & Knowledge Basic reading and mathematics skills and knowledge Prior Skills & Knowledge Correlation of state Math and Science goals Attitude & Motivation Cultural Middle School Students Capstone
  • 10.
    Goal of InstructionStudents will use tools such as calculators, probeware, or web 2.0 tools to graph, analyze, interpret, and communicate math and science data . Student's ability to make inferences from data Use evidence to offer descriptions, predictions, and models leading to explanations and further investigation Show an increase in communicating scientific procedures, results, and explanations Thinking critically and logically to bridge the relationships between evidence and explanations Recognizing and evaluating alternative explanations Reviewing experimental procedures Capstone
  • 11.
    Overview of ObjectivesGraph, Analyze, Interpret and Communicate Math and Science Data Students have trouble in the four areas of graph and data analysis: identifying and collecting data organizing data analyzing and interpreting data translating and displaying data Concepts too abstract and have little concrete reality in the life of a 13yr old "Science as Inquiry" relies on the ability and desire of students to go beyond the simple completion of a task The Goal of Instruction and afore mentioned concerns are addressed in the 17 objectives Capstone
  • 12.
    Instructional Strategies Threelessons ~ 10 hours of instruction Lesson 1: Virtual Owl Pellet Dissection None of the specific 17 performance objectives High Interest Groundwork Addresses important science and mathematics standards Lesson 2: Description and Measurement Performance Objectives 7-11, 13-15, 17 Lesson 3: Drawings, Tables, Graphs Performance Objectives 1-6, 12, 16 Capstone
  • 13.
    Technology to SupportLearning Netbooks and Internet Moodle- course management system Web 2.0 Content Spreadsheet Software Handhelds Probeware Graphing Calculators Capstone
  • 14.
    Examples of TechnologyNetbooks and Internet provided at school and in class as a part of the regular routine of learning and instruction (IMPACT Grant) Moodle- Every teacher has access to a moodle classroom. This was setup outside of the school for simplicity sake. ( Moodlehub.com ) Web 2.0 Content Virtual Owl Pellet Dissection Lab ( KidsWings.com ) Dirty Jobs Video (Discovery.com) Flash games: food-chains and food-webs (BBC.com) Slideshare.net: Powerpoint presentation moodle plug-in Spreadsheet software Microsoft Office Excel Handhelds Probeware: Temperature mini-Lab Graphing Calculators: Display of data collected in labs Capstone
  • 15.
    Phases of FormativeEvaluation SME (2) One-to-One (3) Small Group (26) Capstone Dick & Carey © 2001
  • 16.
    Evaluation Instruments SubjectMatter Experts SME Checklist SME Interview Questionnaire One-to-One Post Test: Multiple Choice & Lab Interview Questionnaire & Open Ended Small Group Post Test: Multiple Choice & Lab Interview Questionnaire & Open Ended Capstone
  • 17.
    Results: Summaryof Objectives and Post Test Data SME No major revisions necessary One-to-One Need for a revision in the criteria for meeting seven of the objectives: 2, 7, 10, 12, 16, and 17 Some post test questions reworded for clarity Interview uninformative Students felt better about their understanding than they actually mastered the content Small Group Revision paid off Lengthen post test. Further validity assessment Interview again uninformative Triangulation of Data Showed no problems Capstone
  • 18.
    Domains Part IIInstructional Design Research Fundamentals Technology Integration Measurement and Evaluation
  • 19.
    Instructional Design WhatI Learned ADDIE Model Dick and Carey Model Instructional Theories Behaviorism Constructivism Cognitivism Social Learning Domains Application to Workspace More Reflective Practitioner Look at instruction for the first time through an ID framework. Dick & Carey © 2001
  • 20.
    Research Fundamentals DomainsWhat I Learned Was less of what I learned and more of how it was refreshed. Since my undergraduate degree was from a undergraduate research based institution. Application to Workspace Reminded me that research is appropriate conducted in the classroom Research is important to be consumed by the classroom teacher Instruction should be research based Was the source of research for the IMPACT grant at our school.
  • 21.
    Technology Integration DomainsWhat I Learned M.D. Roblyer Vast amounts of technology research relating directly to my instruction Application to Workspace Modeled classroom instructional methods and options for technology integrated instruction to other teachers. Staff Development Became the Tech Facilitator for our school
  • 22.
    Measurement and EvaluationDomains What I Learned Evaluation vs. Assessment Formative vs. Summative Application to Workspace These fit in so well again with the IMPACT model We are doing a lot of evaluation and assessment at CMS Helps me explain to colleagues what these really mean
  • 23.
    Summary Research: Technologydoes work @ CMS and is supported by research Handheld technology is beneficial to math and science classroom More research to be done in this area Personal Full time: student, parent, spouse… What is important vs. What is necessary Surprised at what I had learned since I was an undergraduate, and at what I was able to learn in an online setting Open doors and opportunities to serve in a greater capacity working with students and teachers PowerPoint note pad template www.presentationmagazine.com