
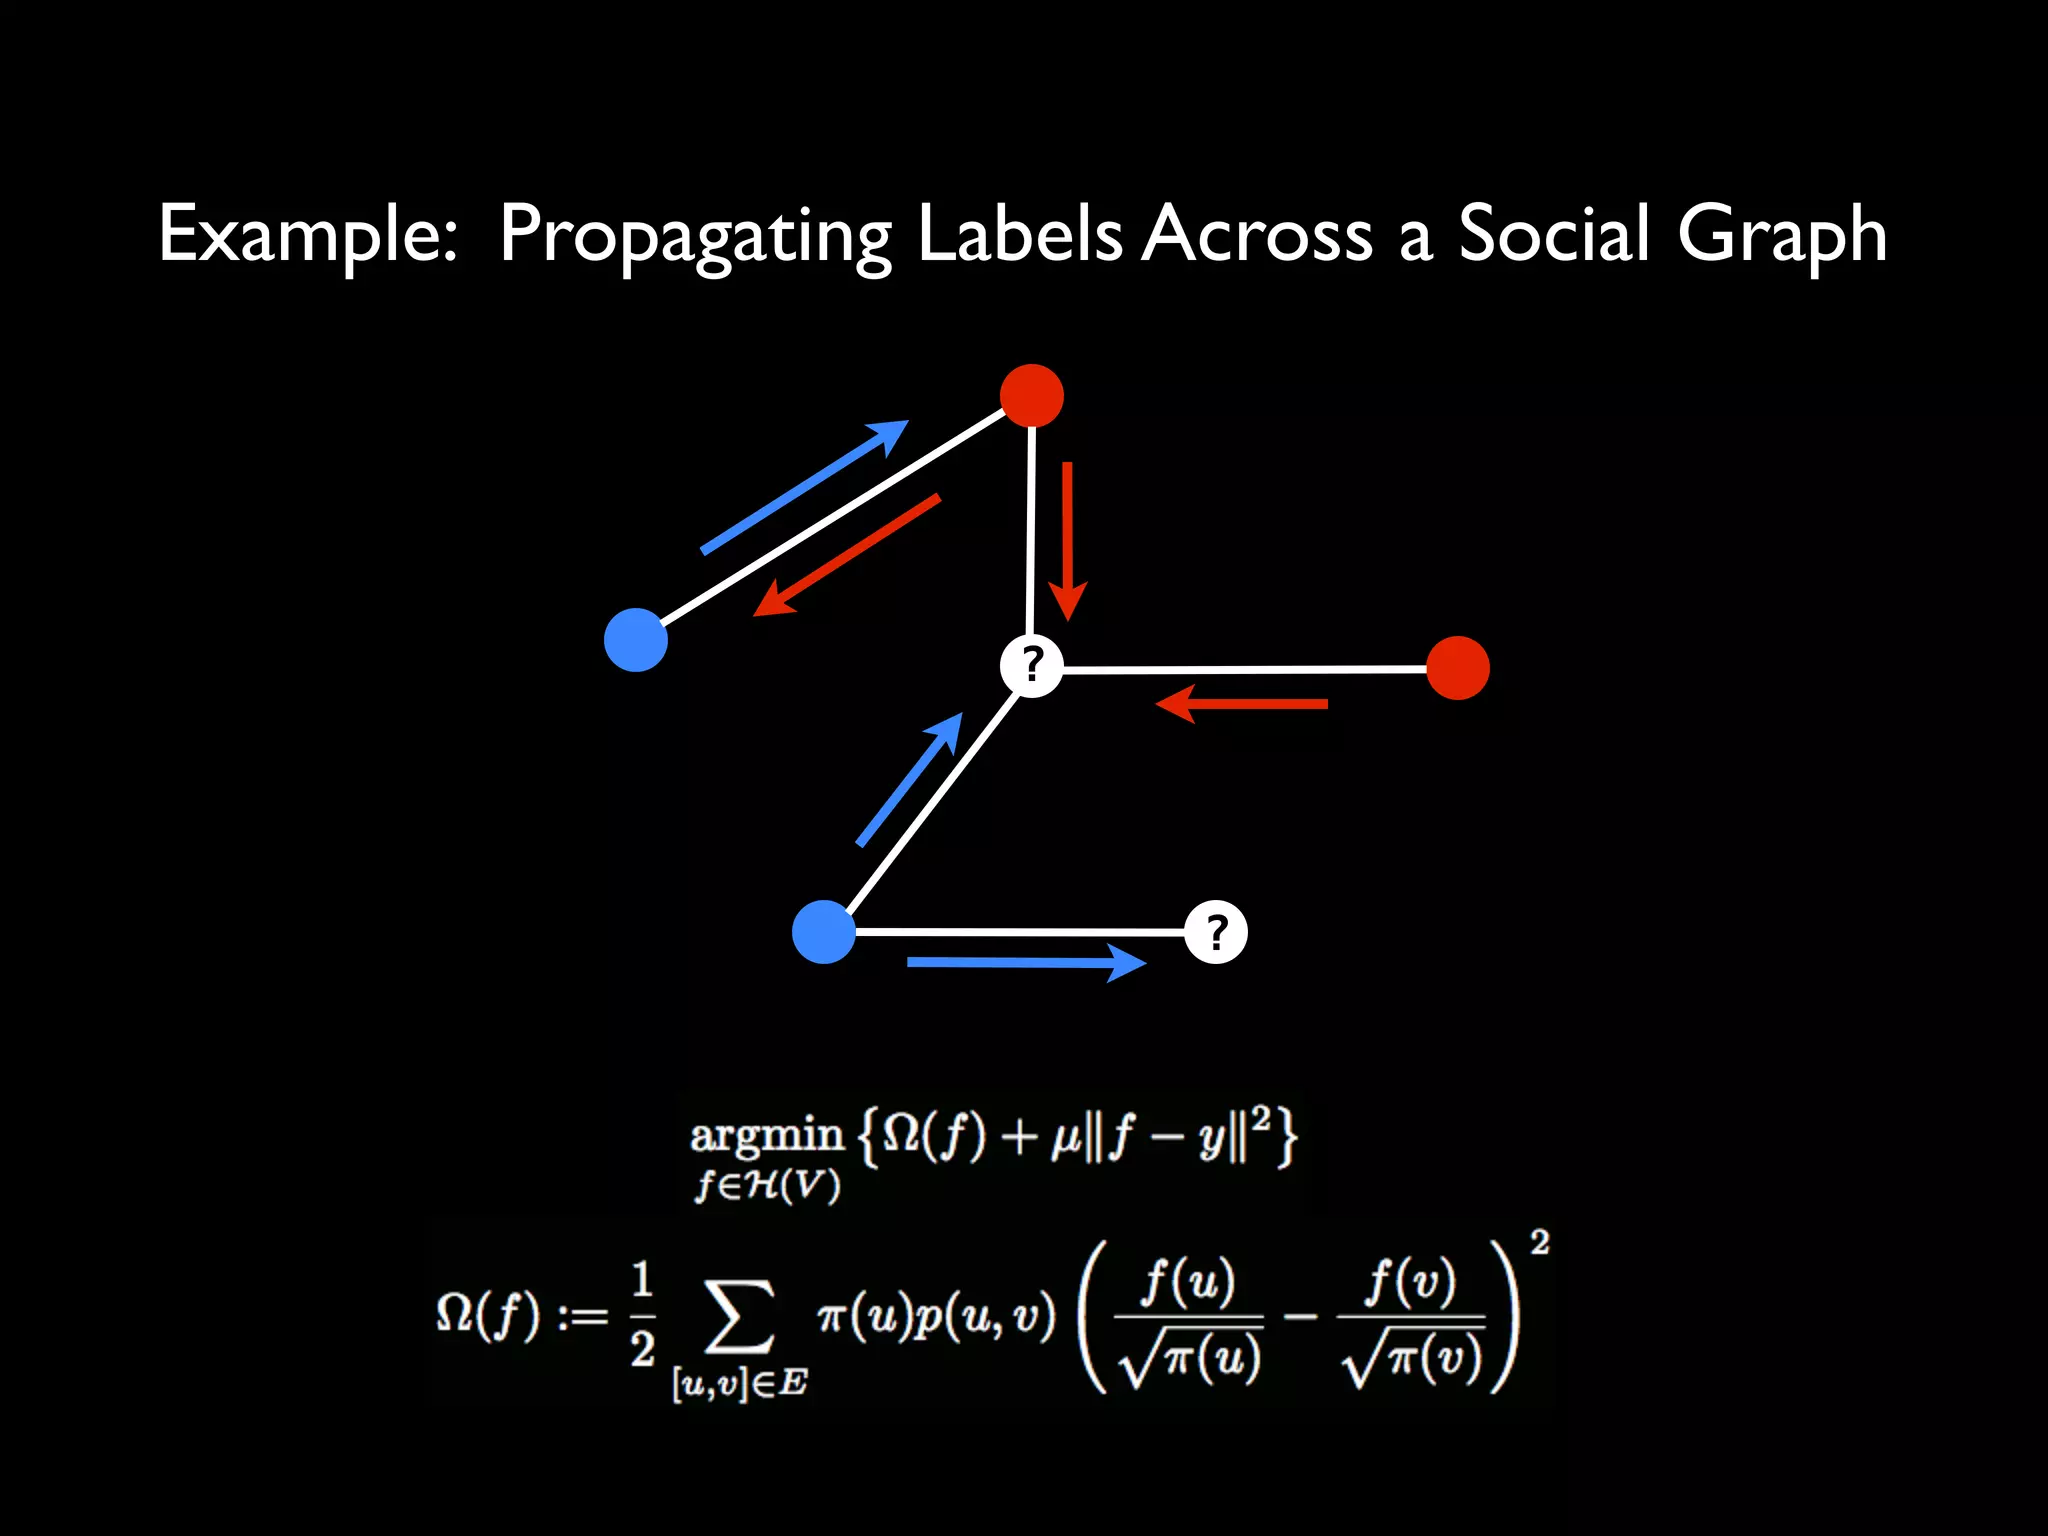
![Example: Propagating Labels Across a Social Graph
?
?
Solution: [Zhou et al. (2005)]](https://image.slidesharecdn.com/optimization-101113140507-phpapp01/75/Optimization-A-Framework-for-Predictive-Analytics-10-2048.jpg)
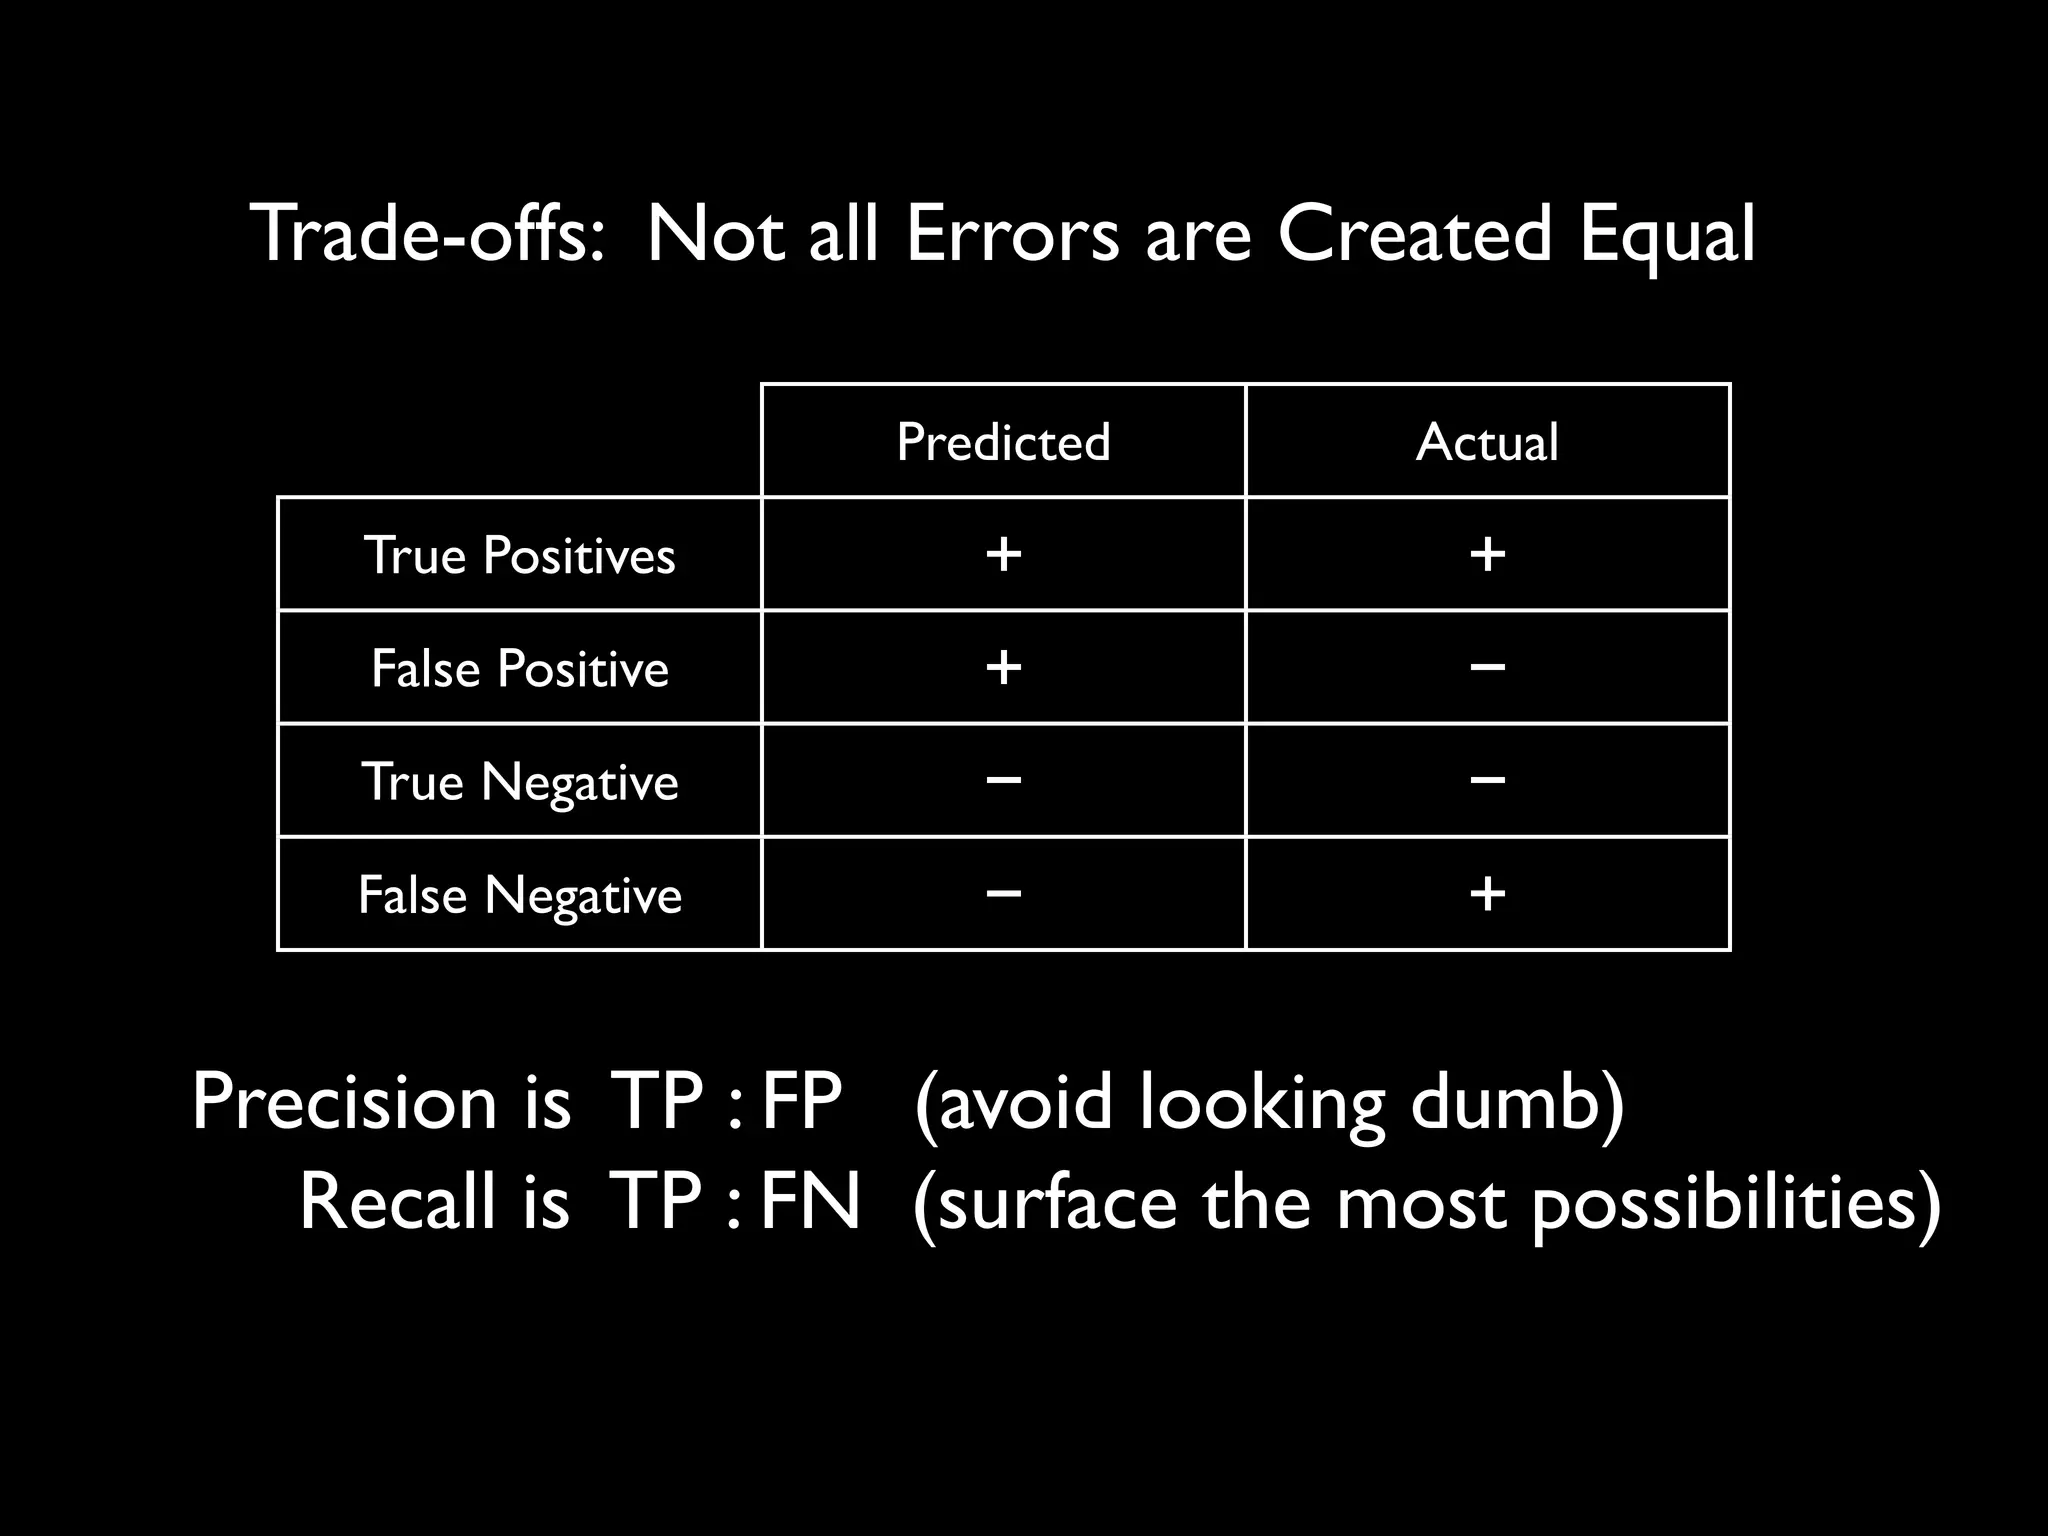
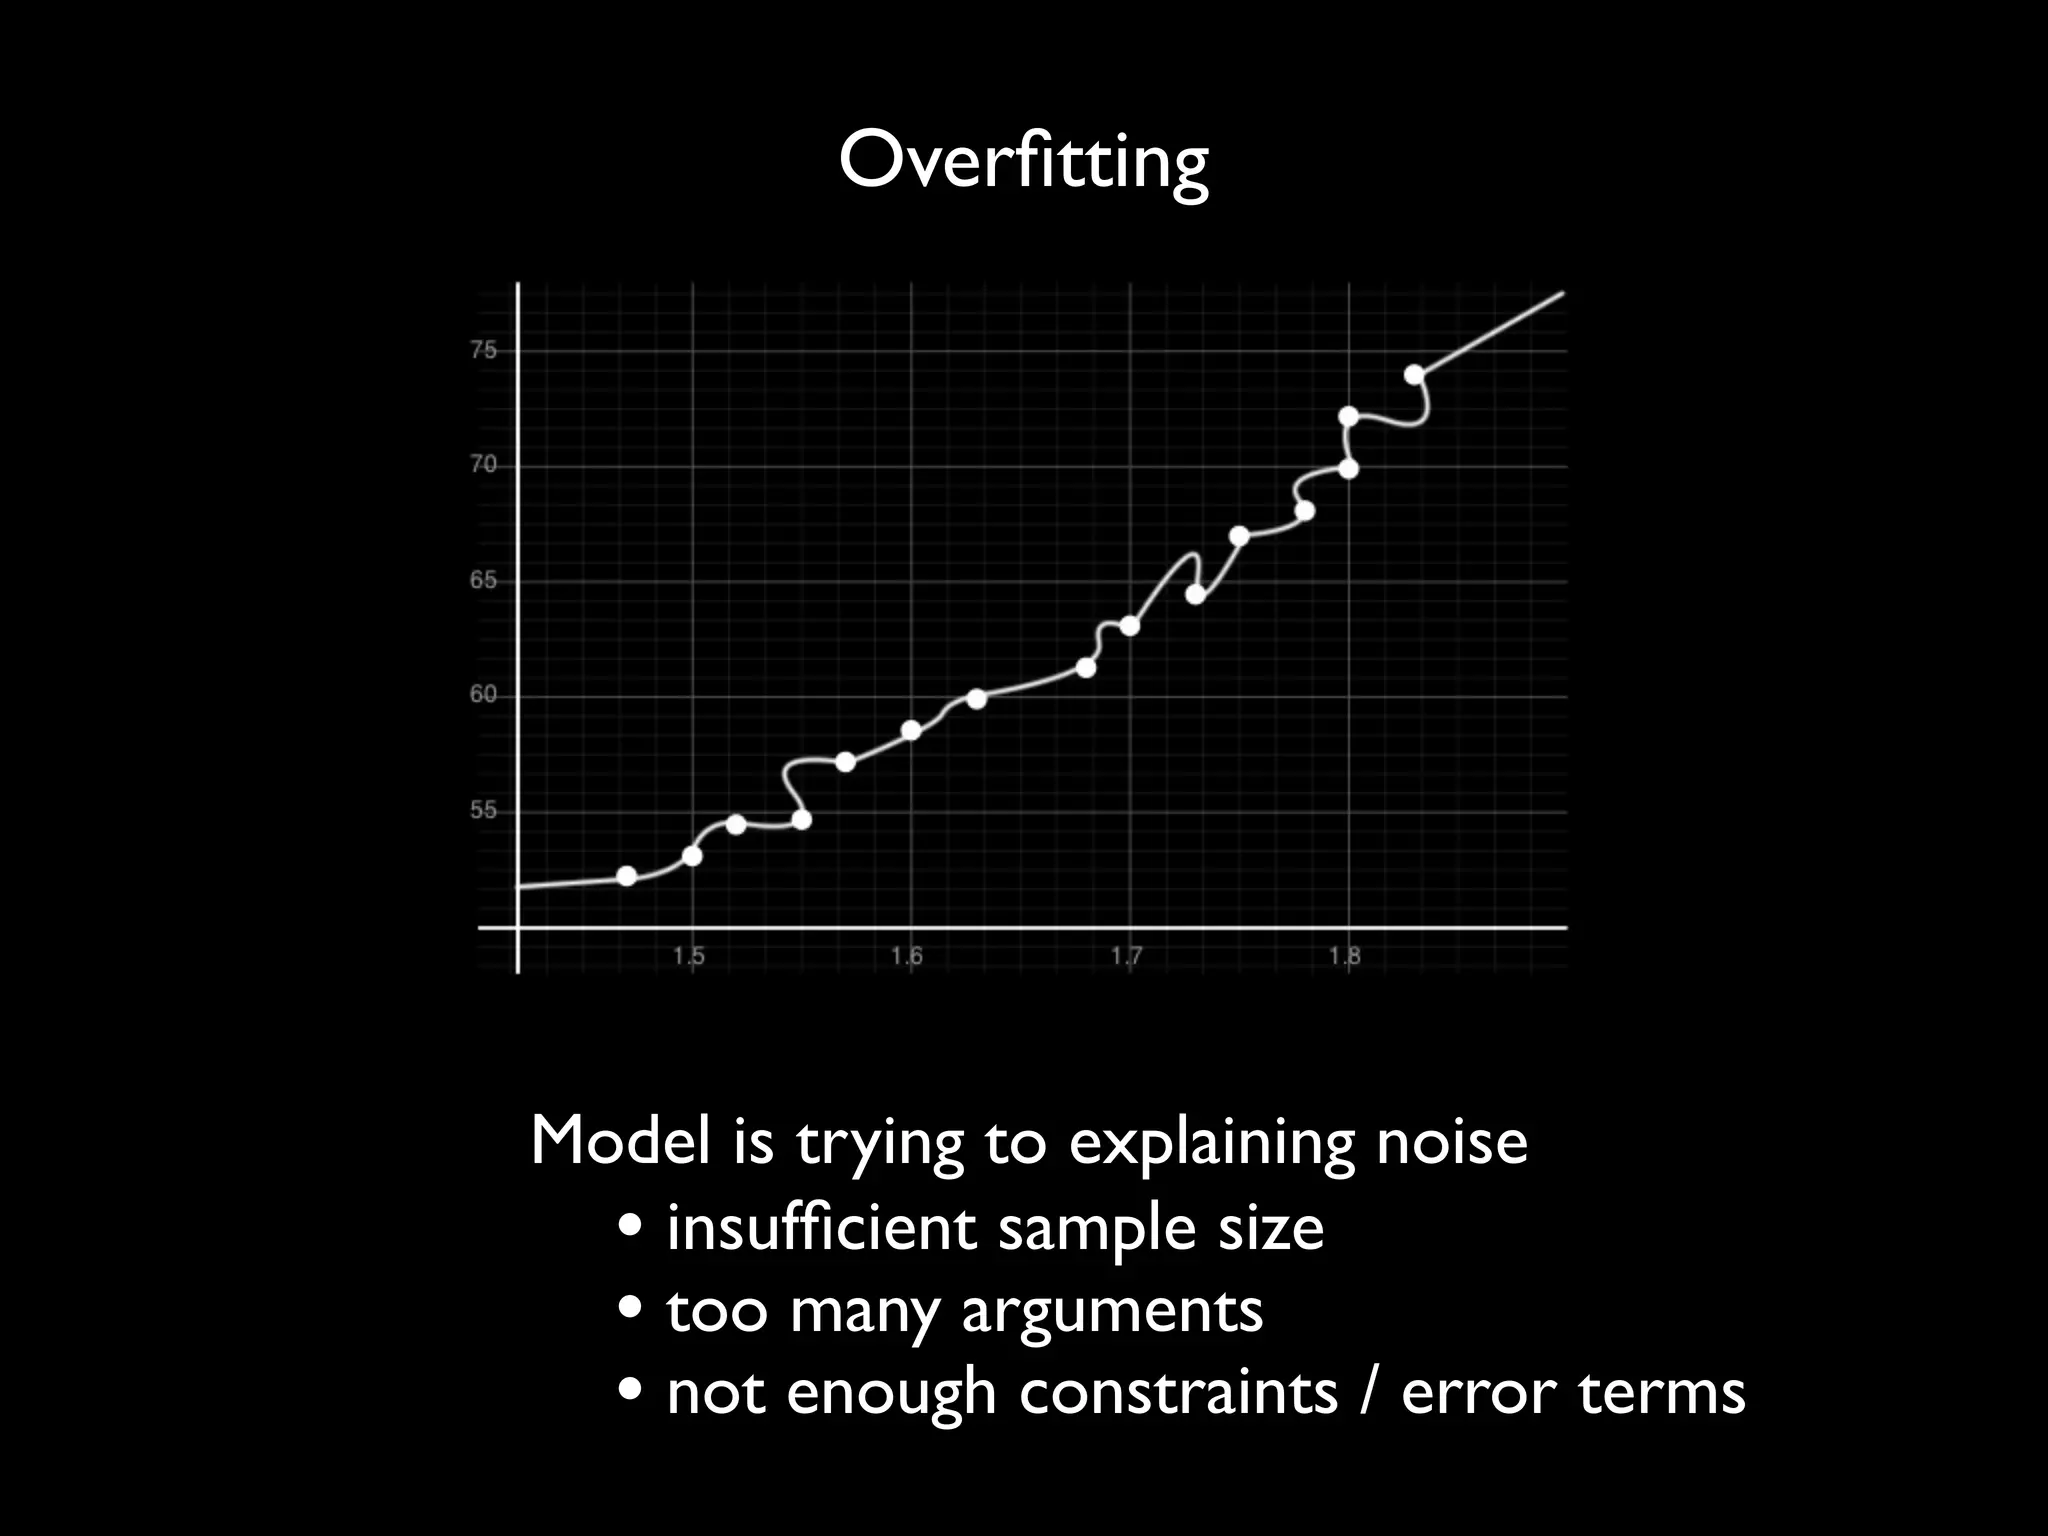

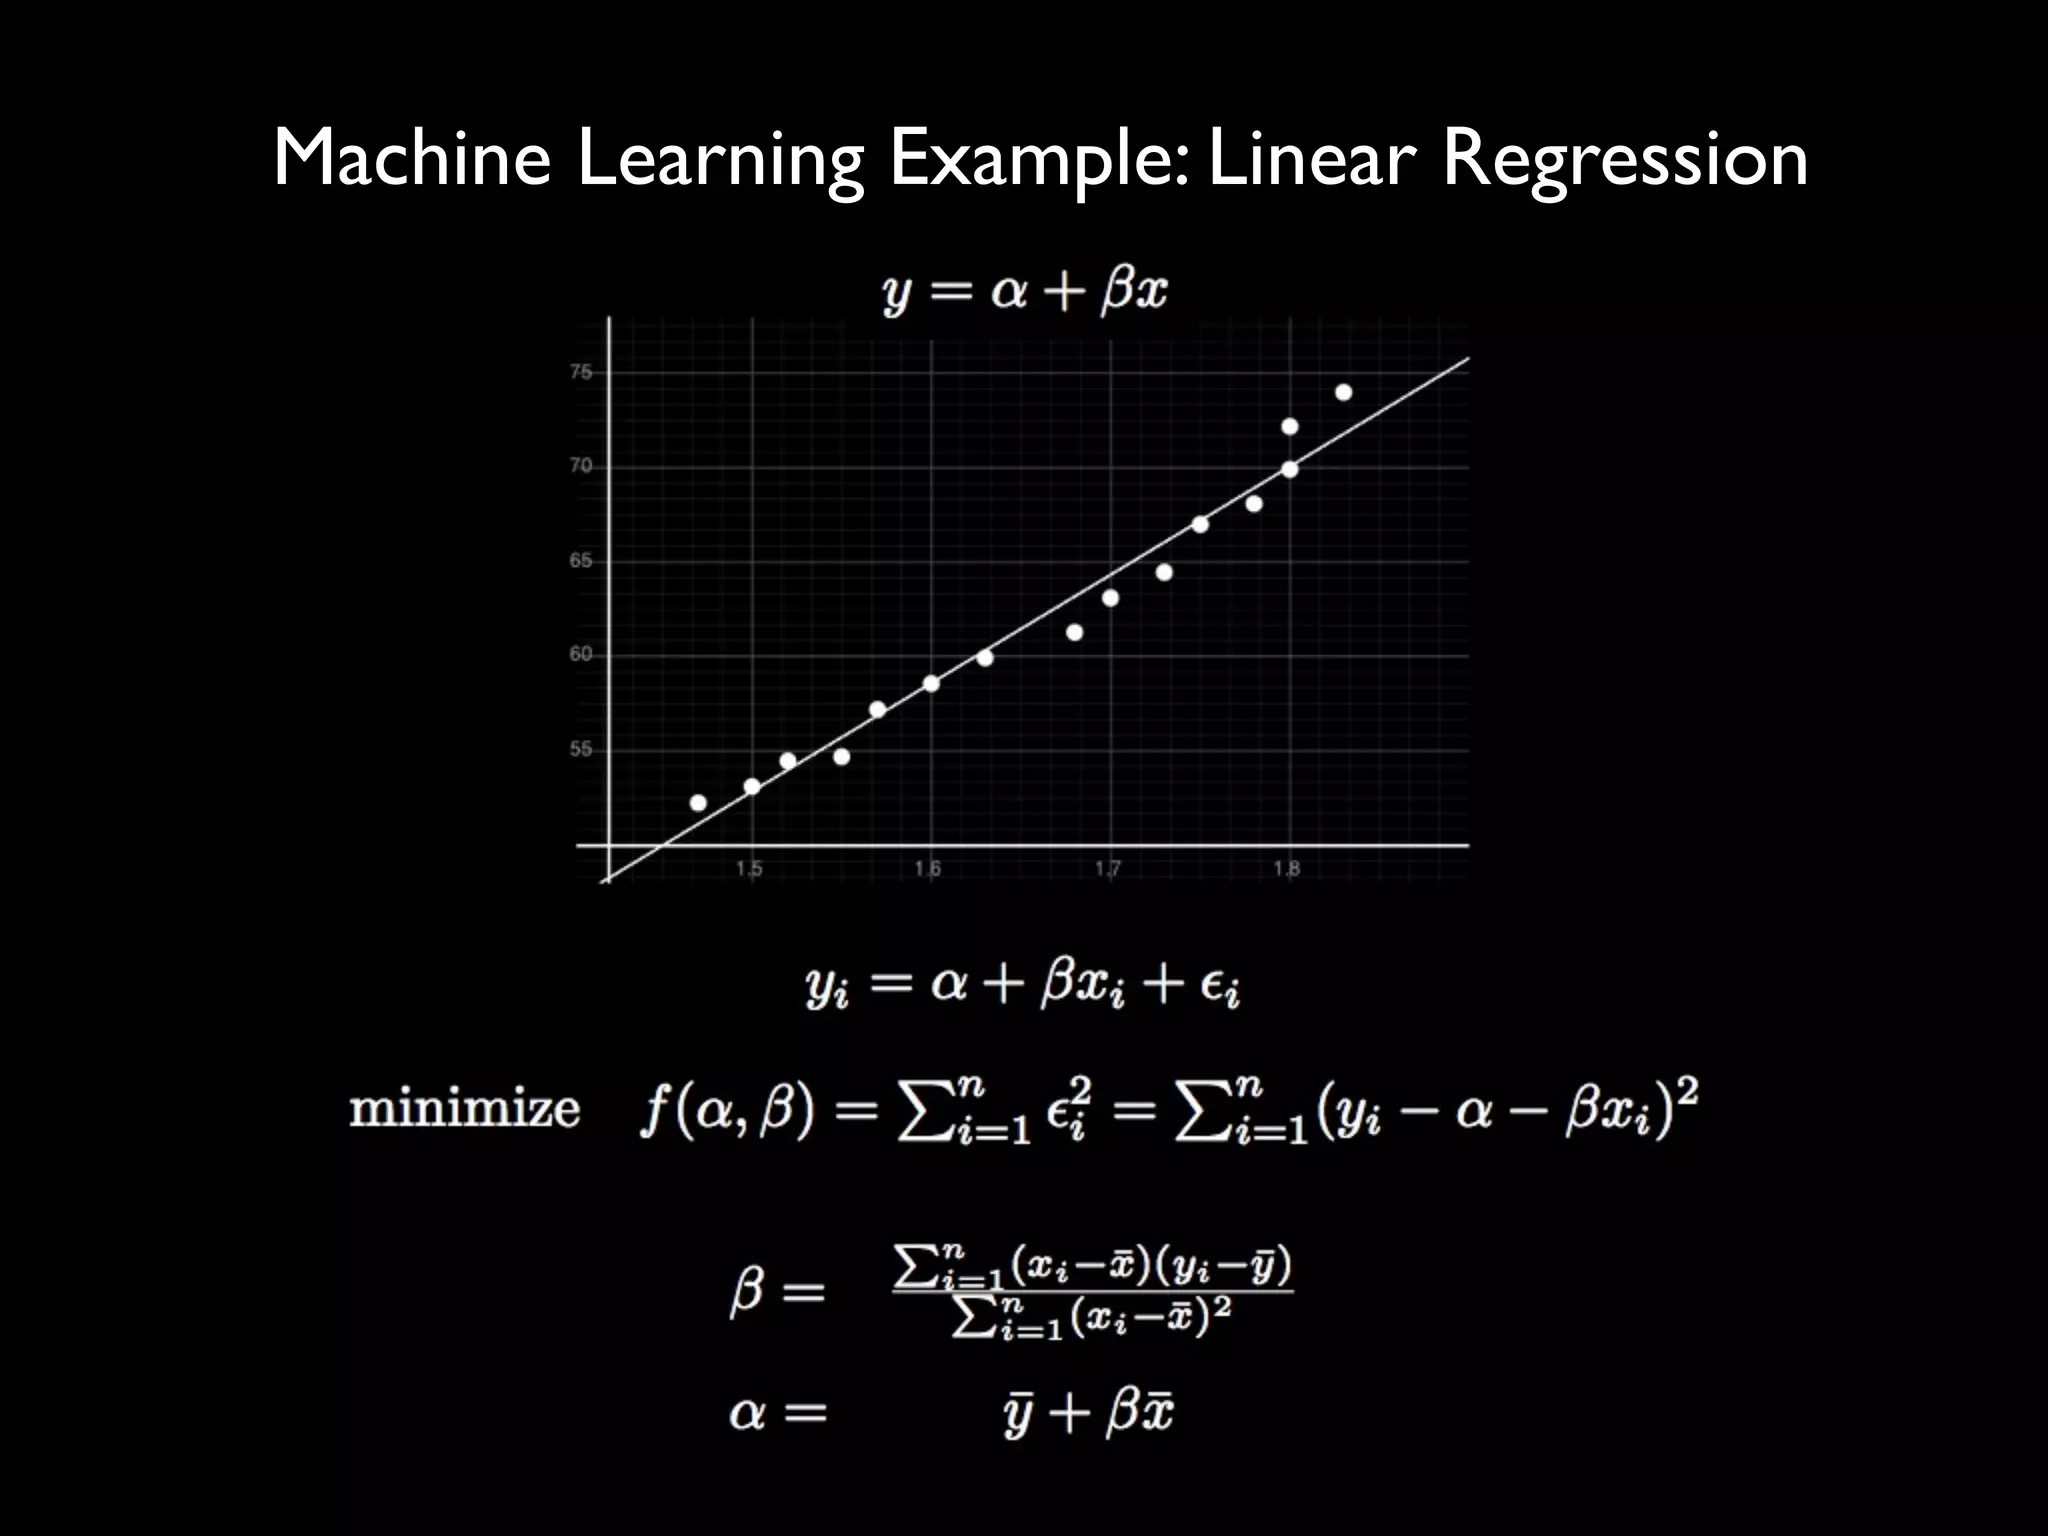
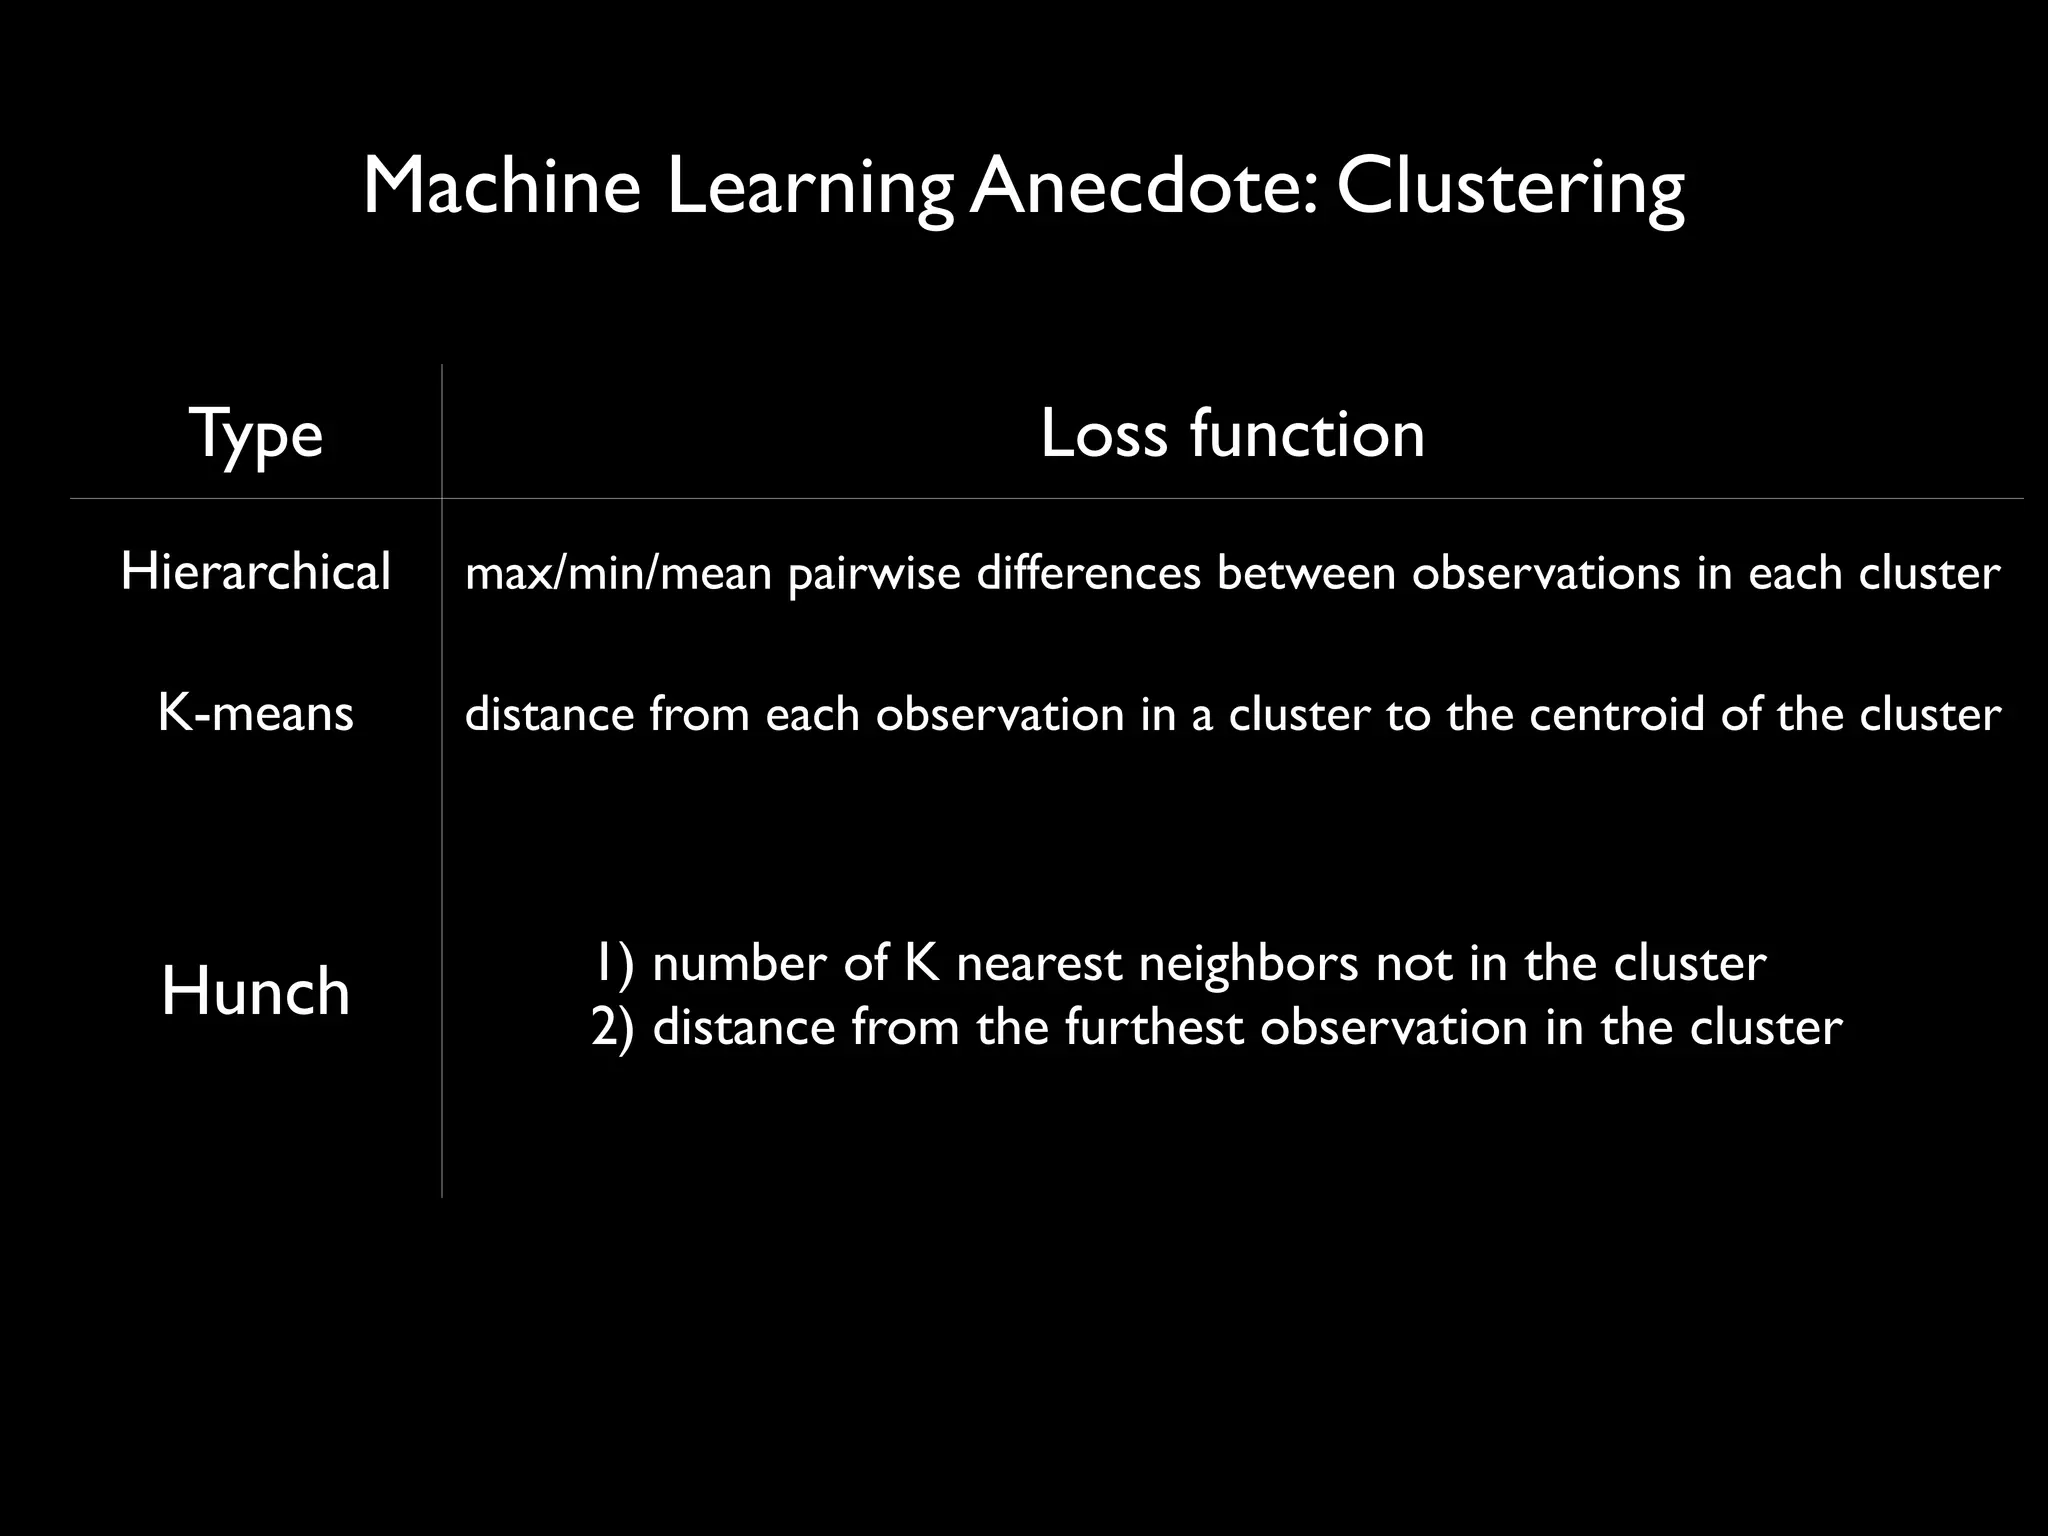
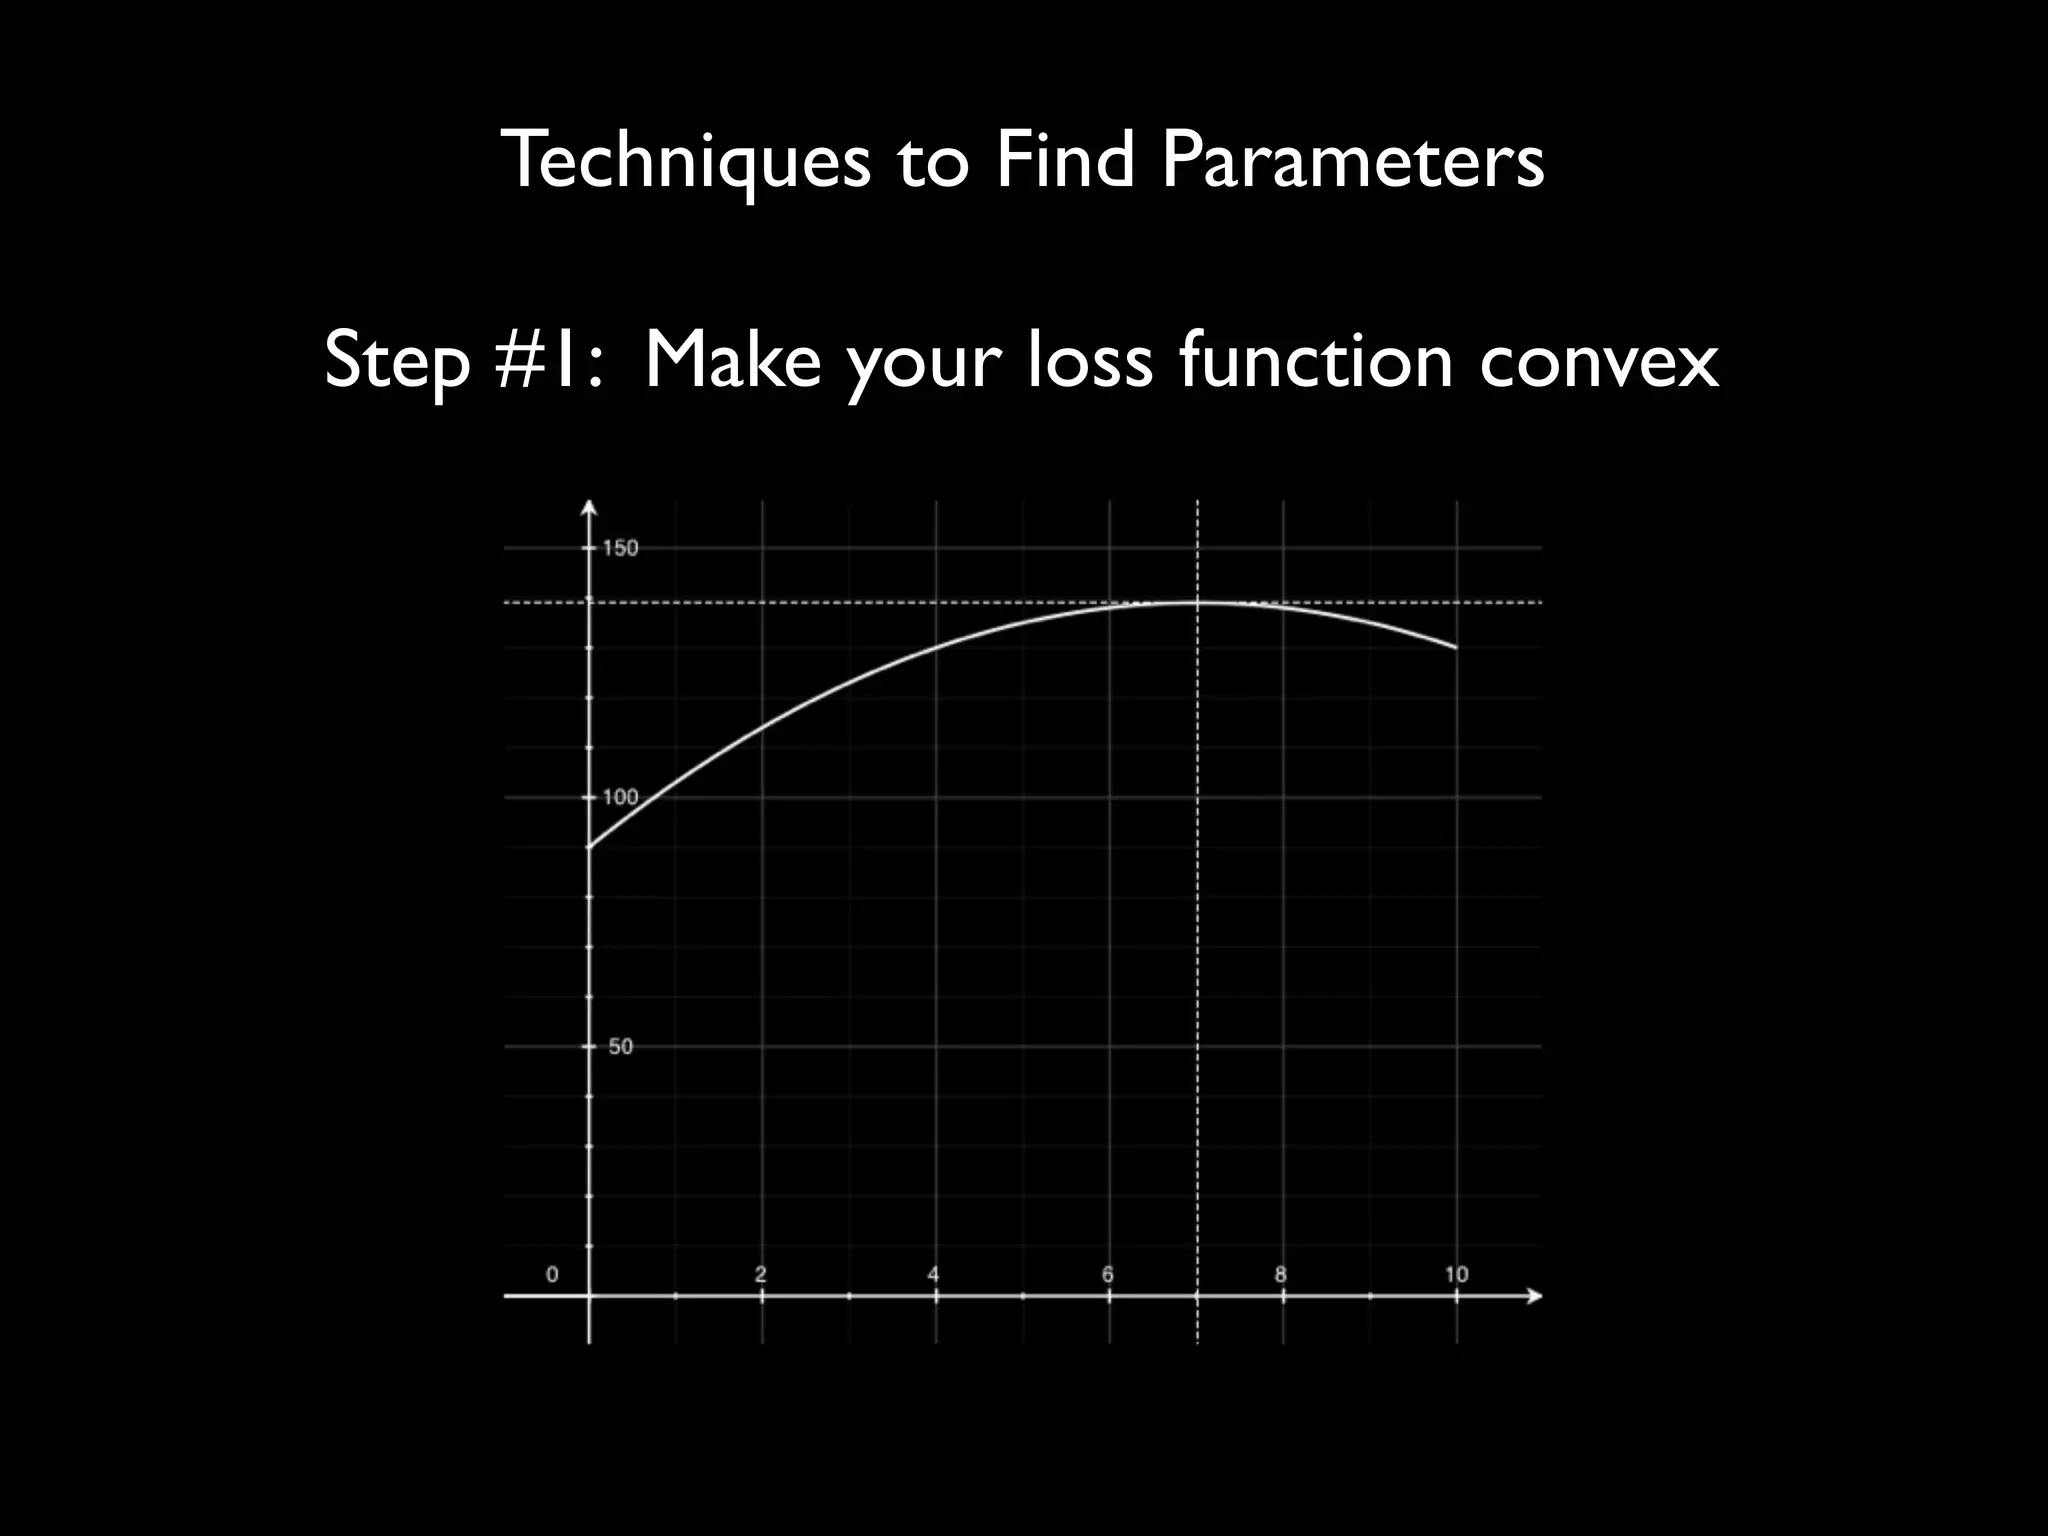
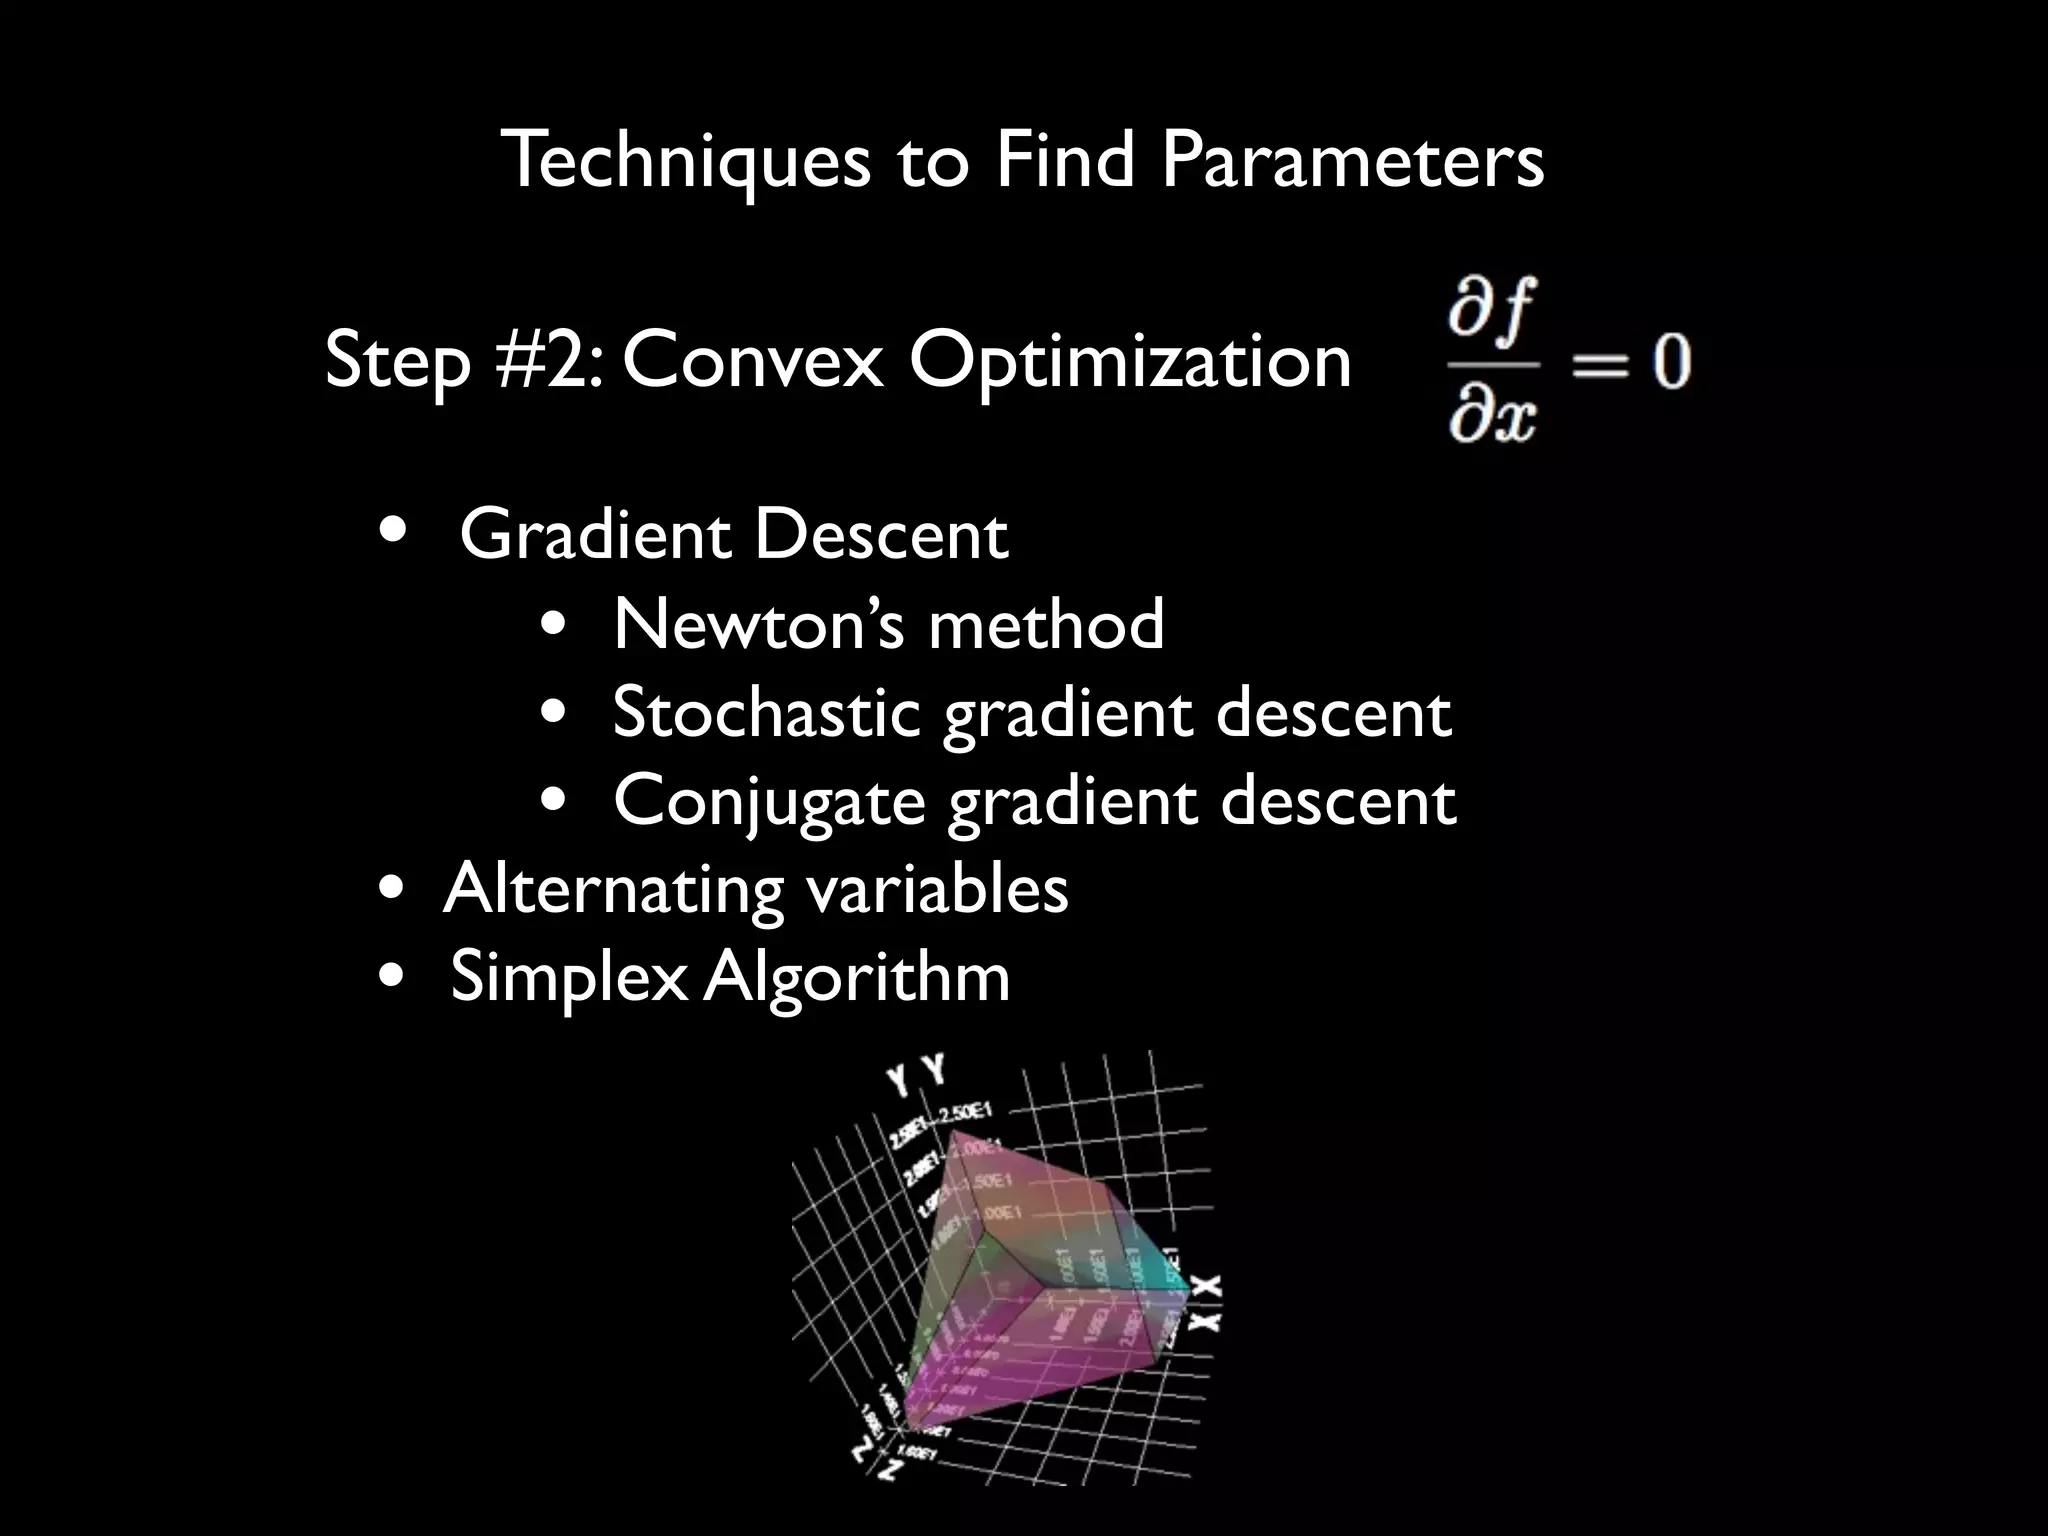
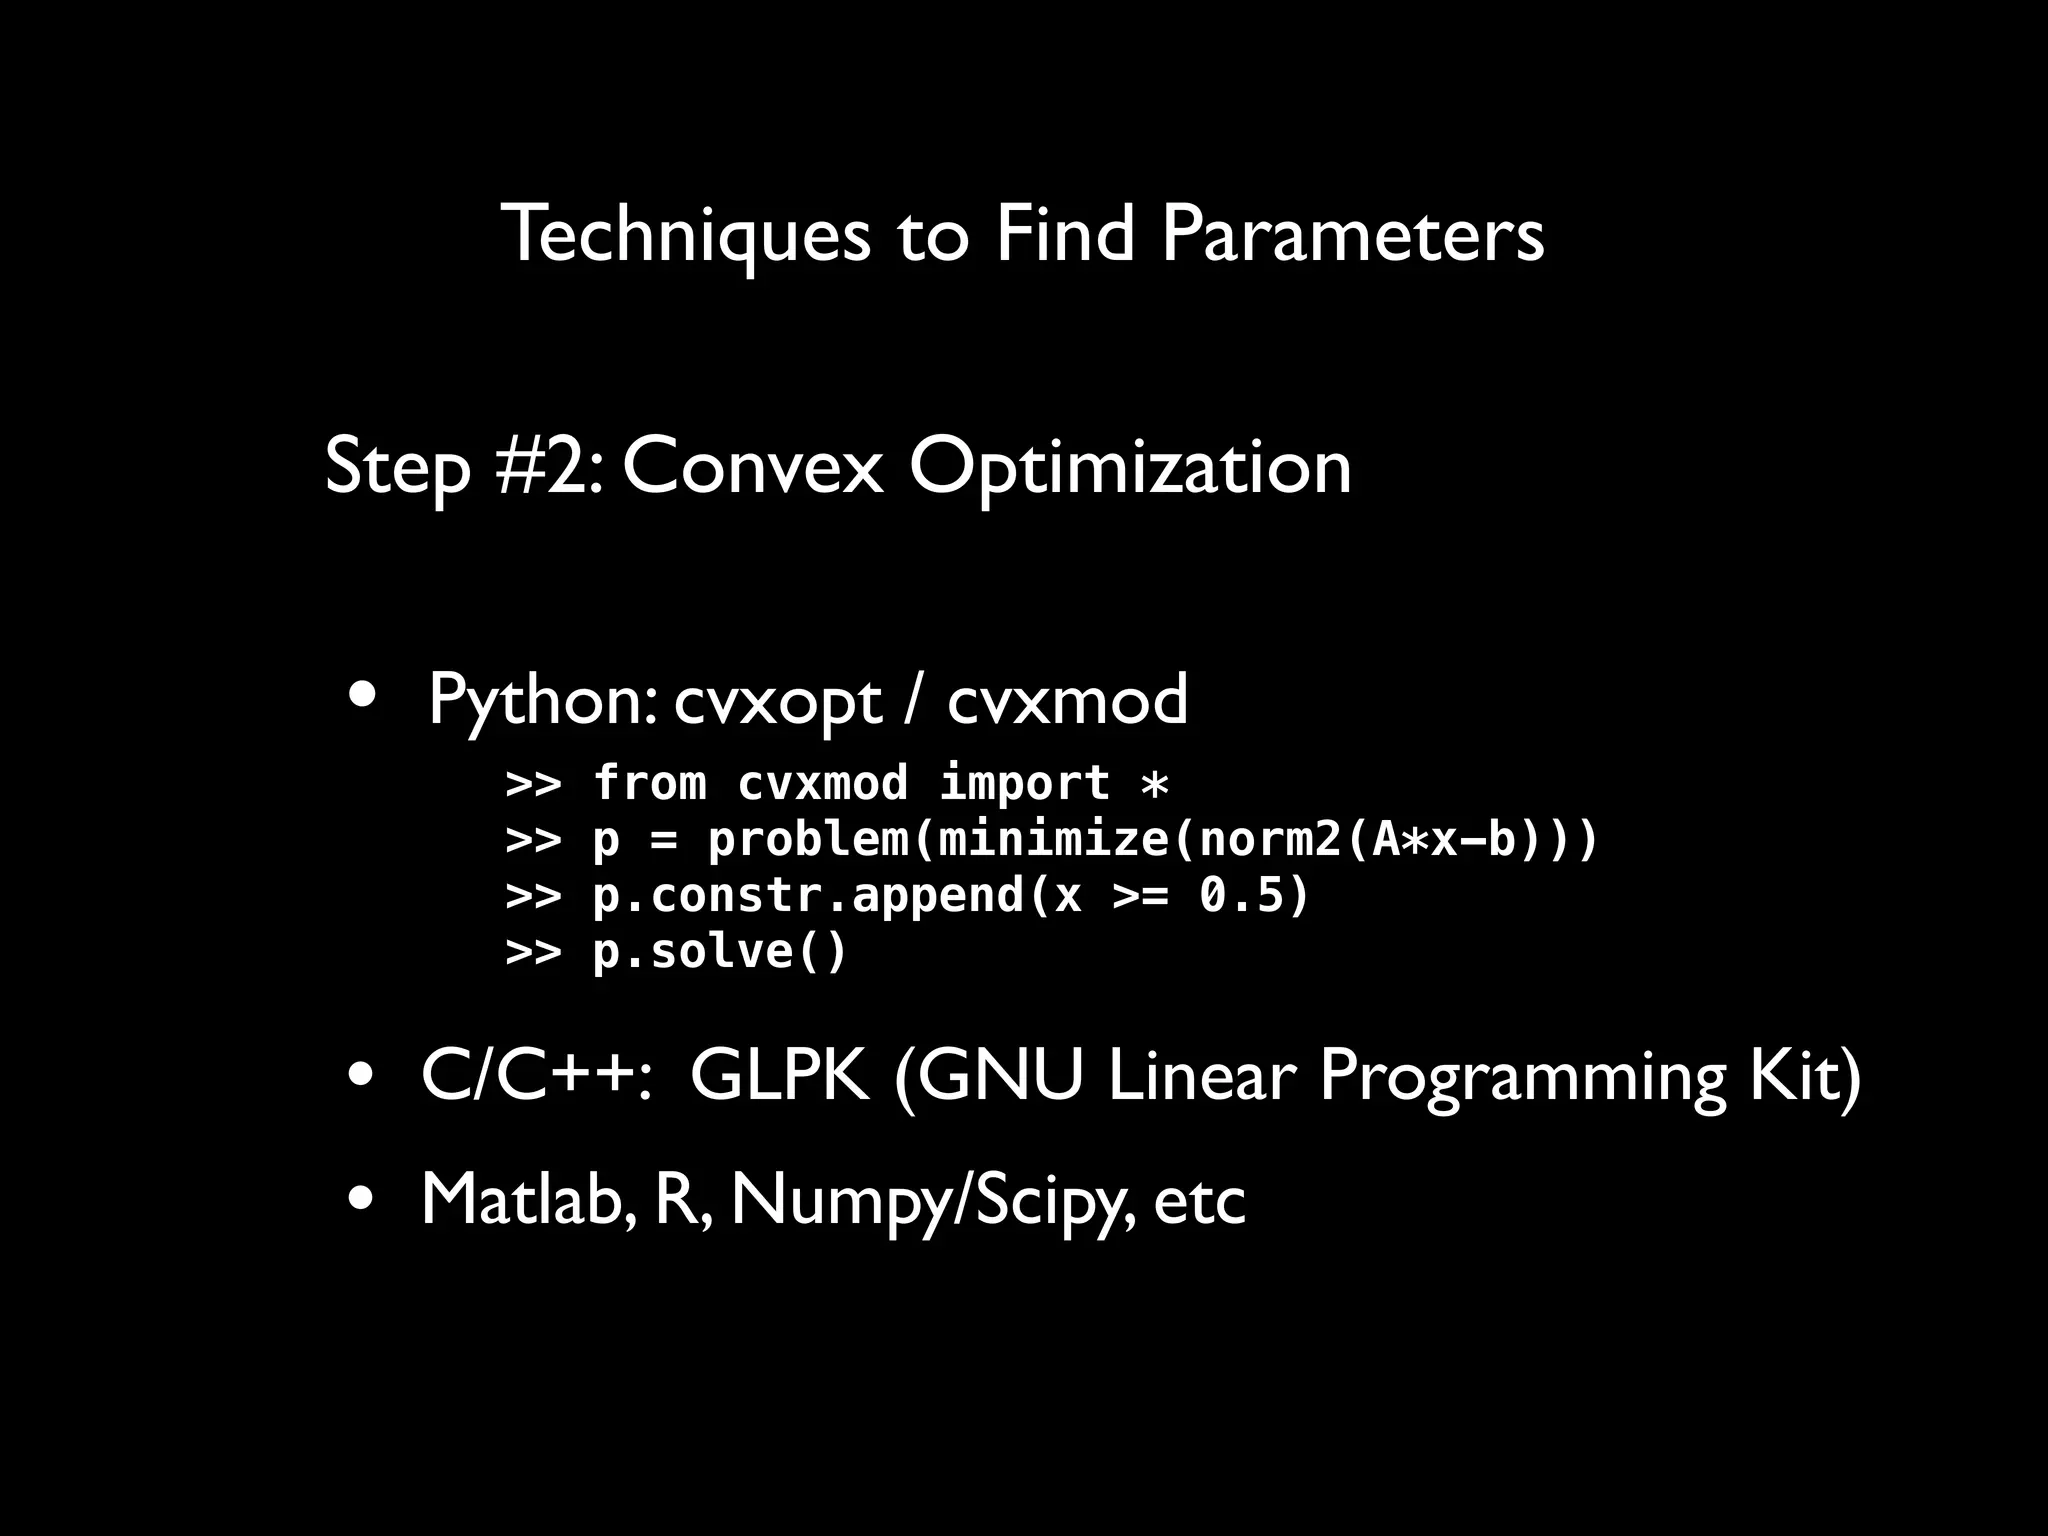
This document discusses optimization techniques for predictive analytics. It provides examples of loss functions for linear regression, clustering, and propagating labels across a social graph. It also discusses aligning loss functions with business goals, techniques for finding parameters like gradient descent and convex optimization, and tradeoffs between precision and recall to avoid overfitting.