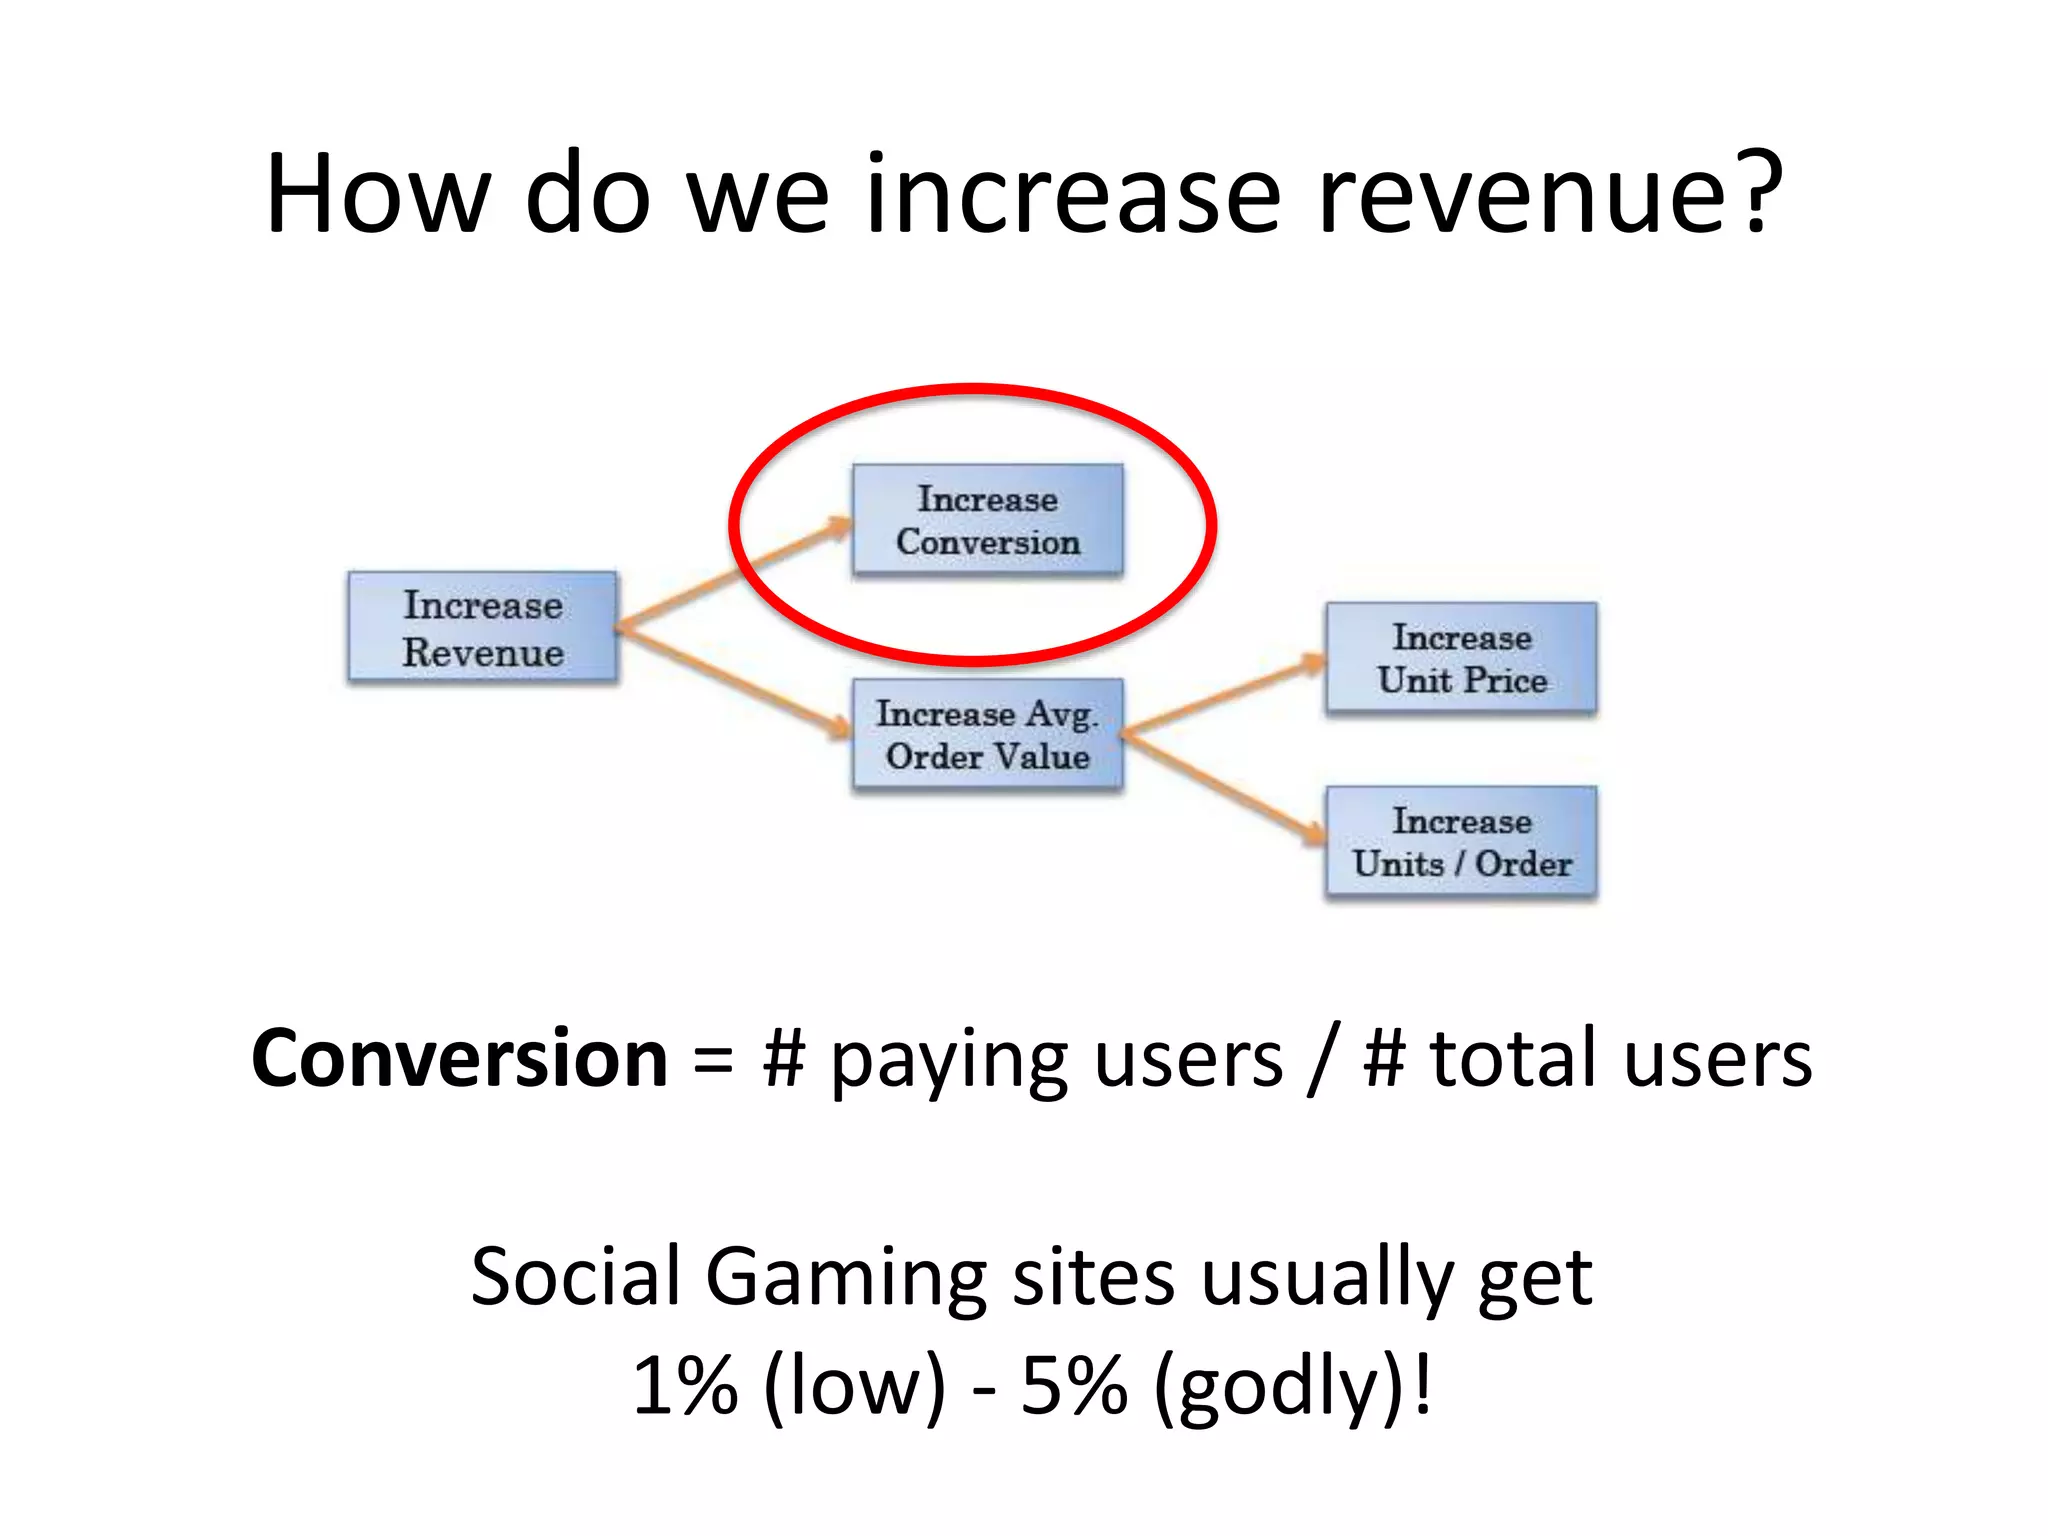
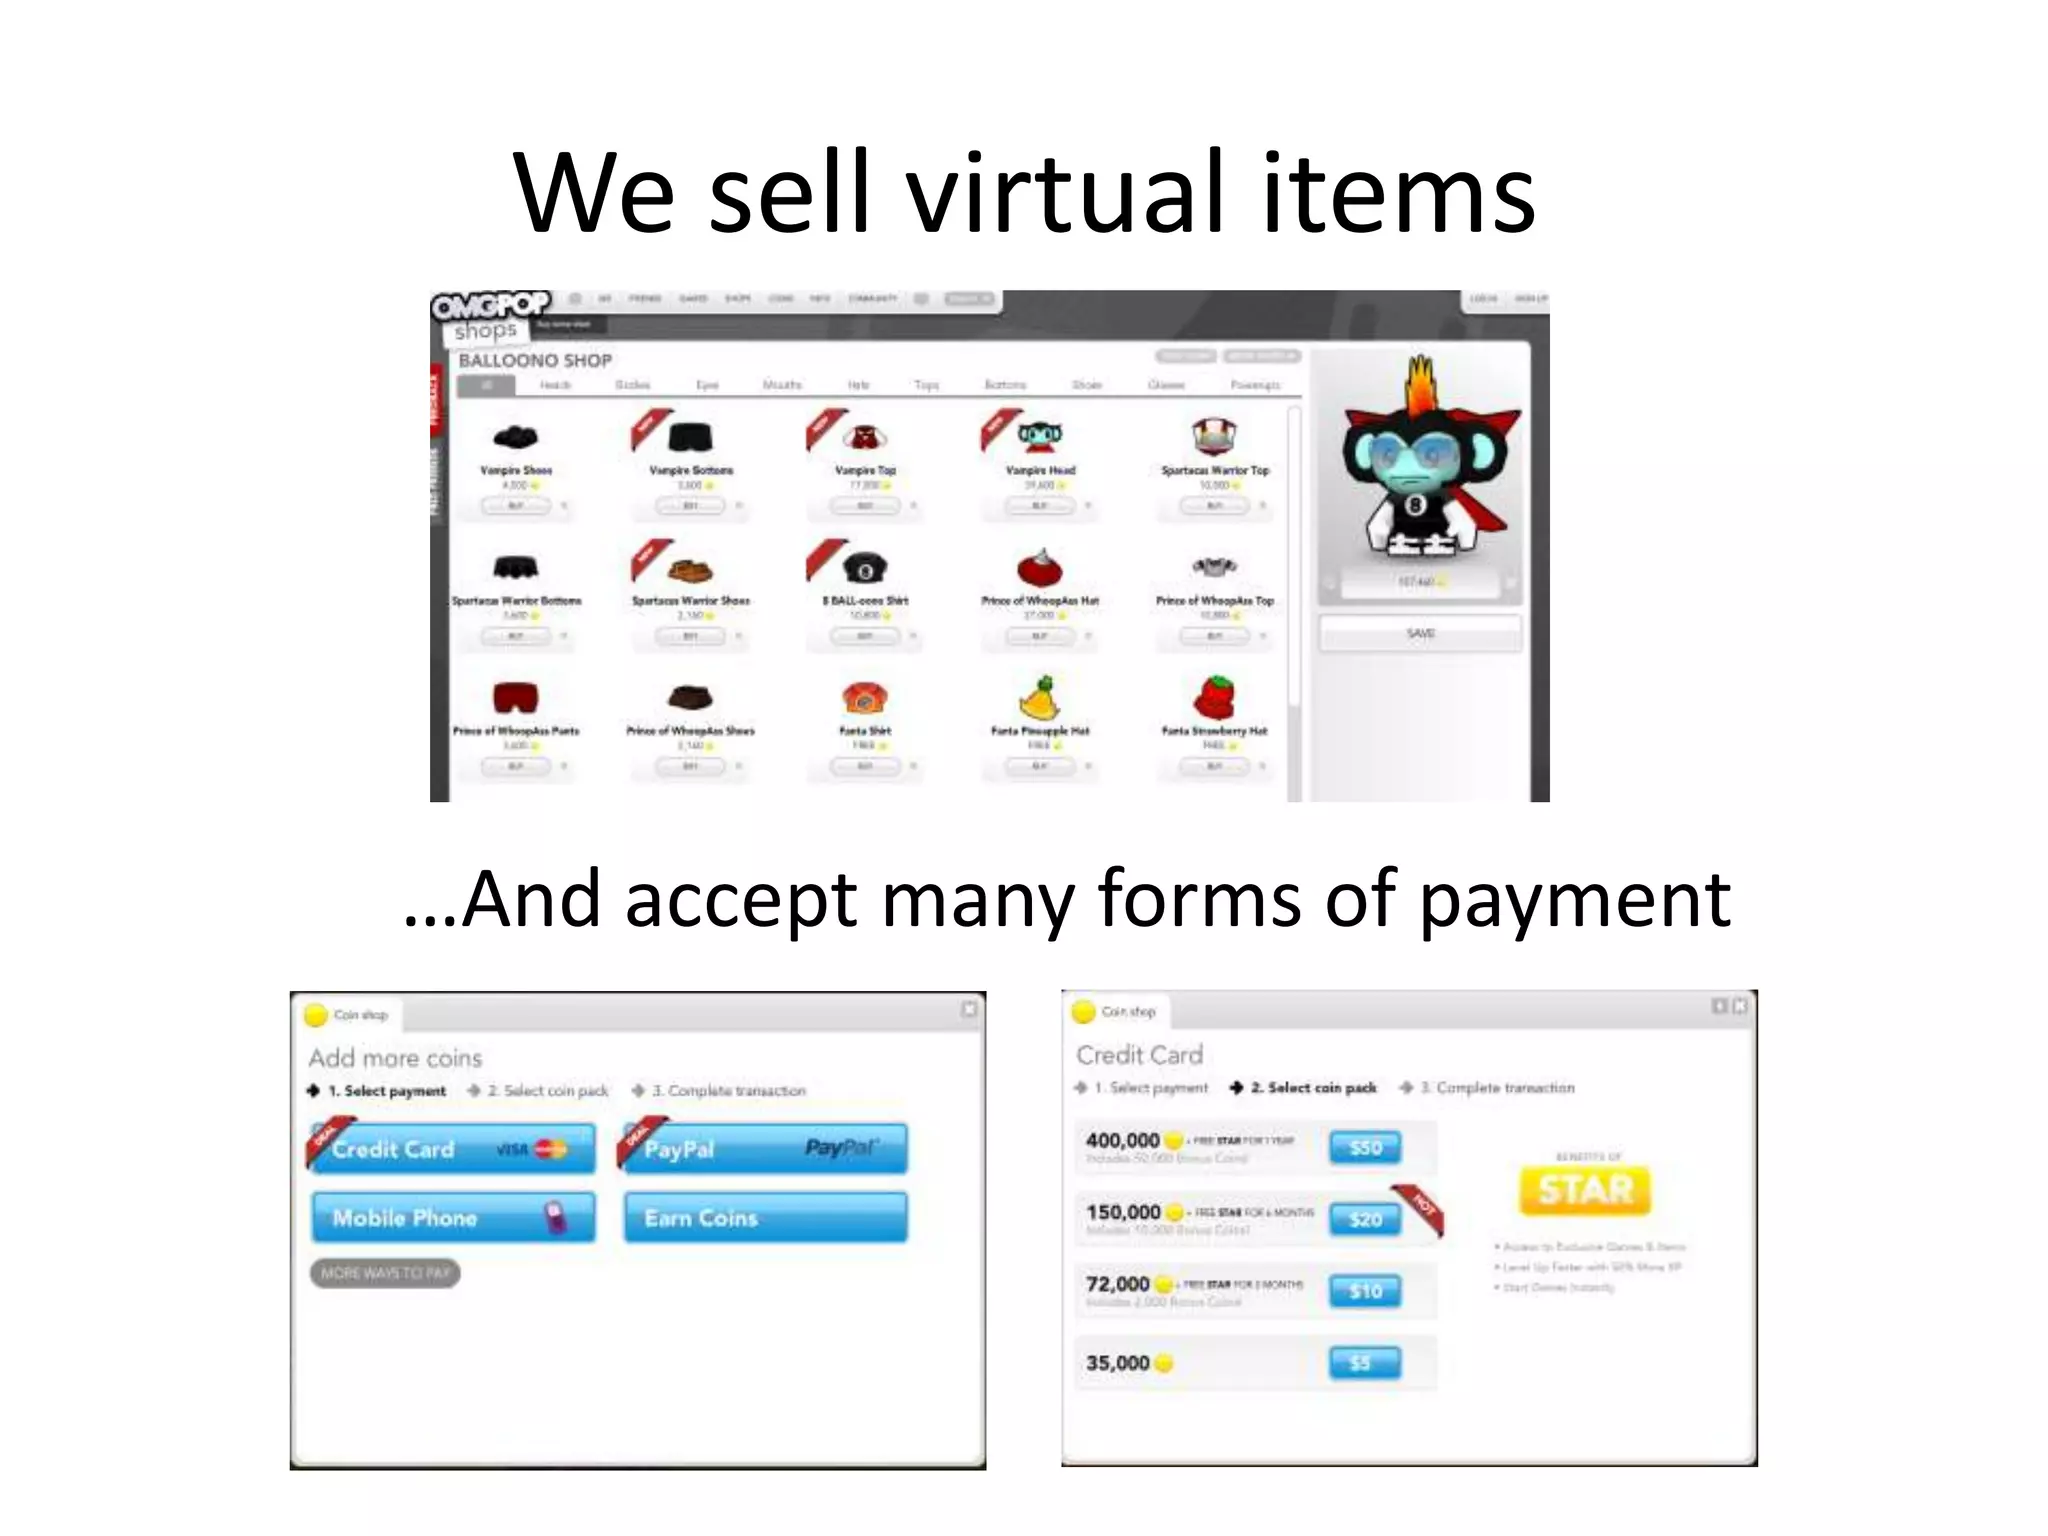
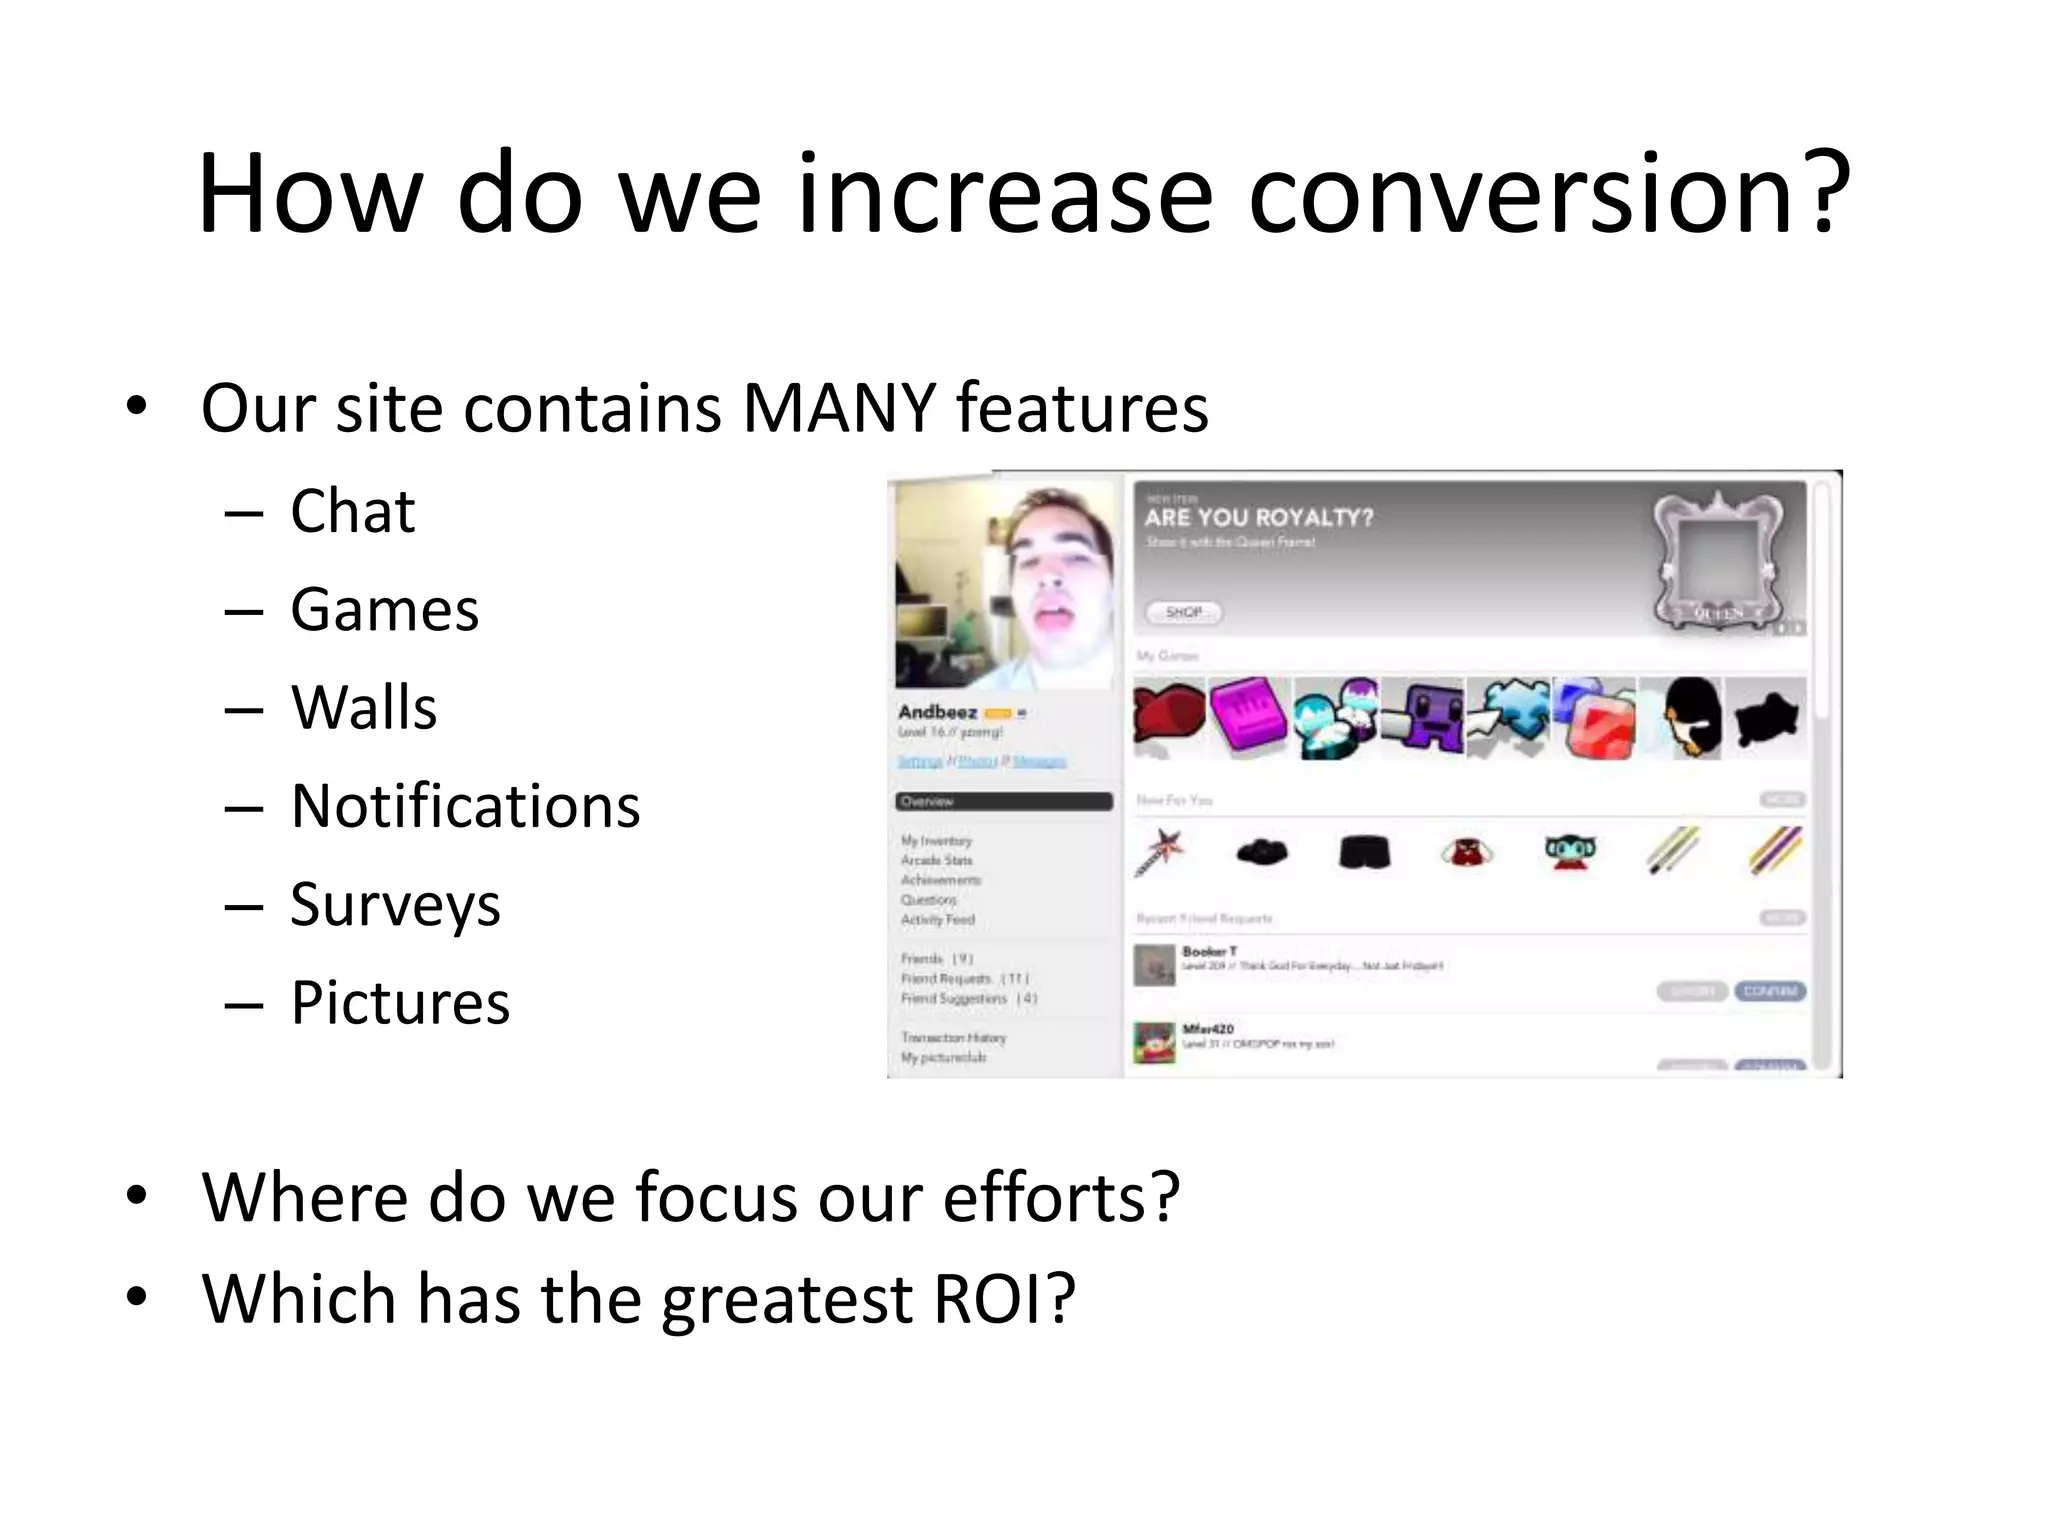
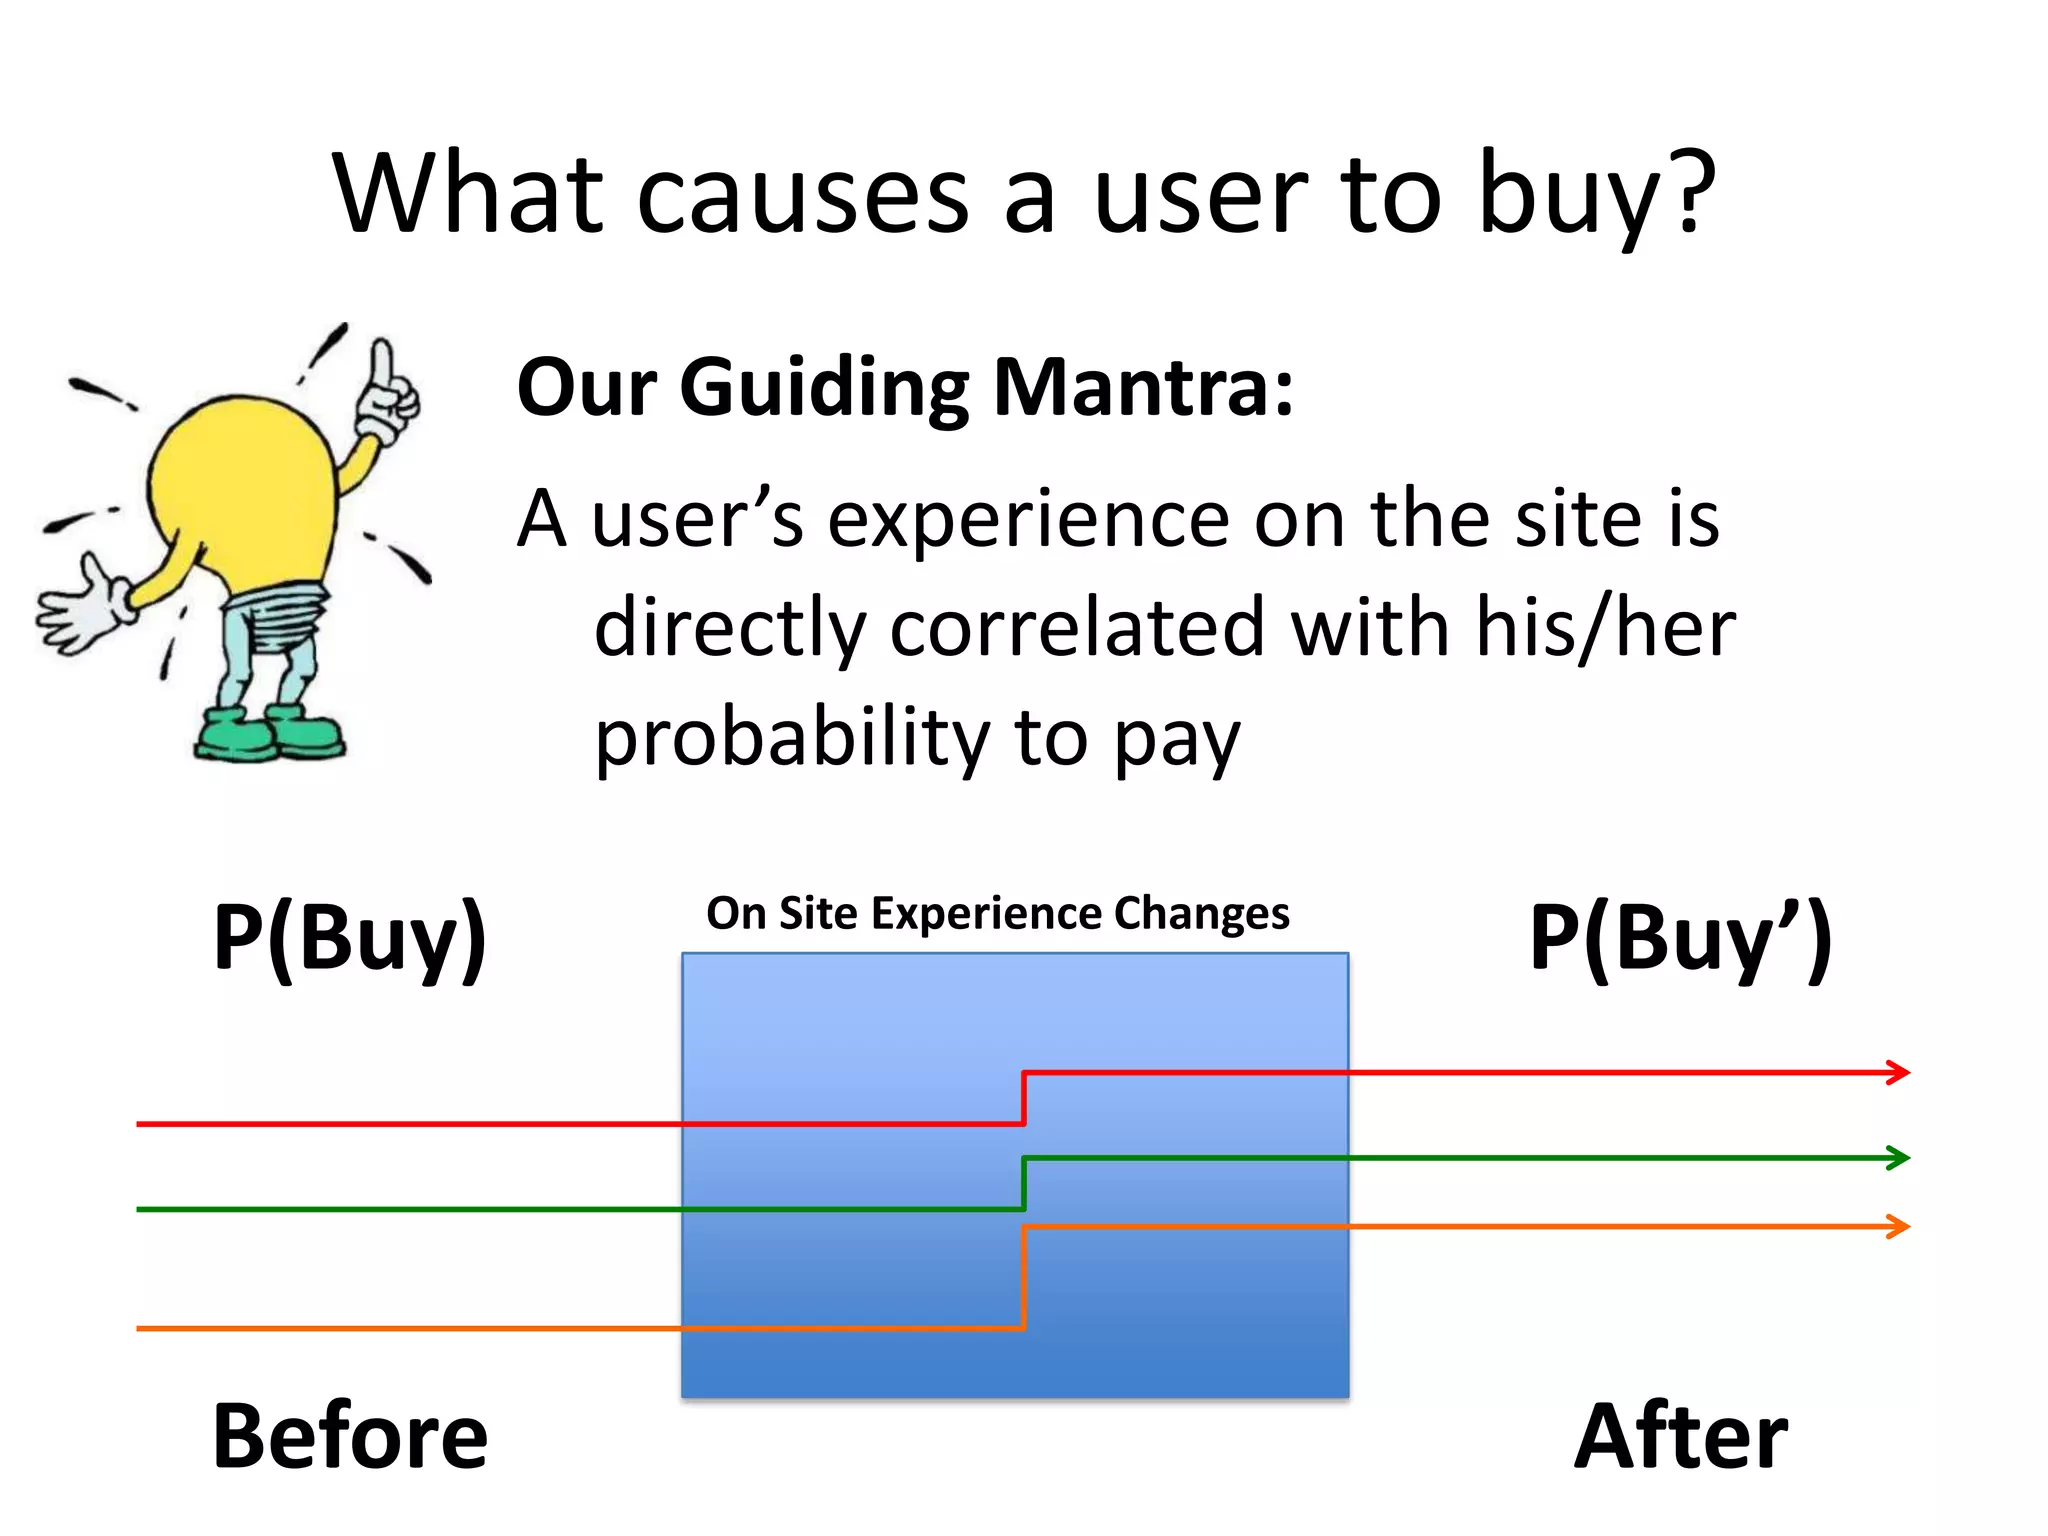
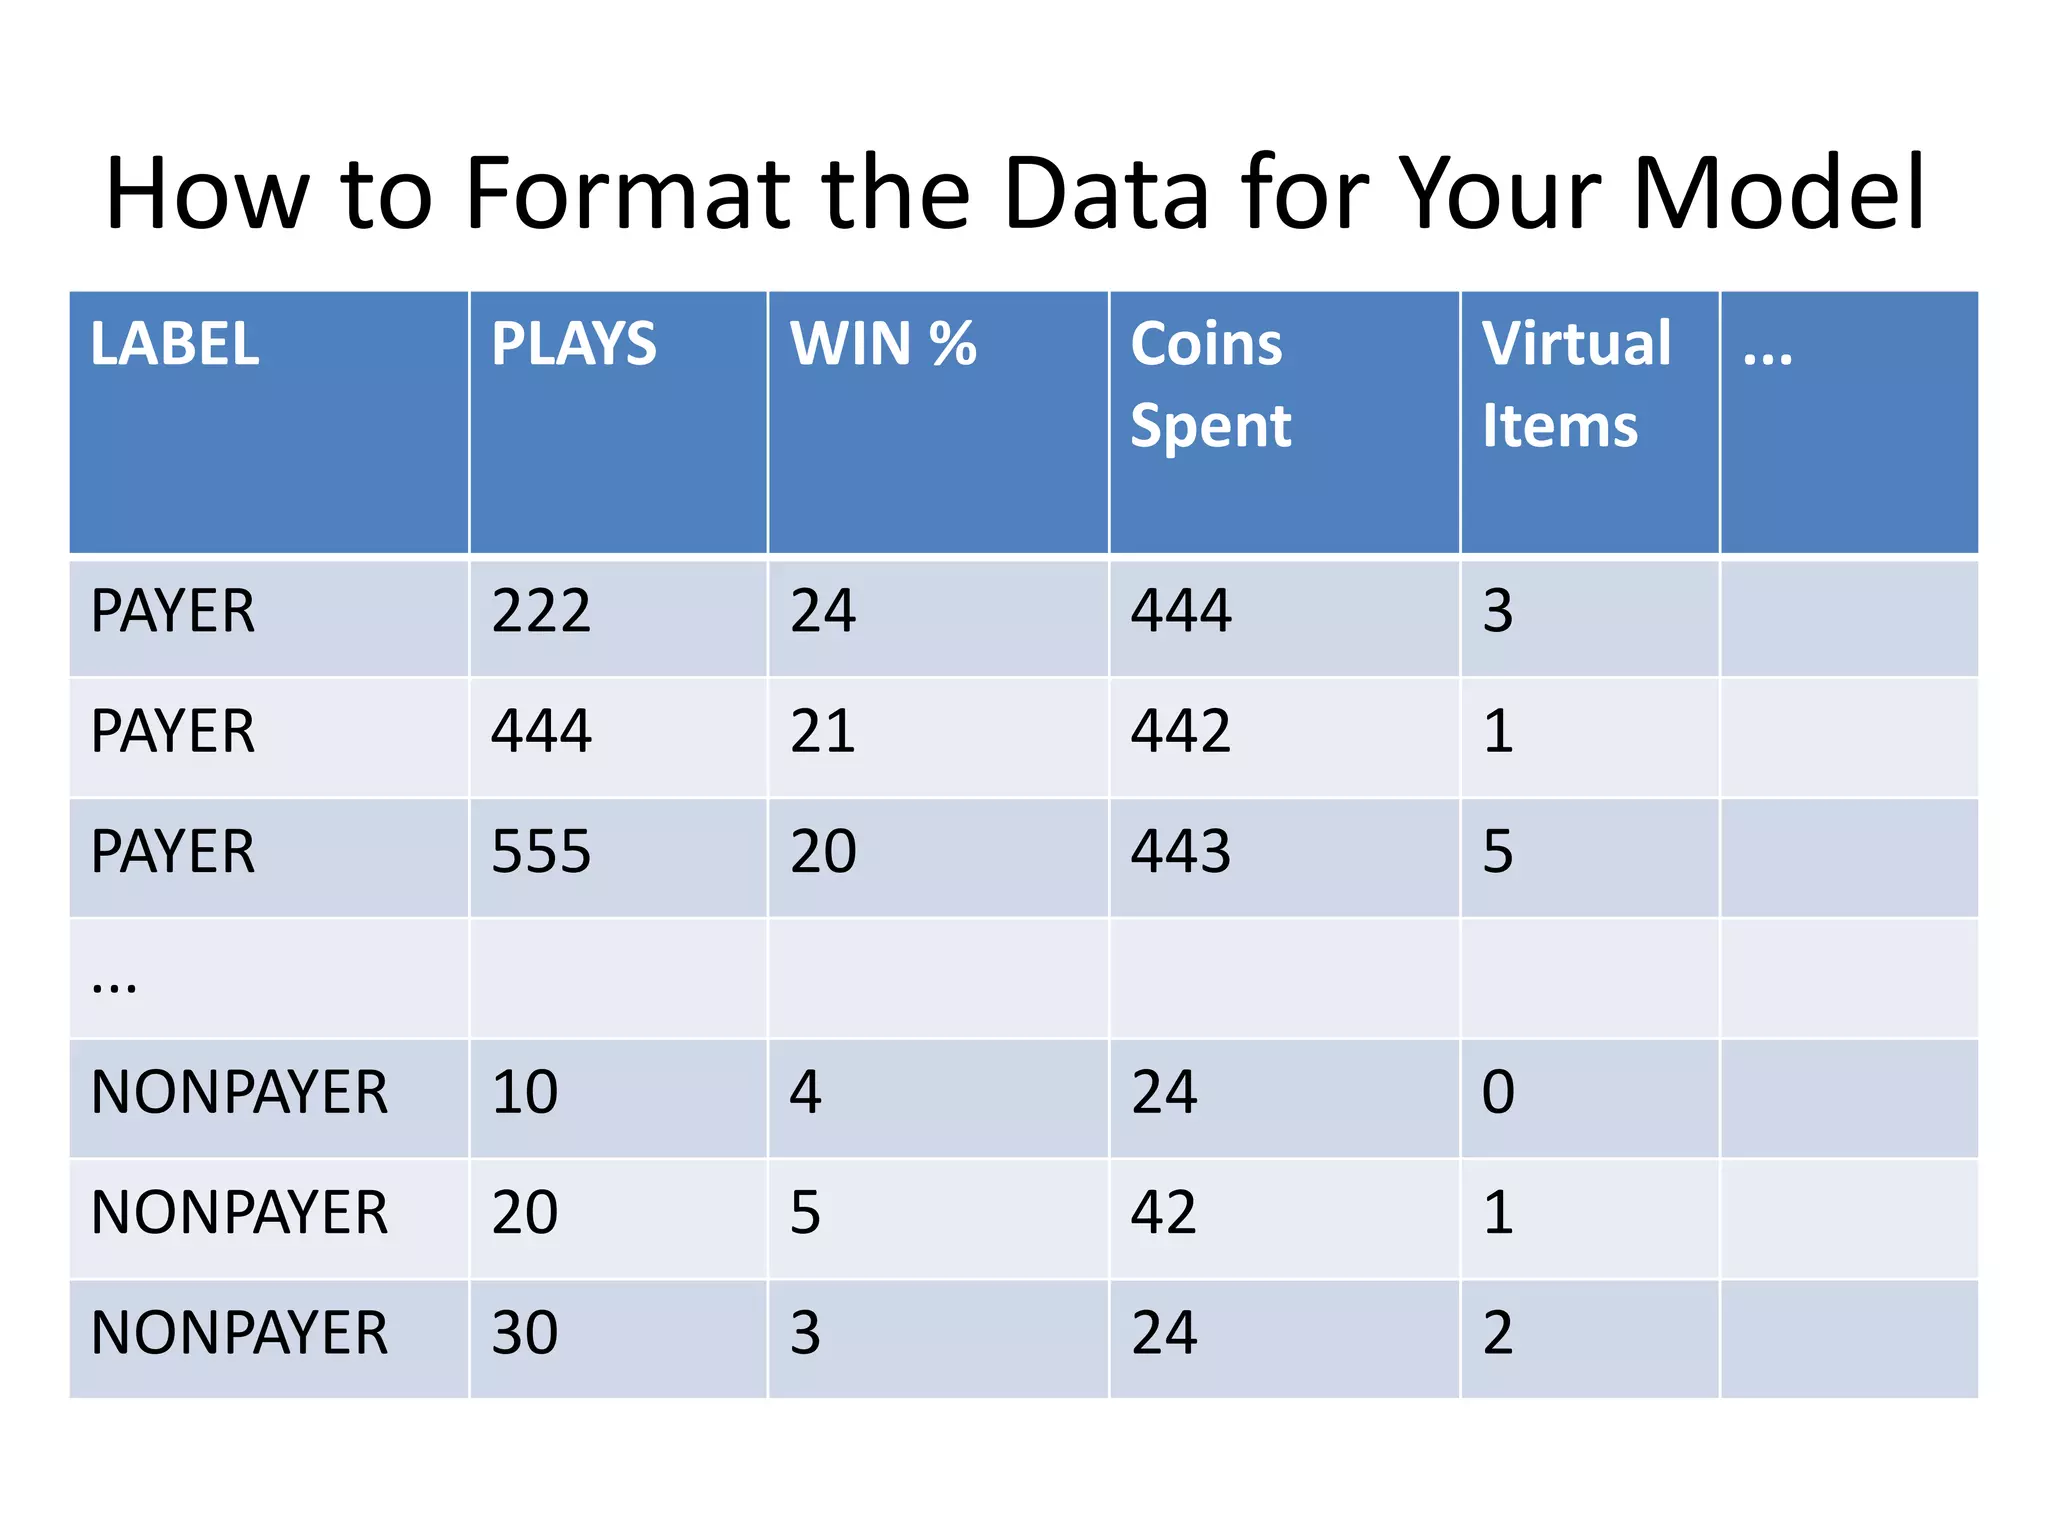
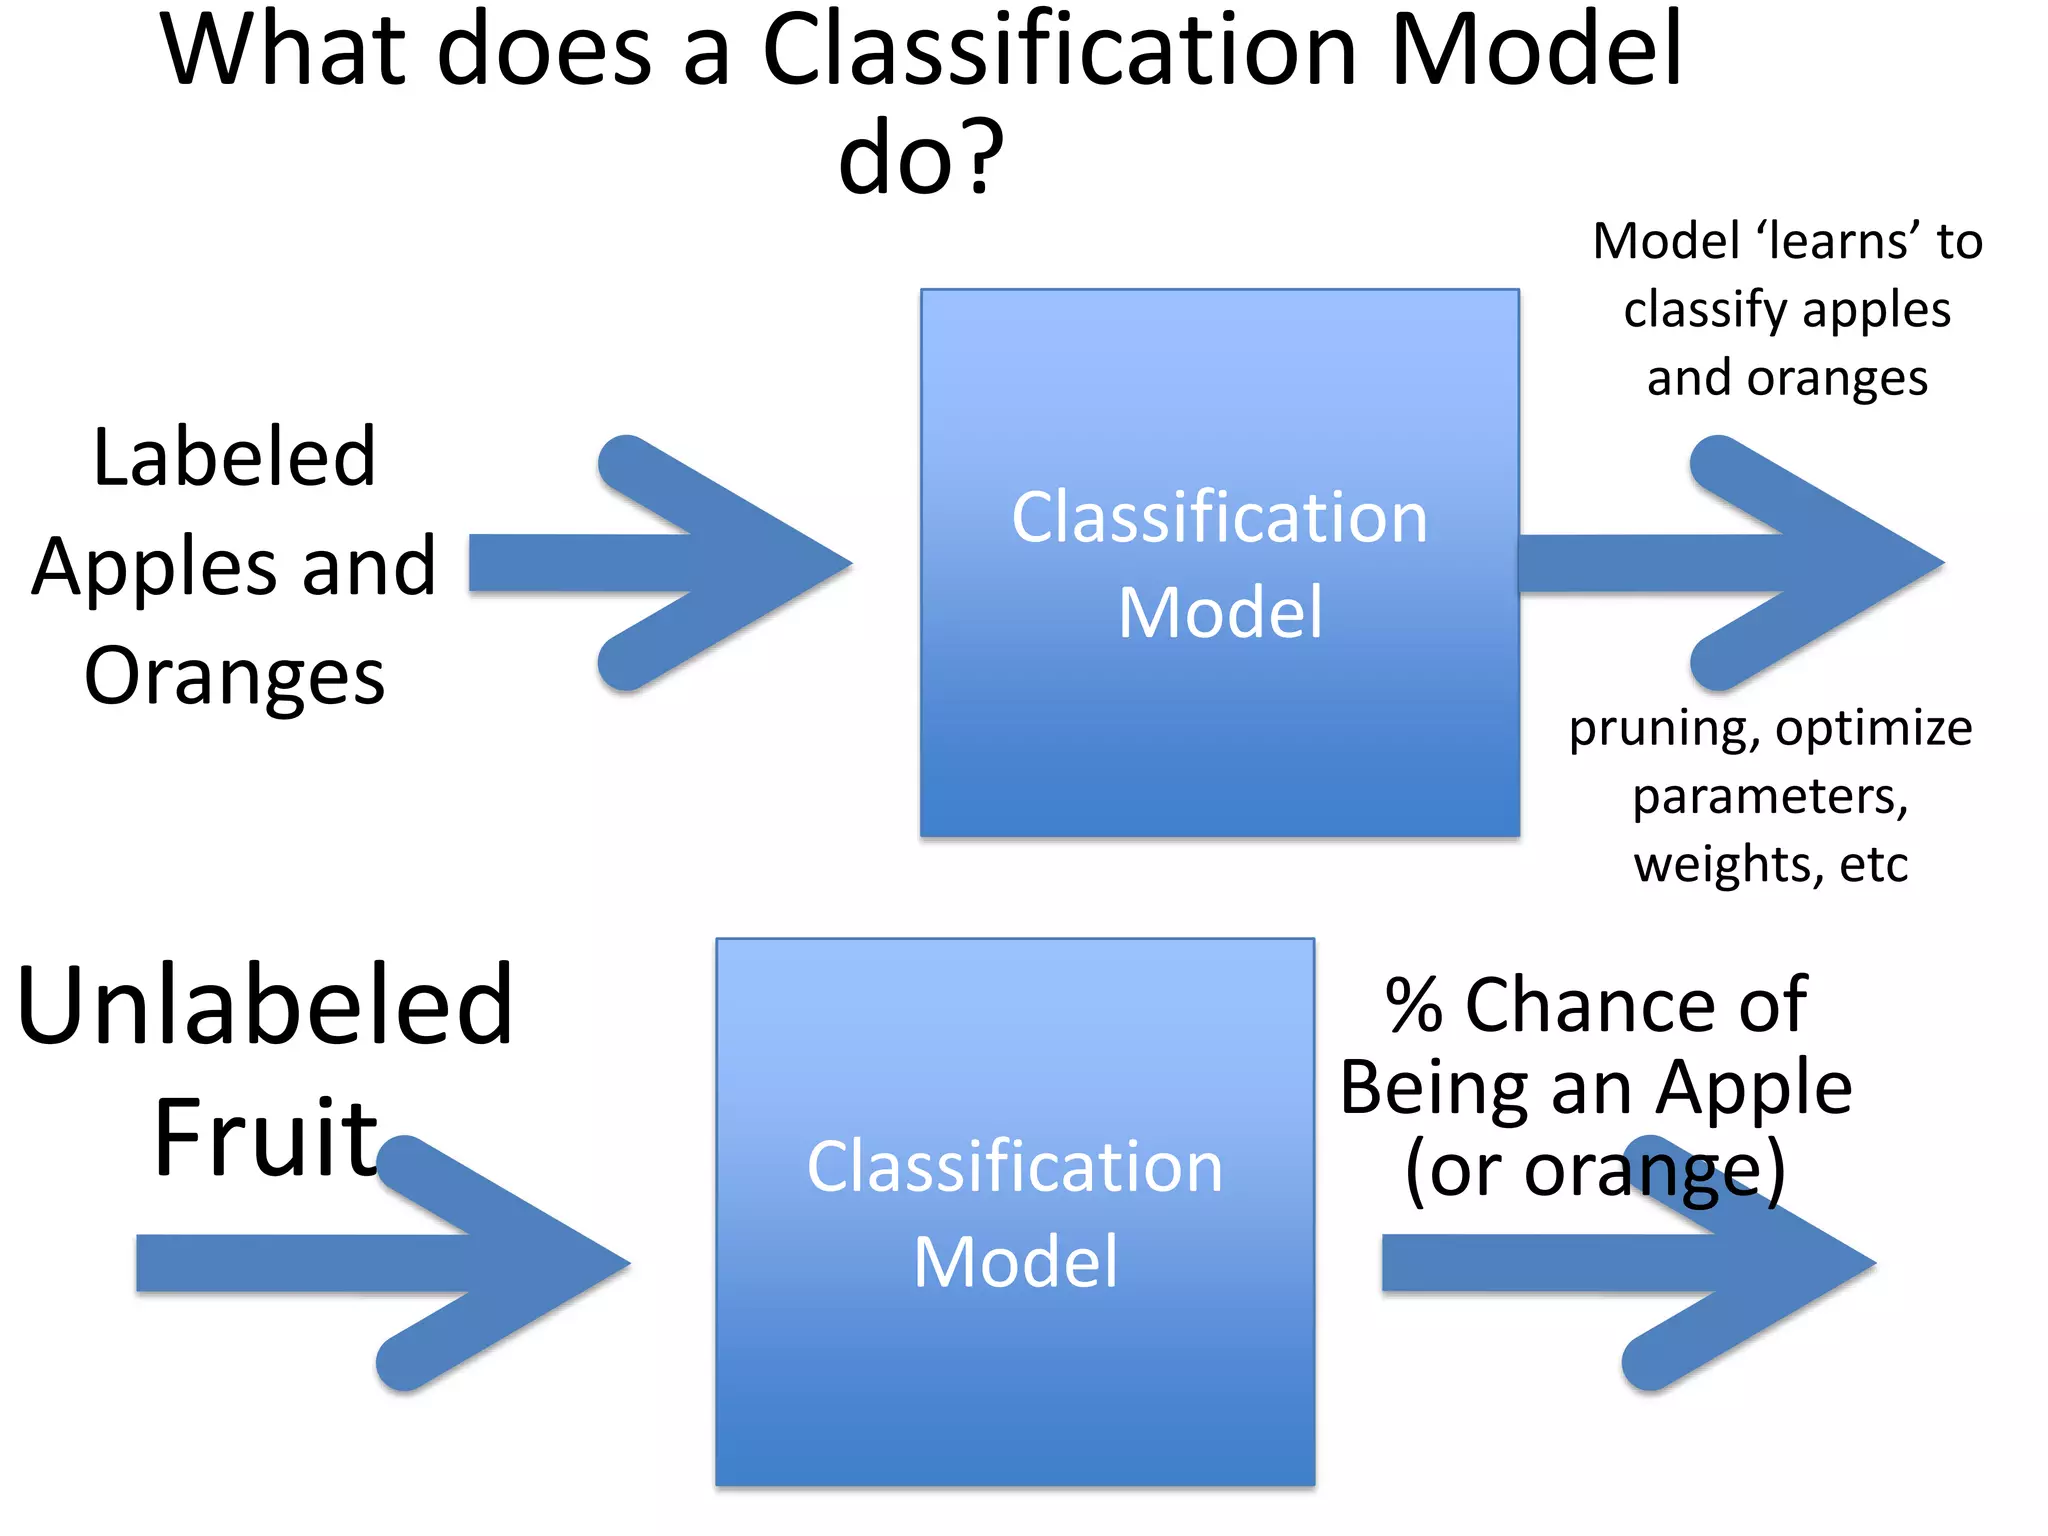
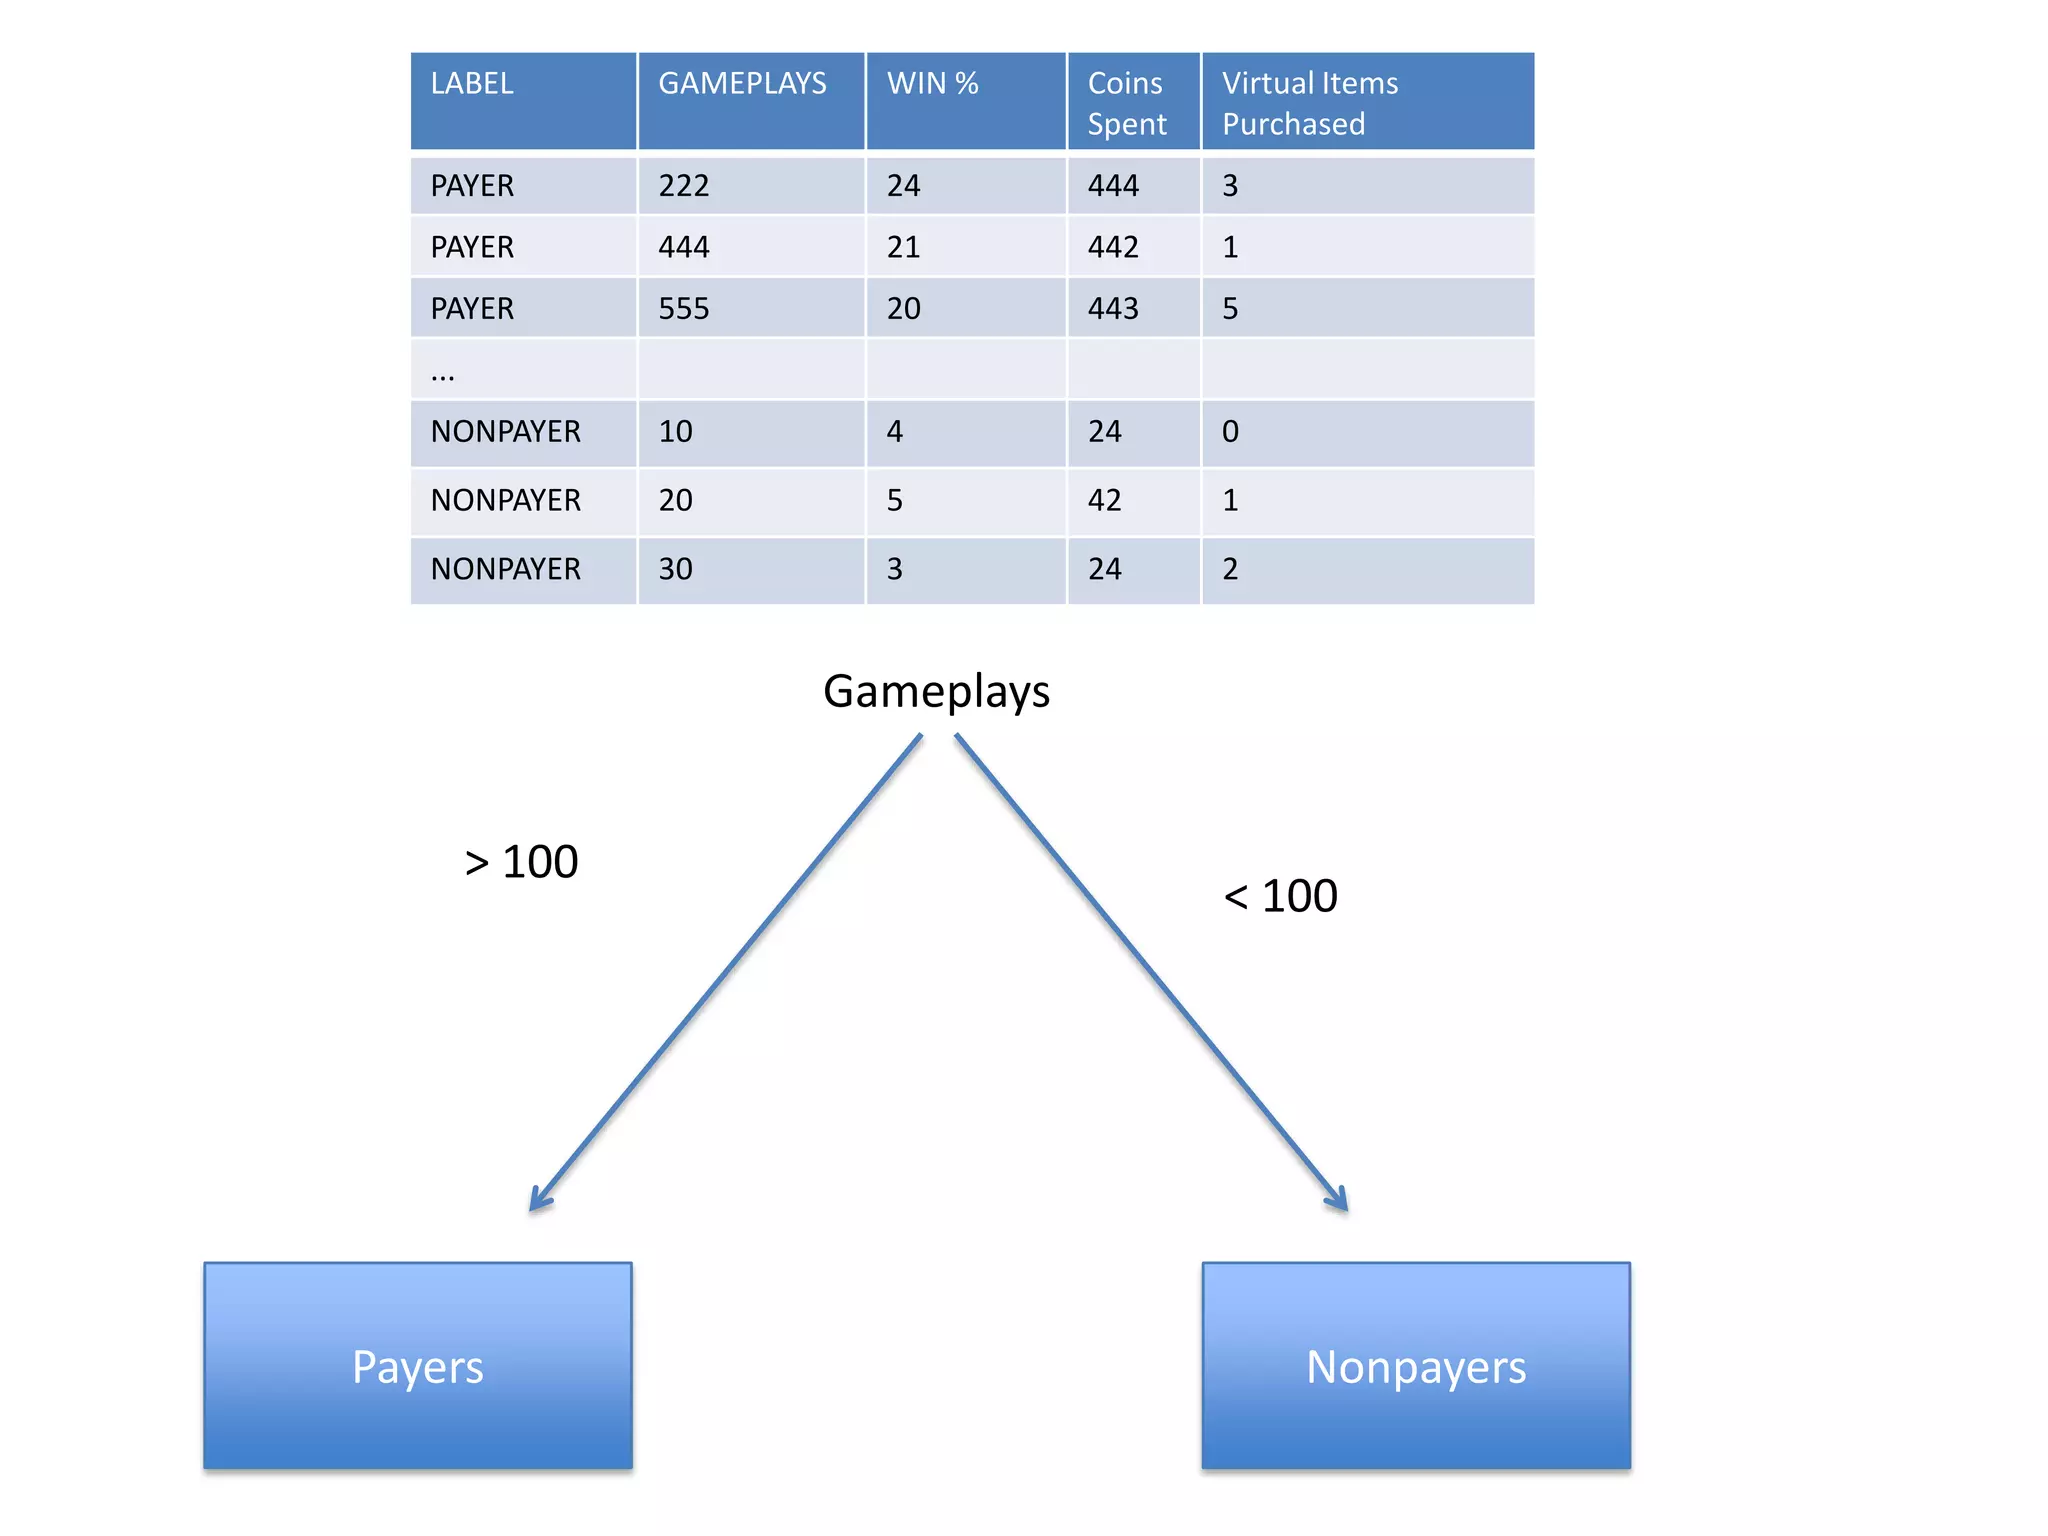
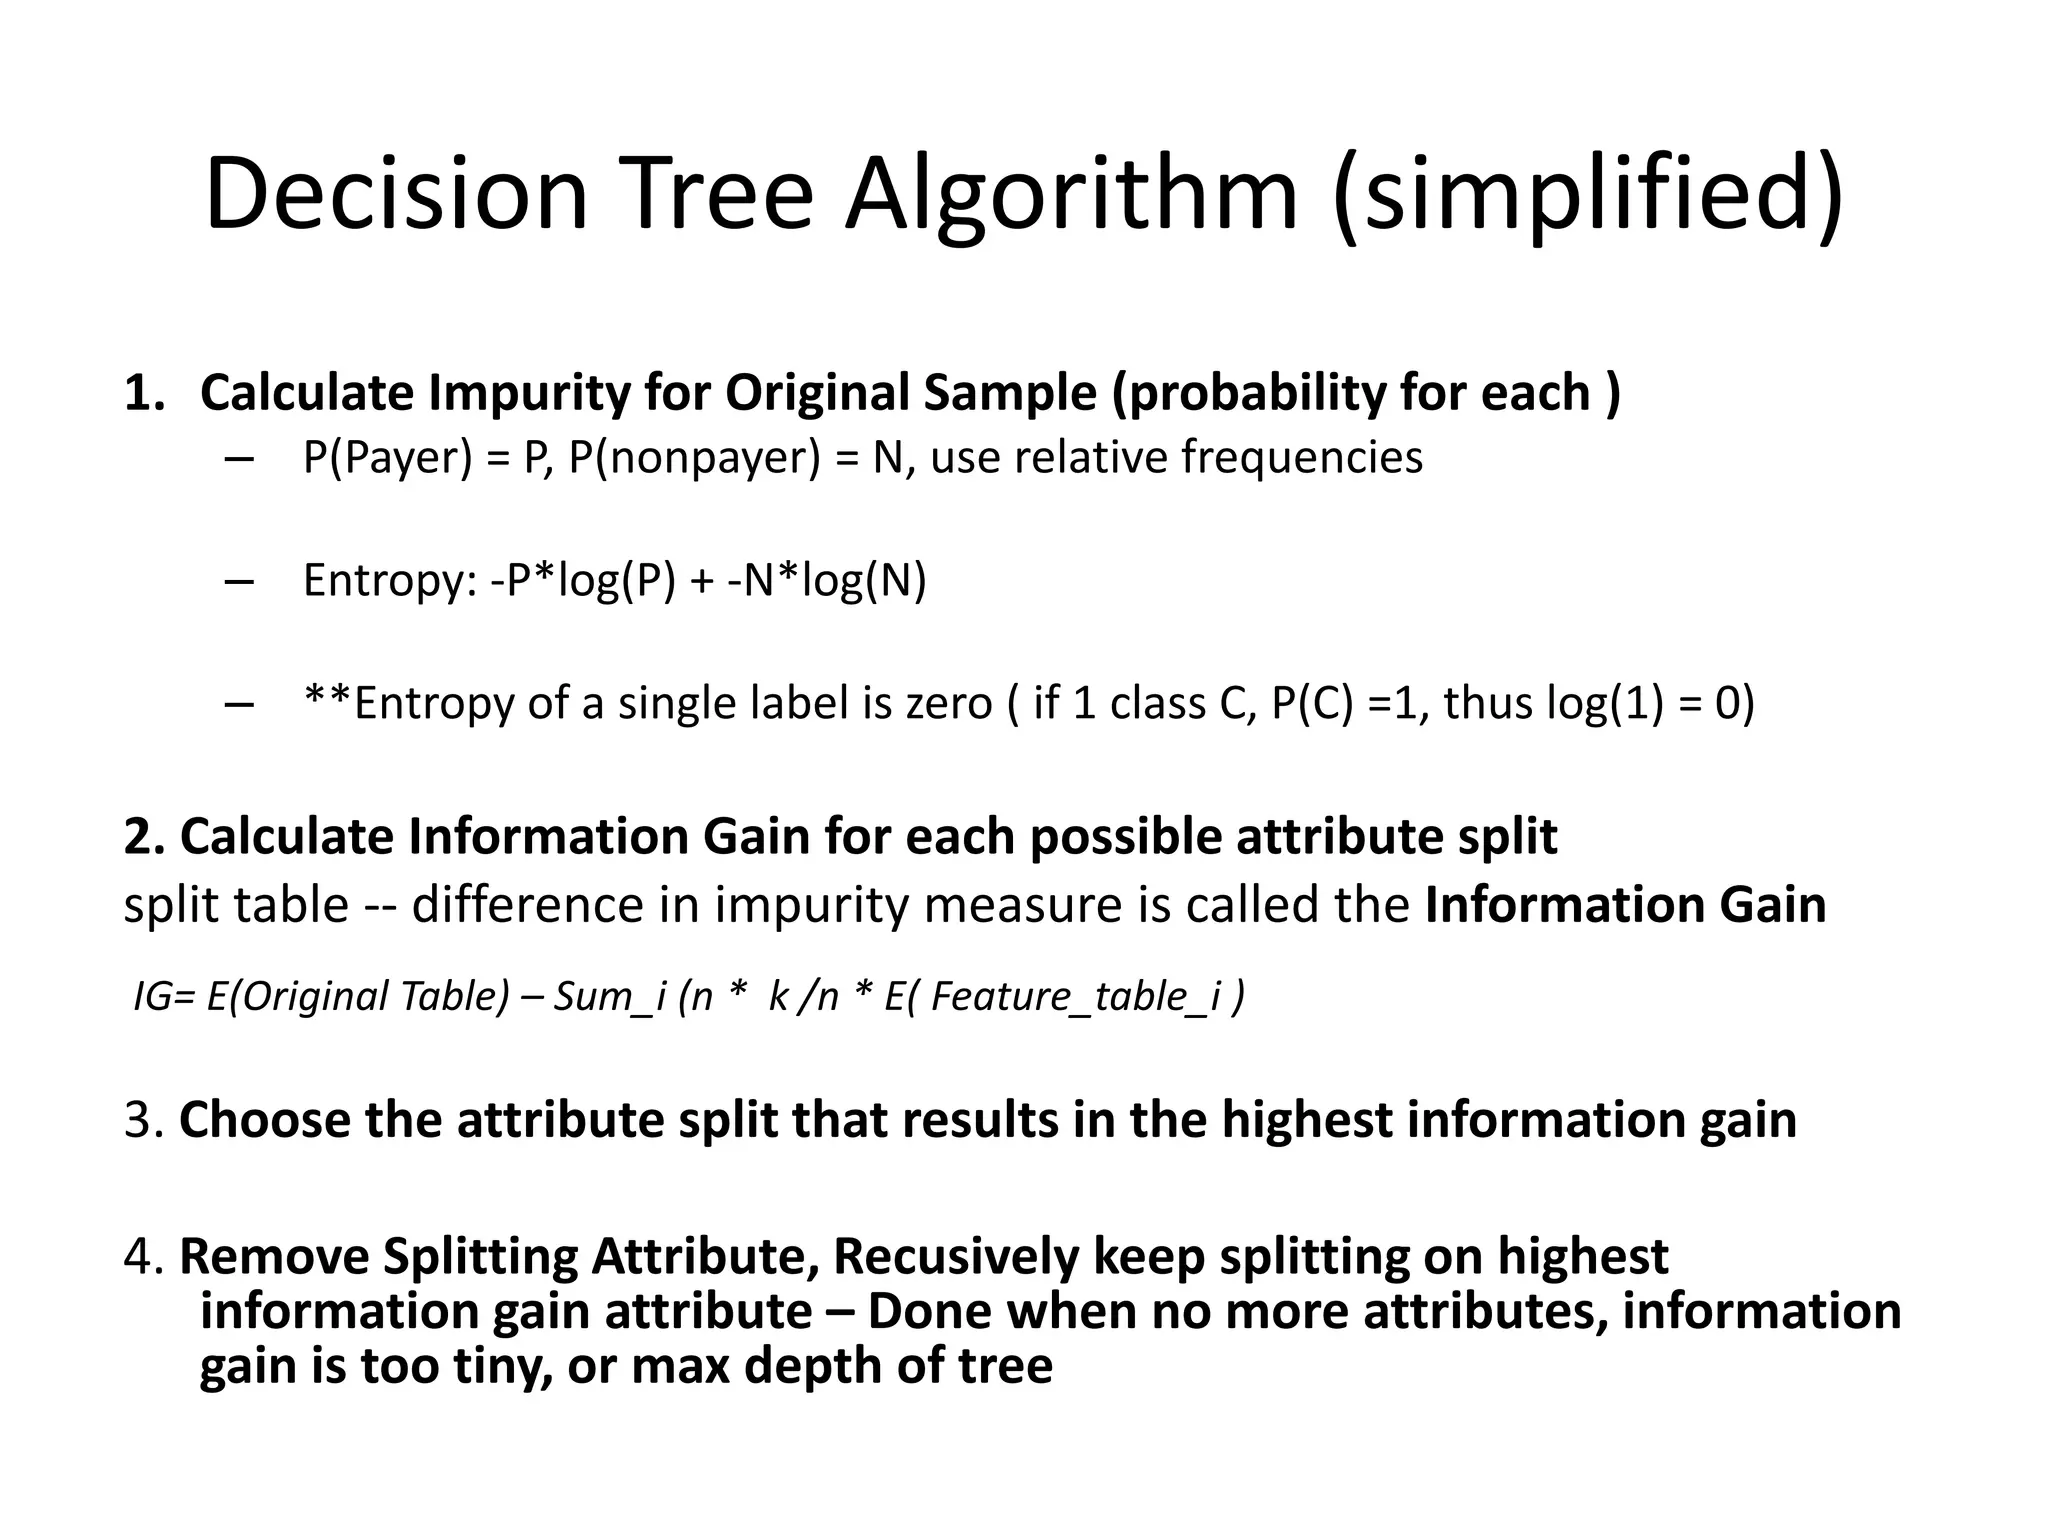
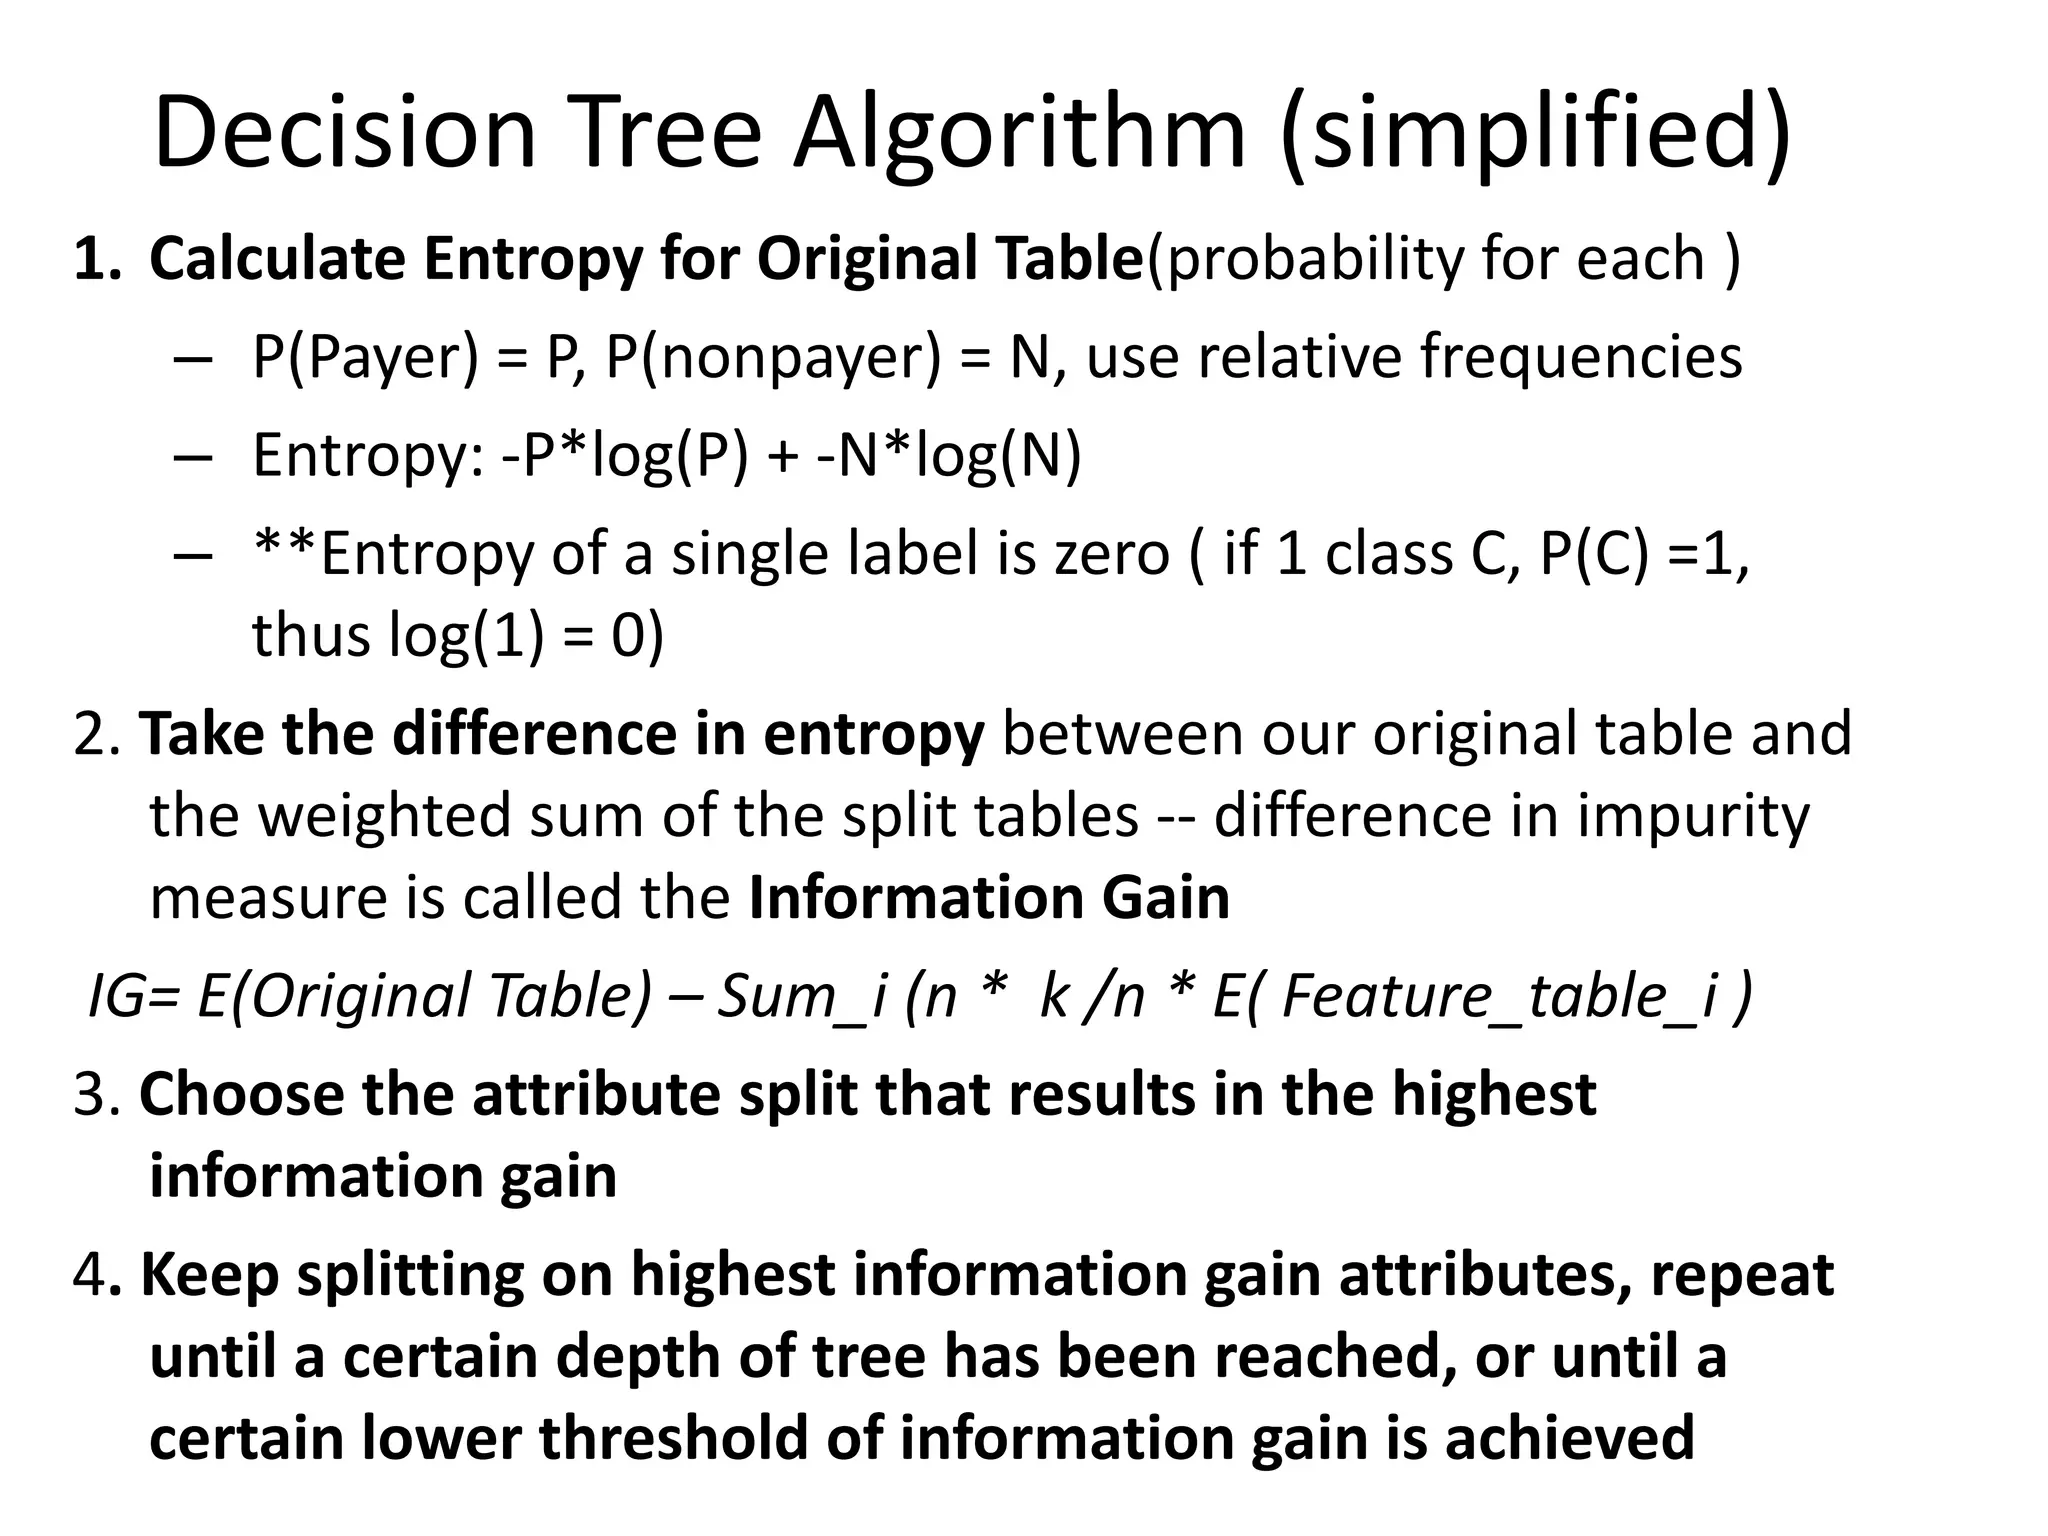
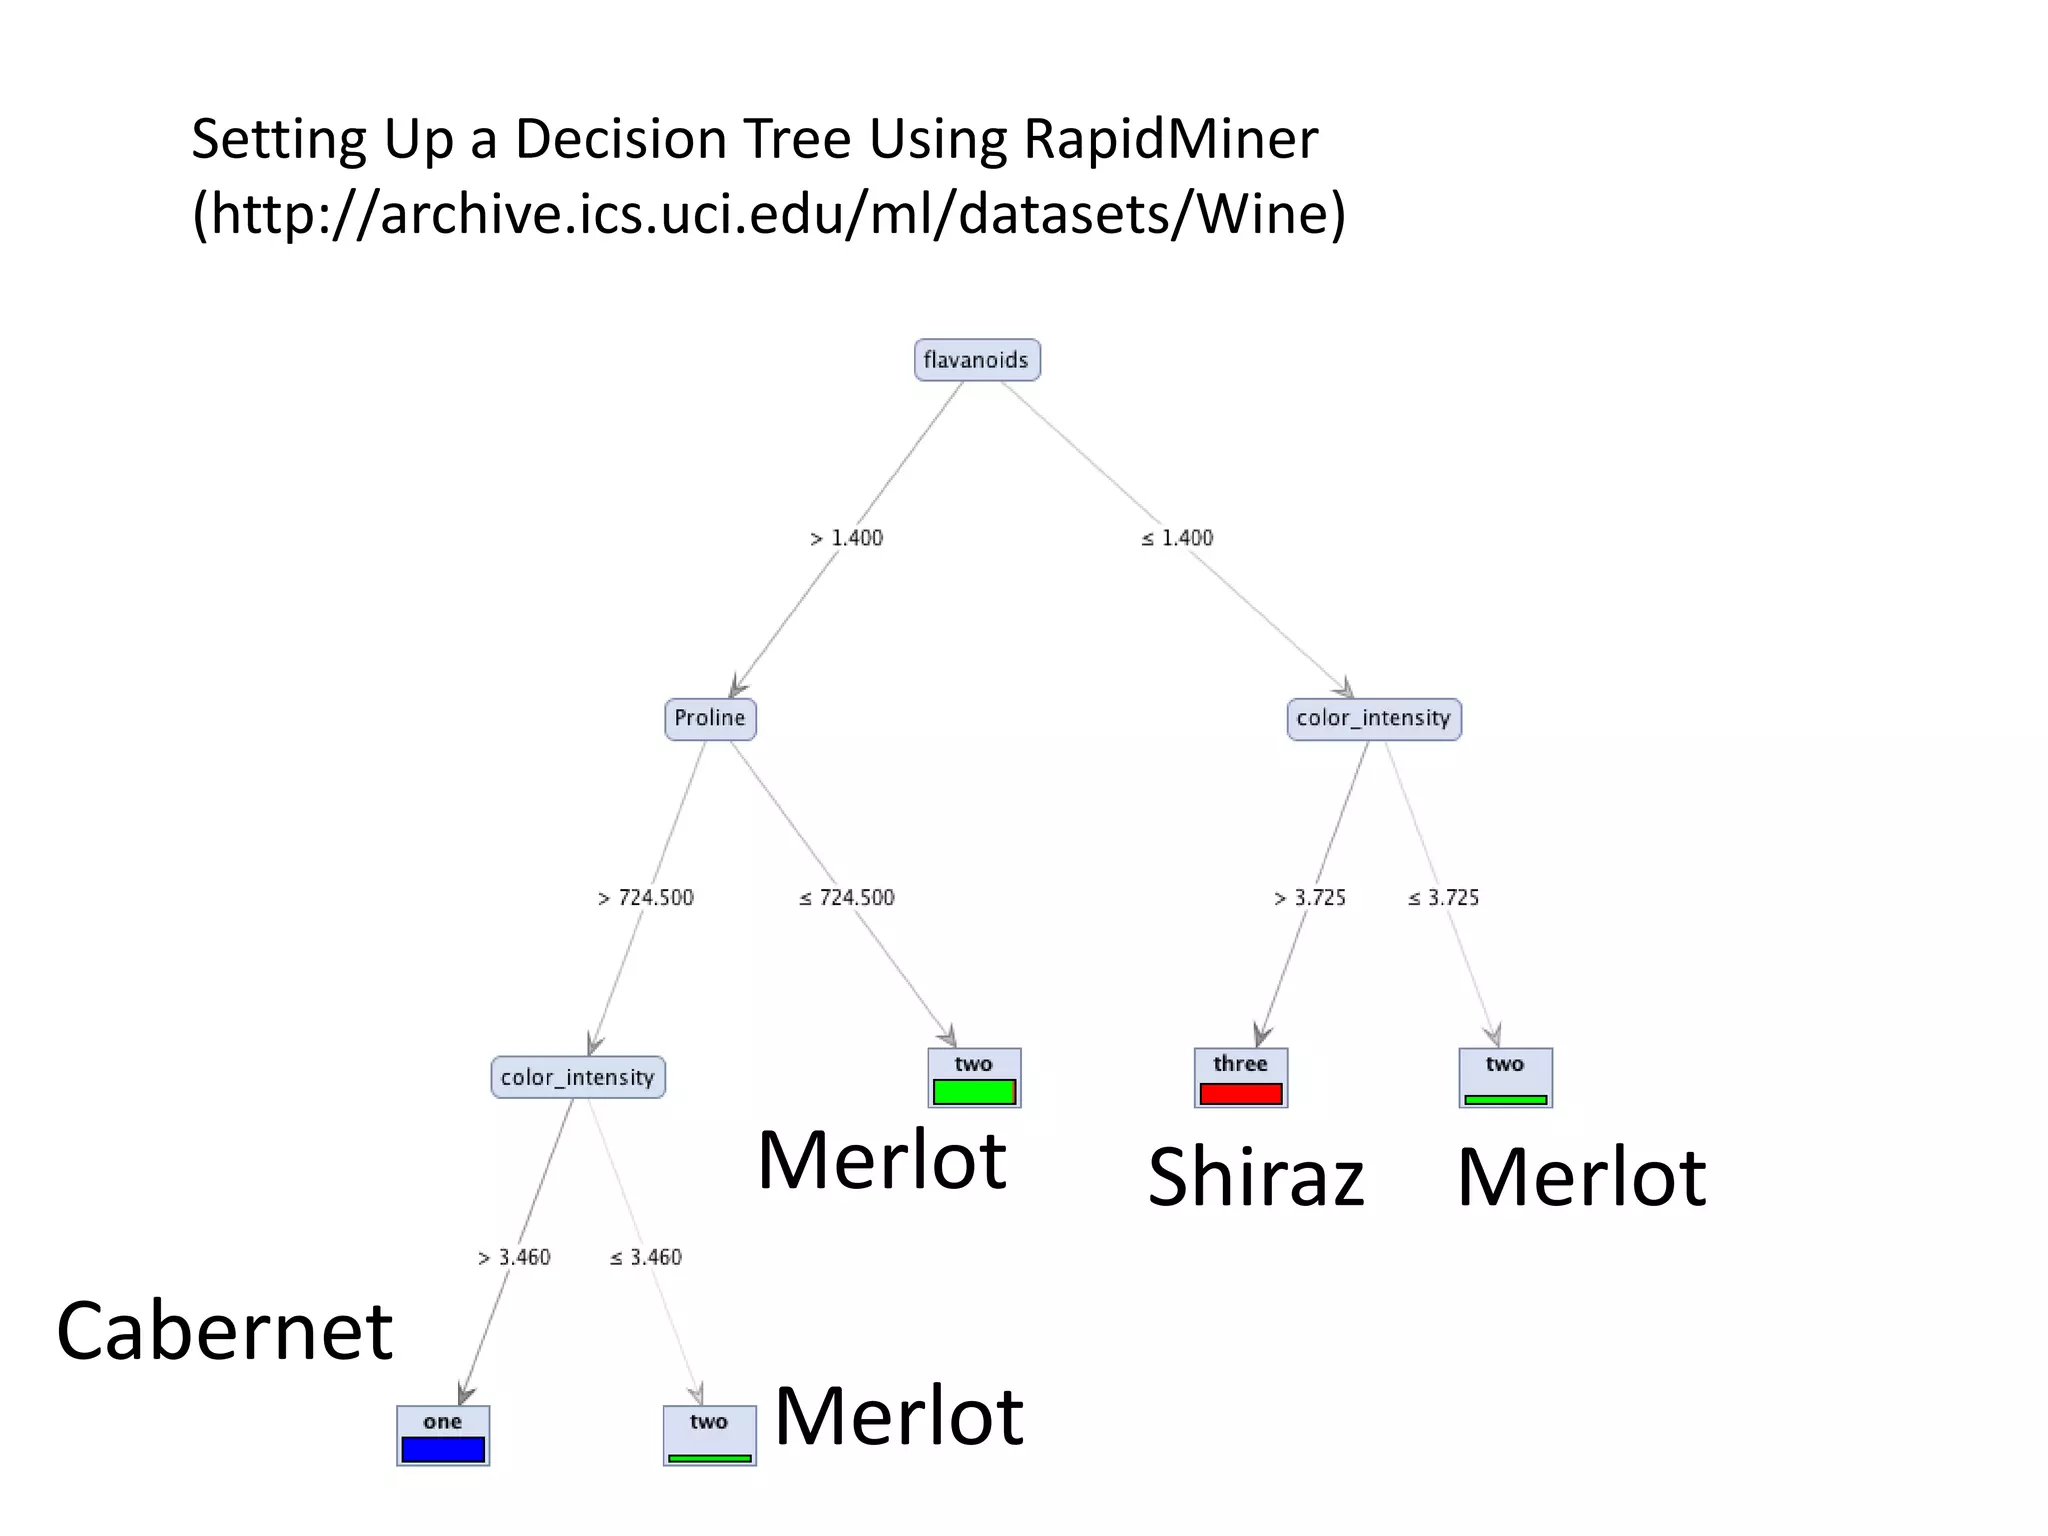
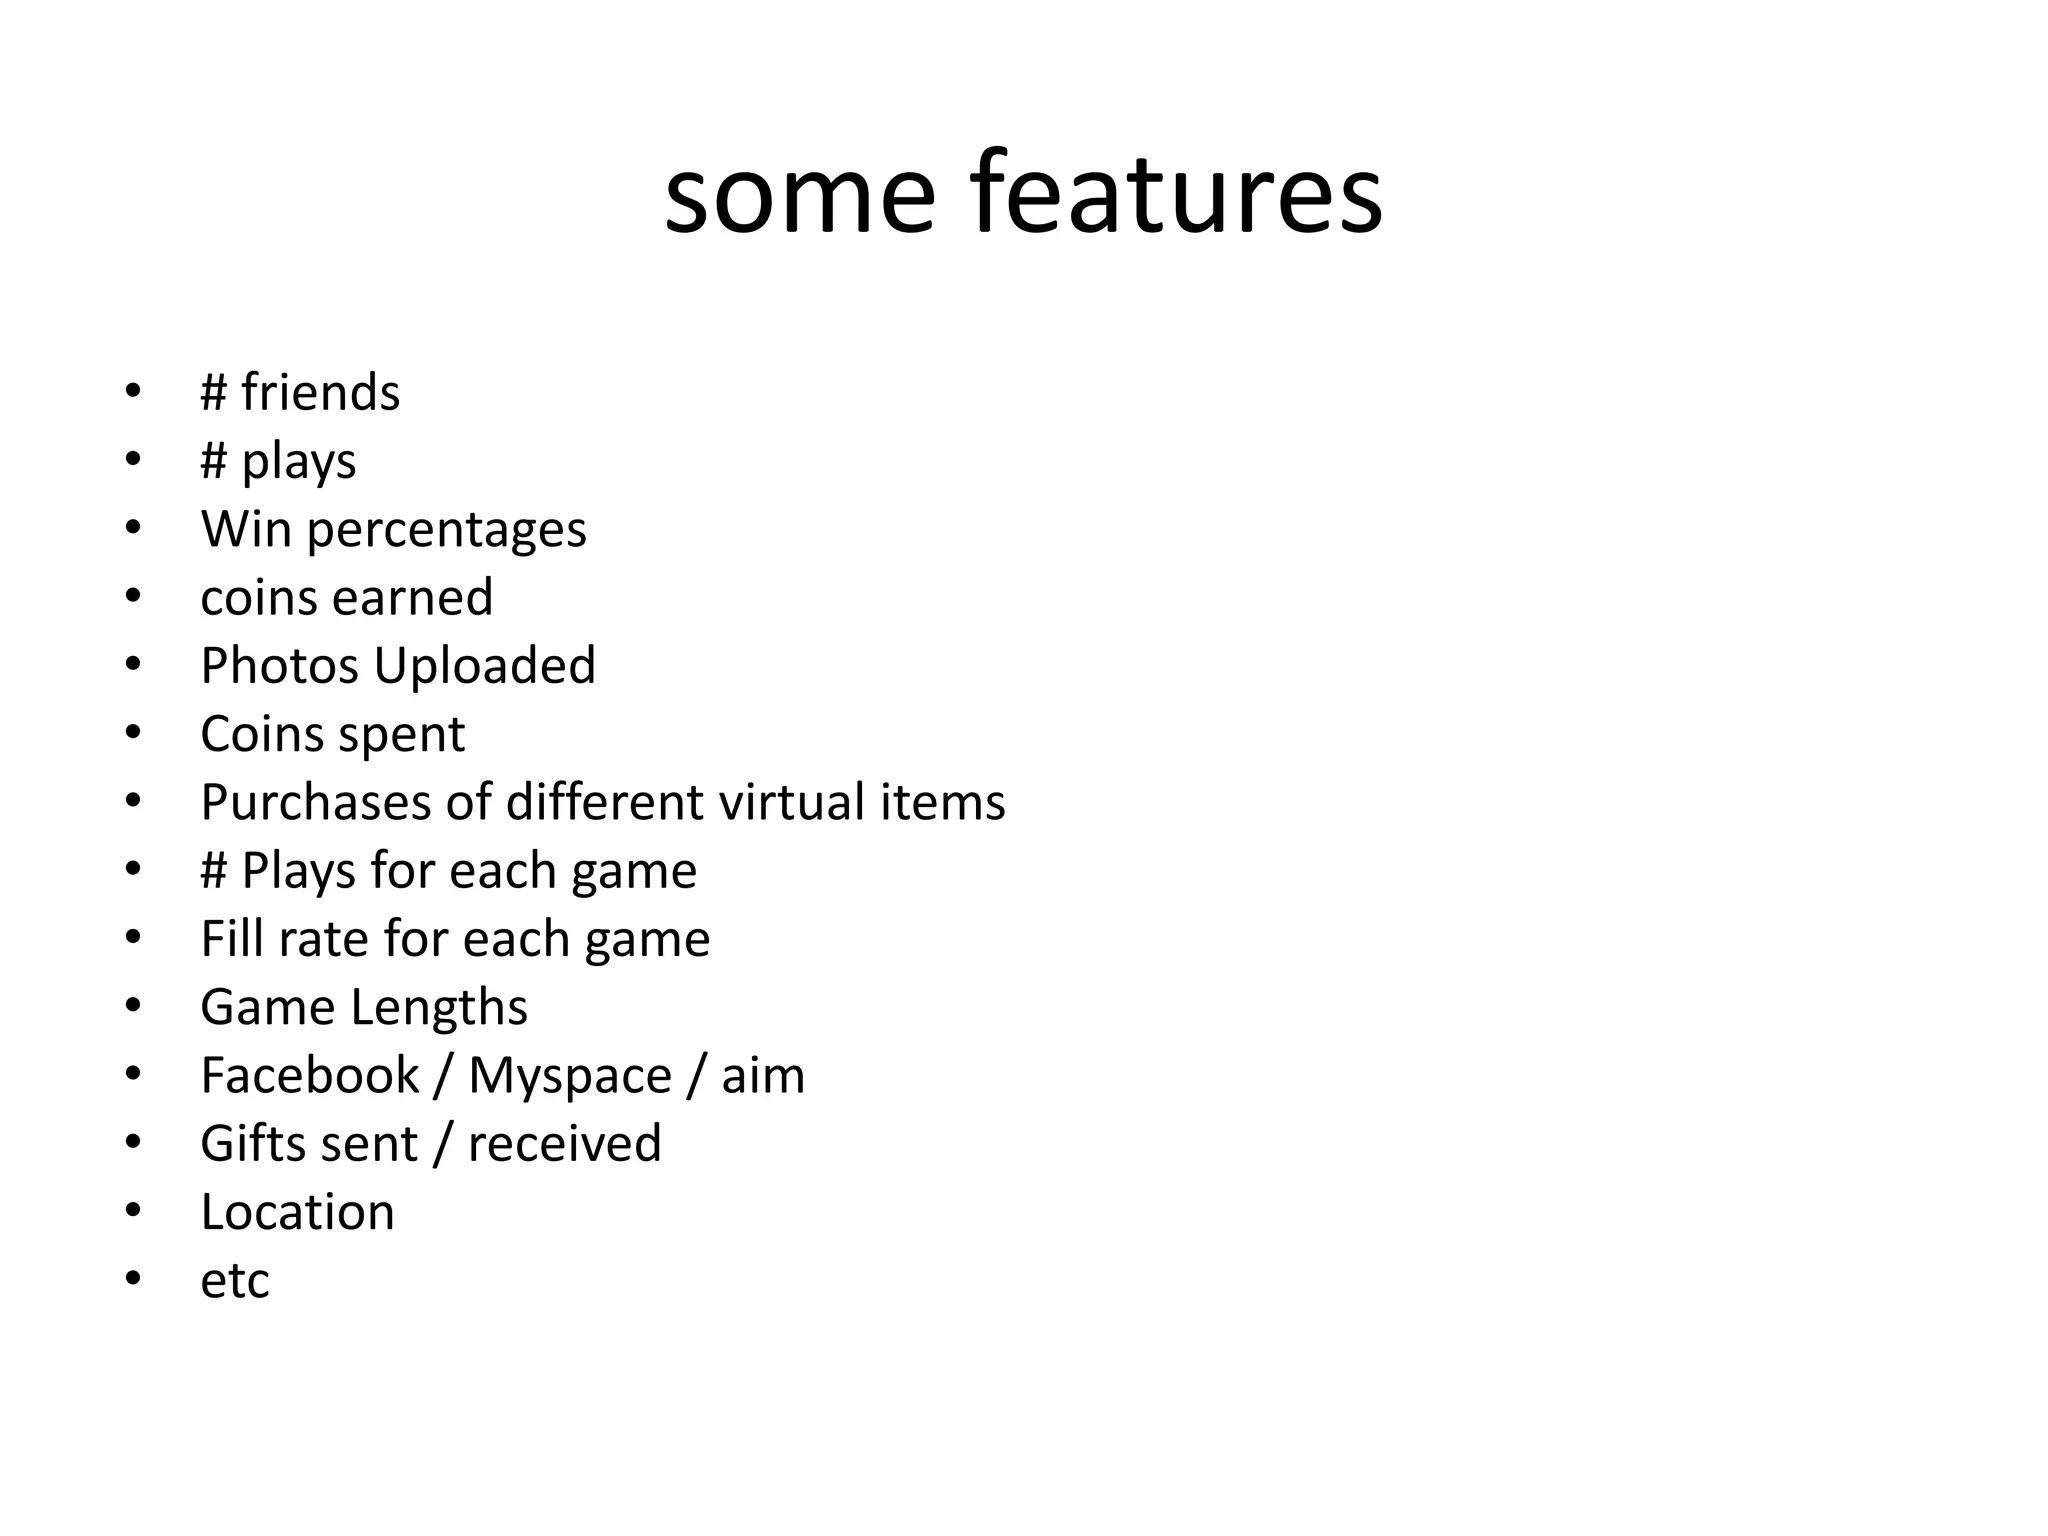
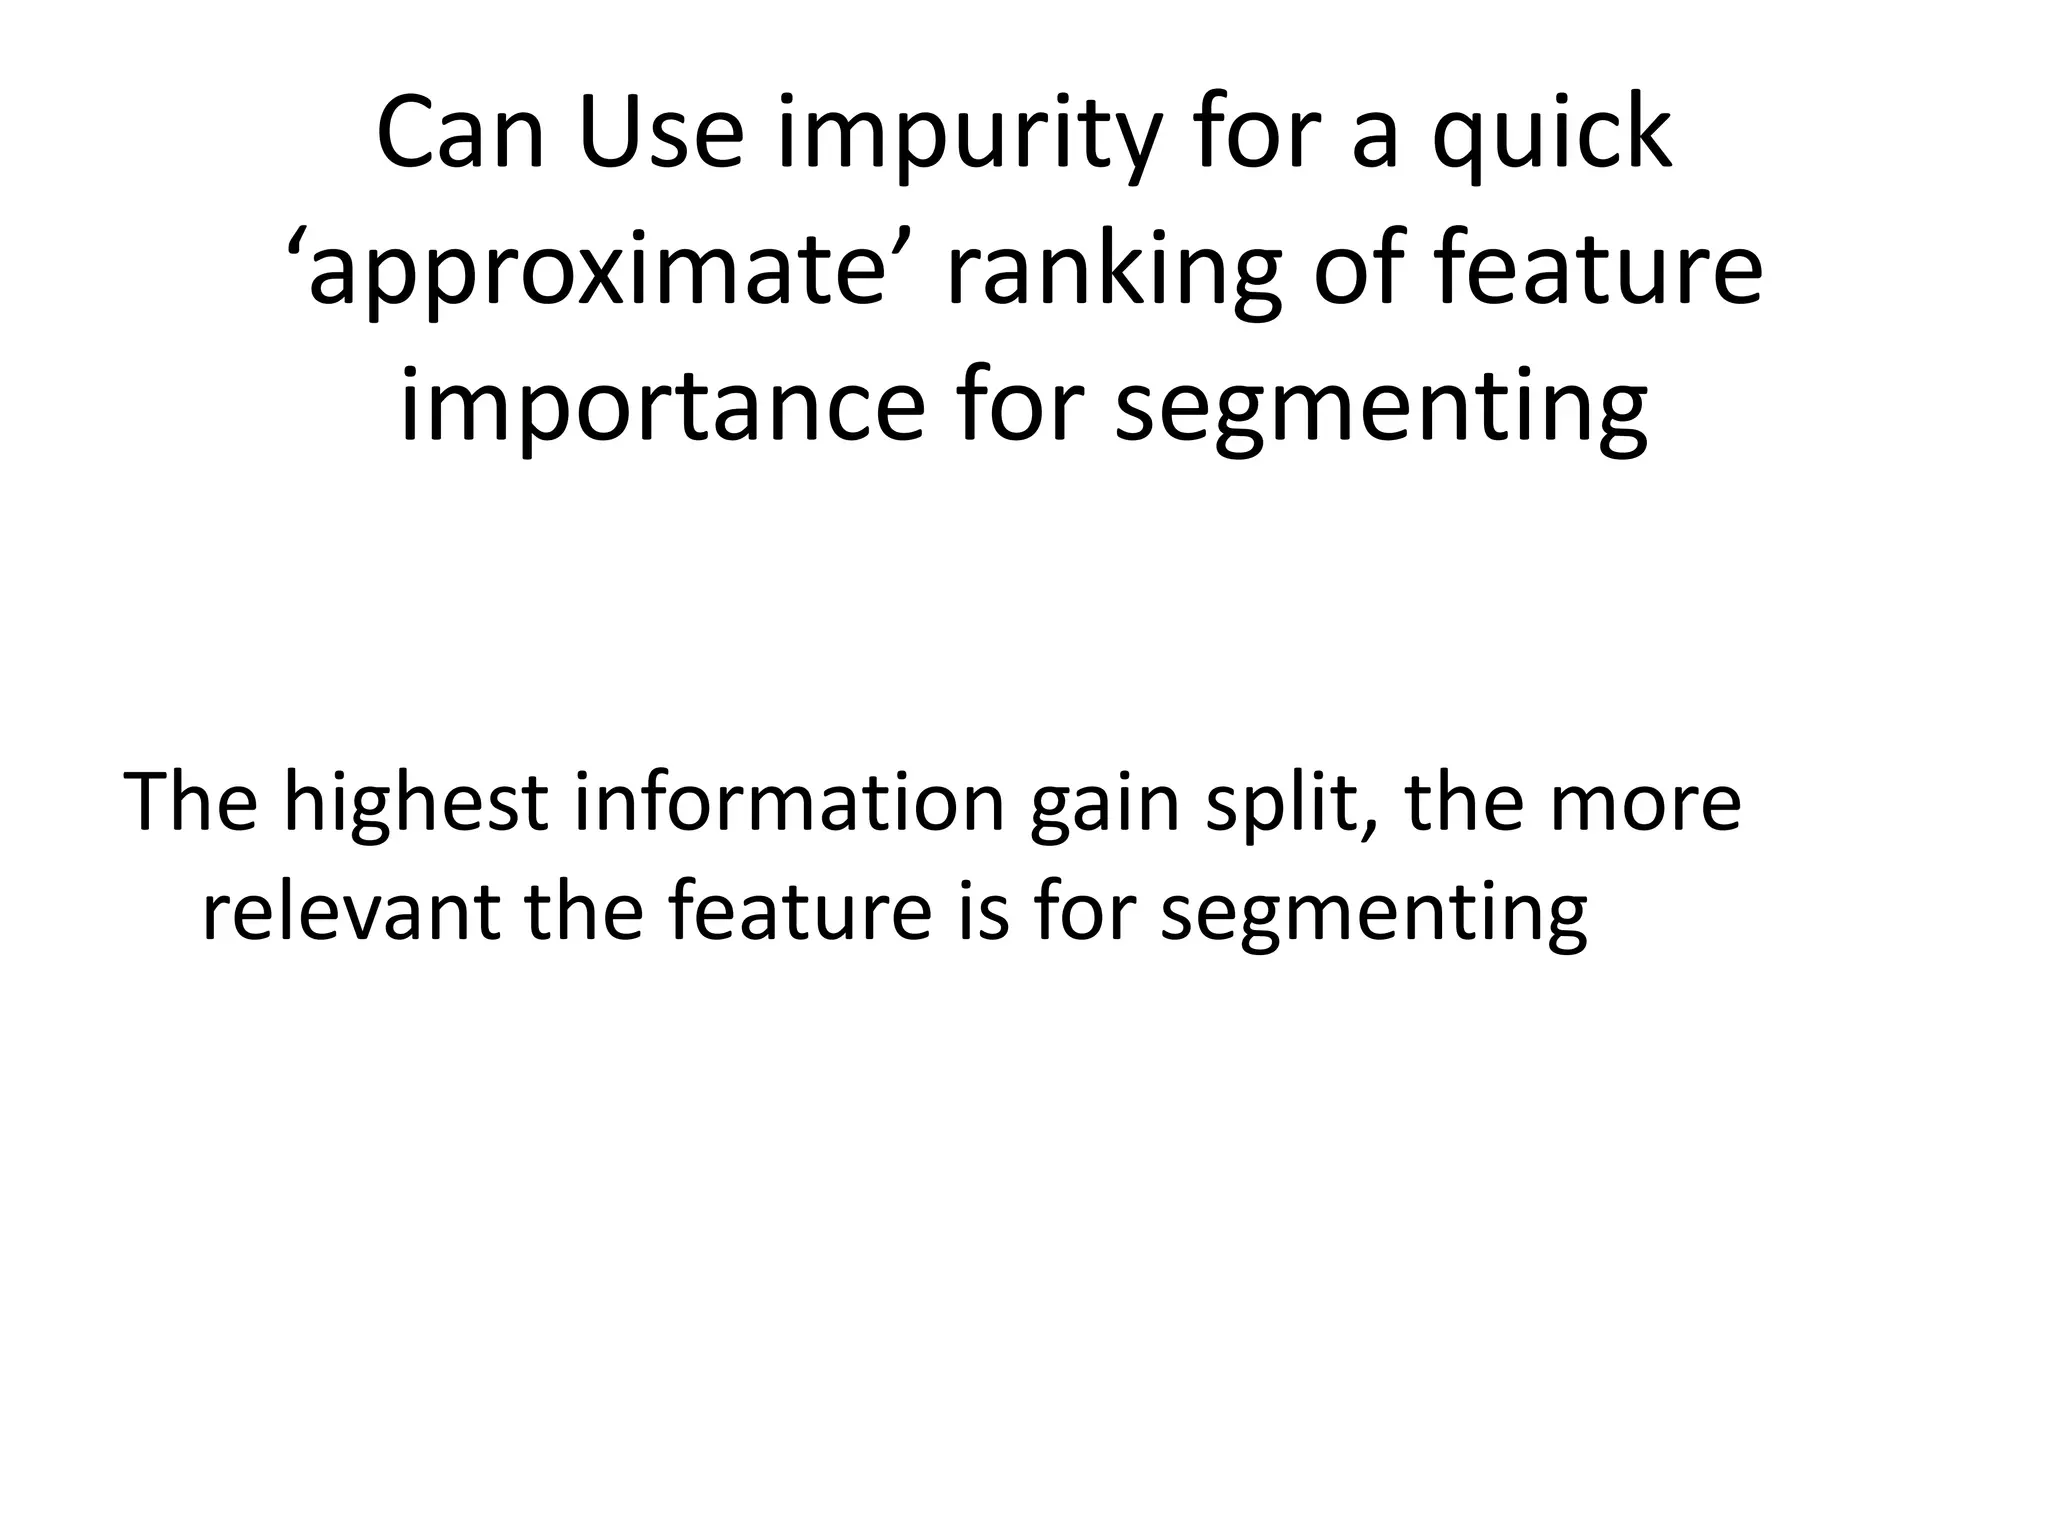
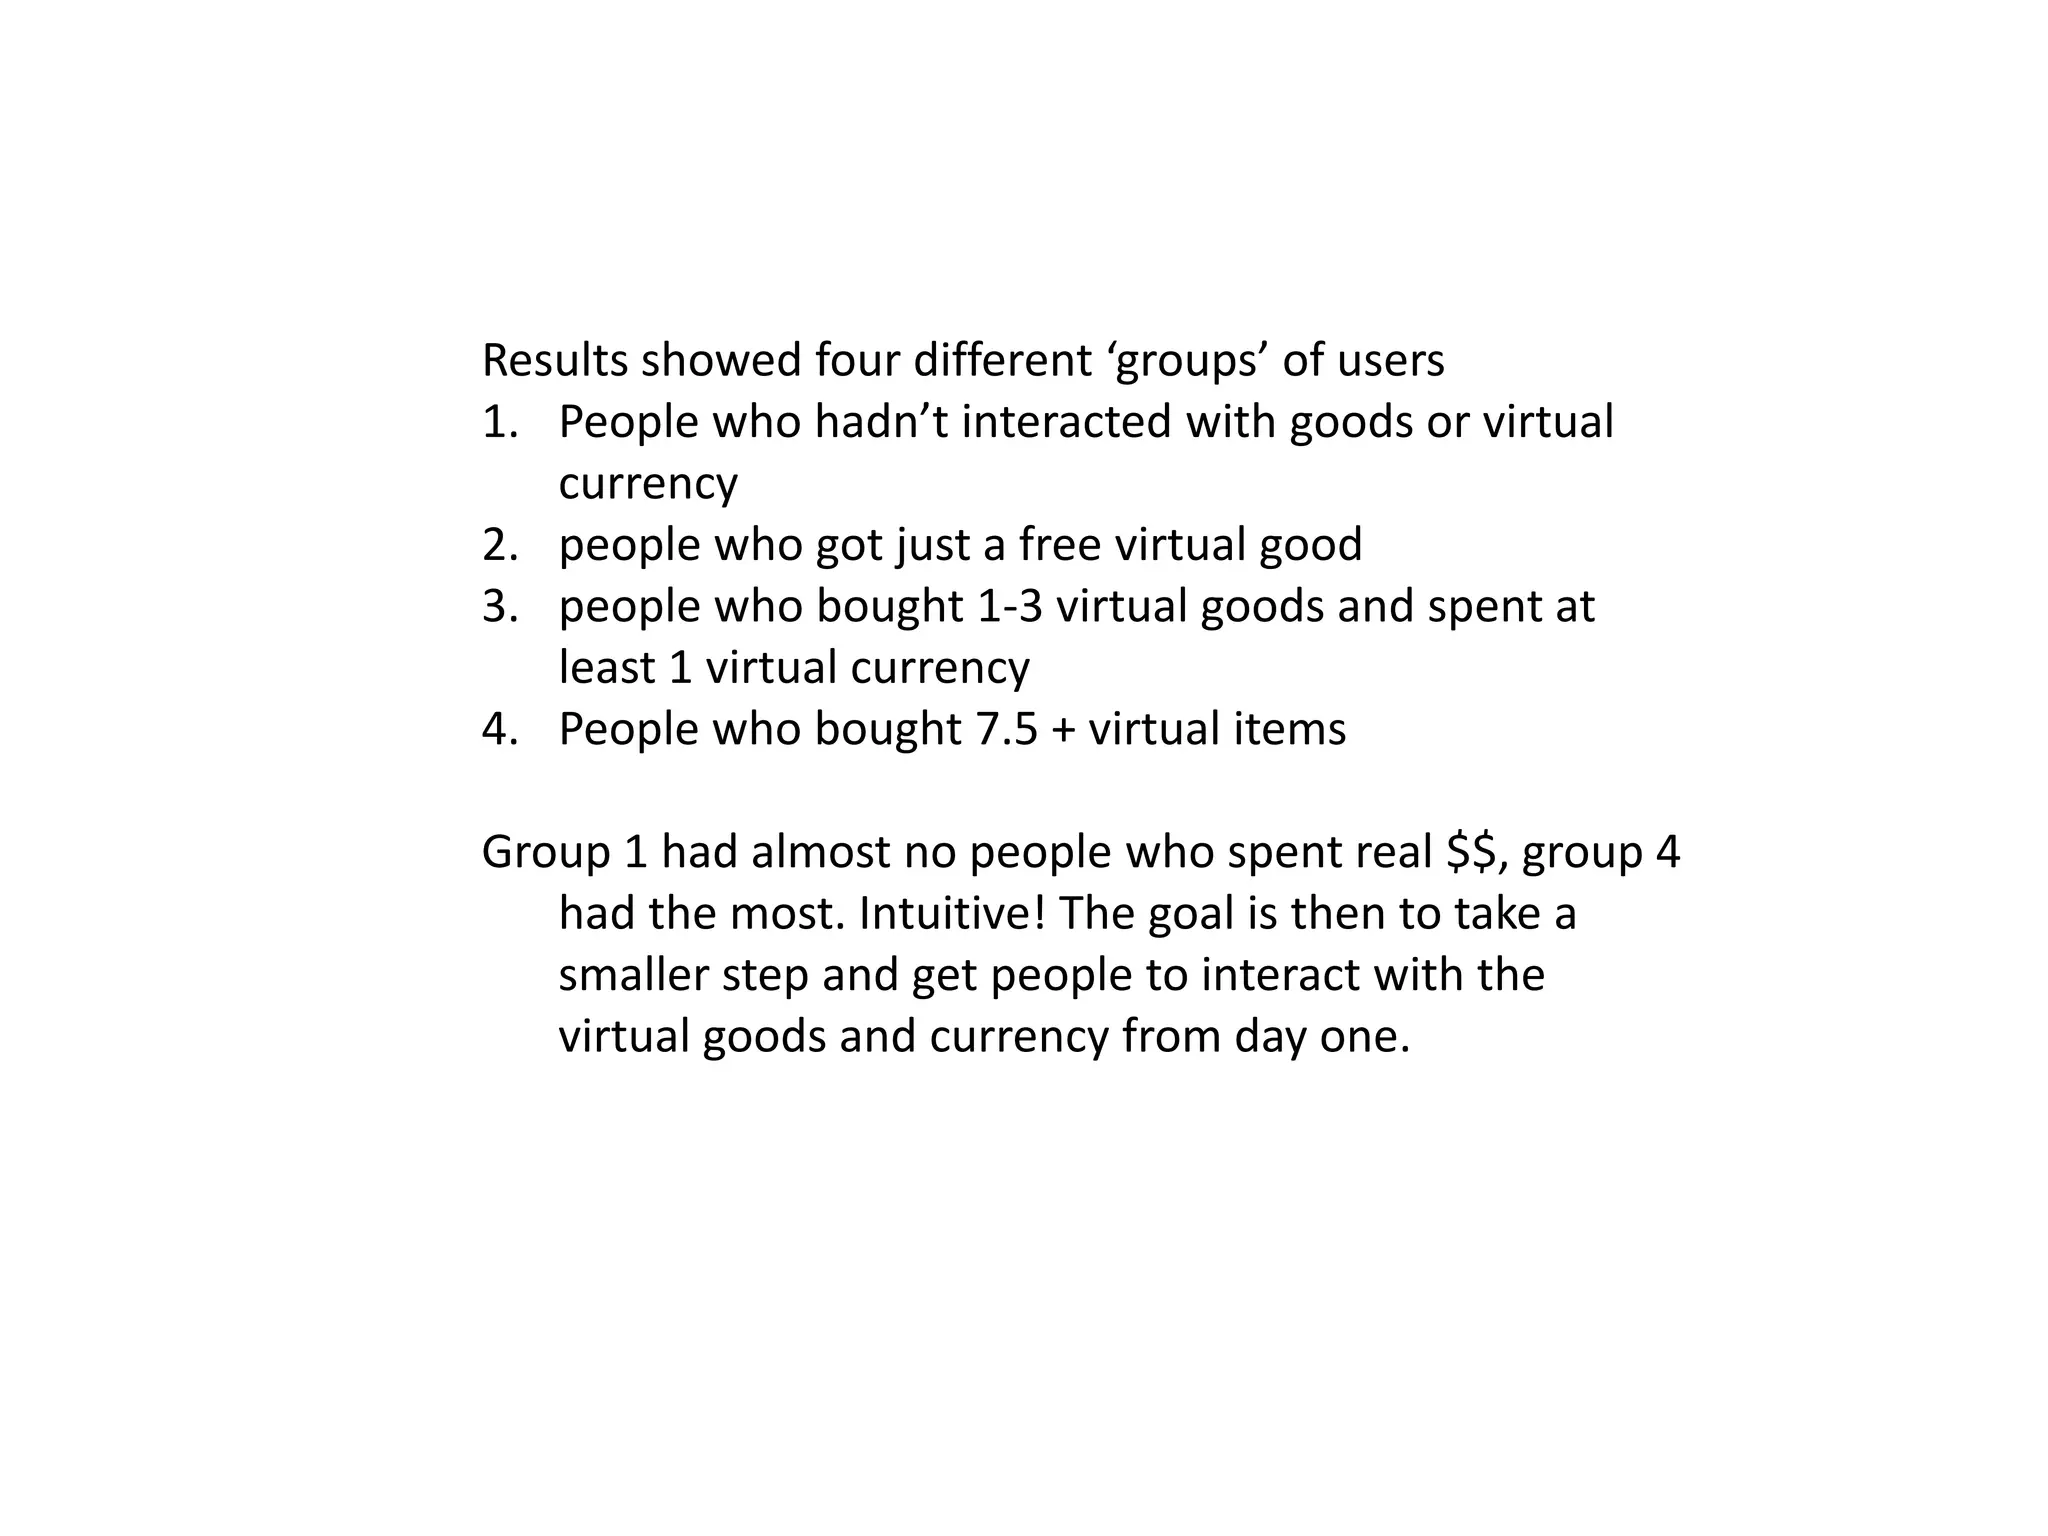
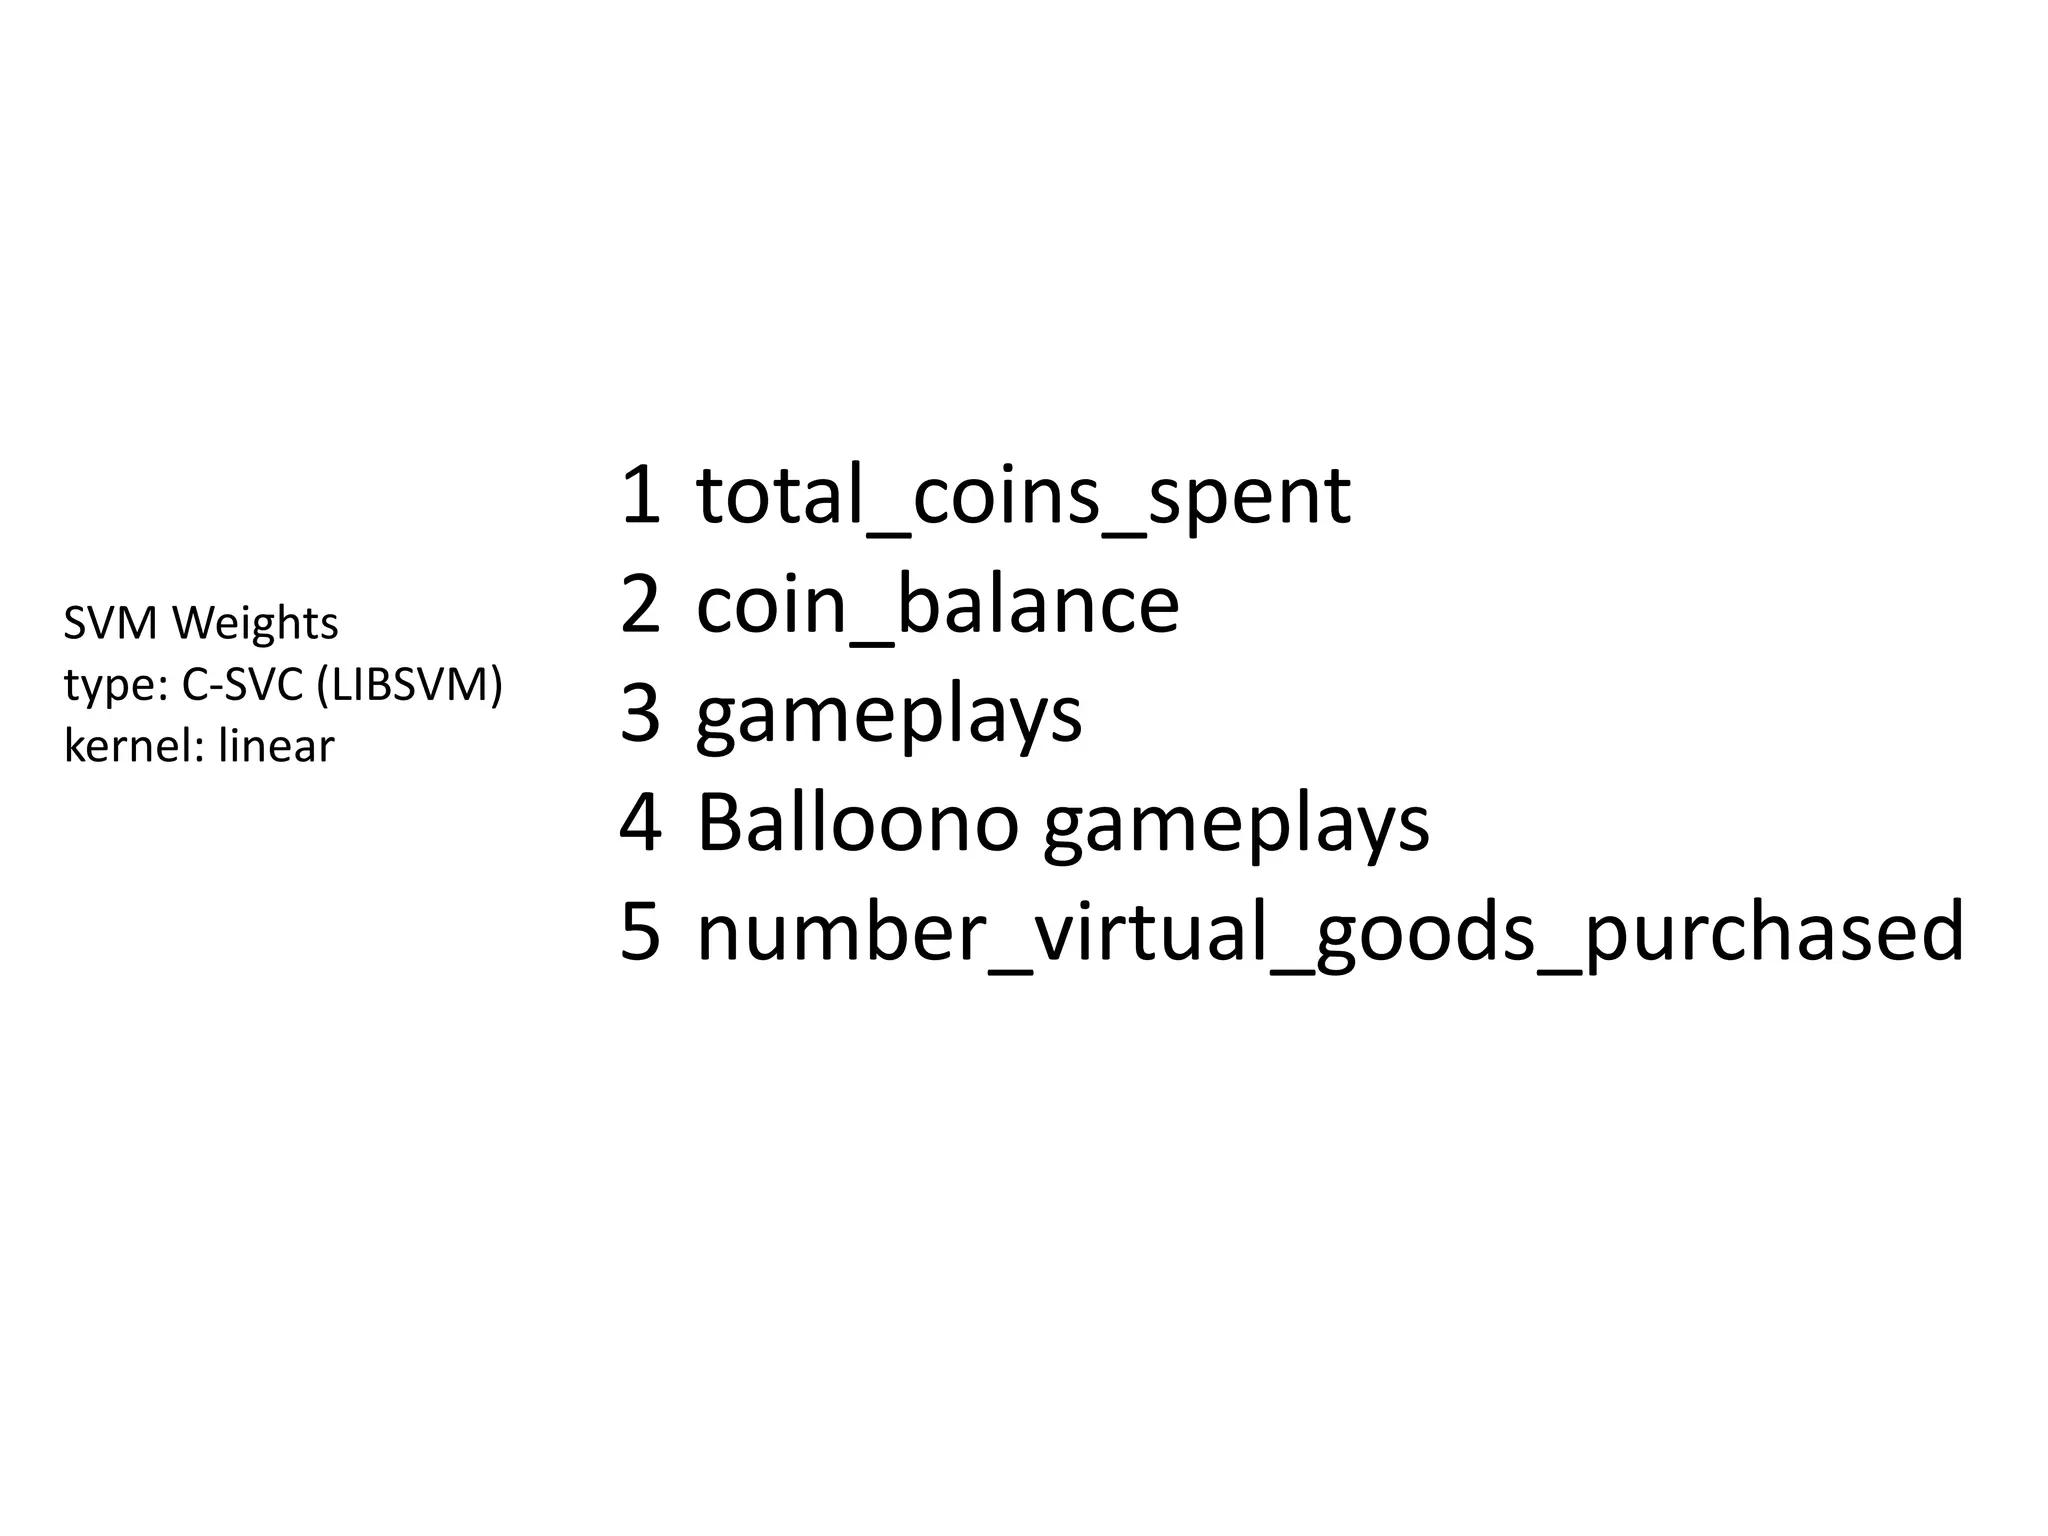
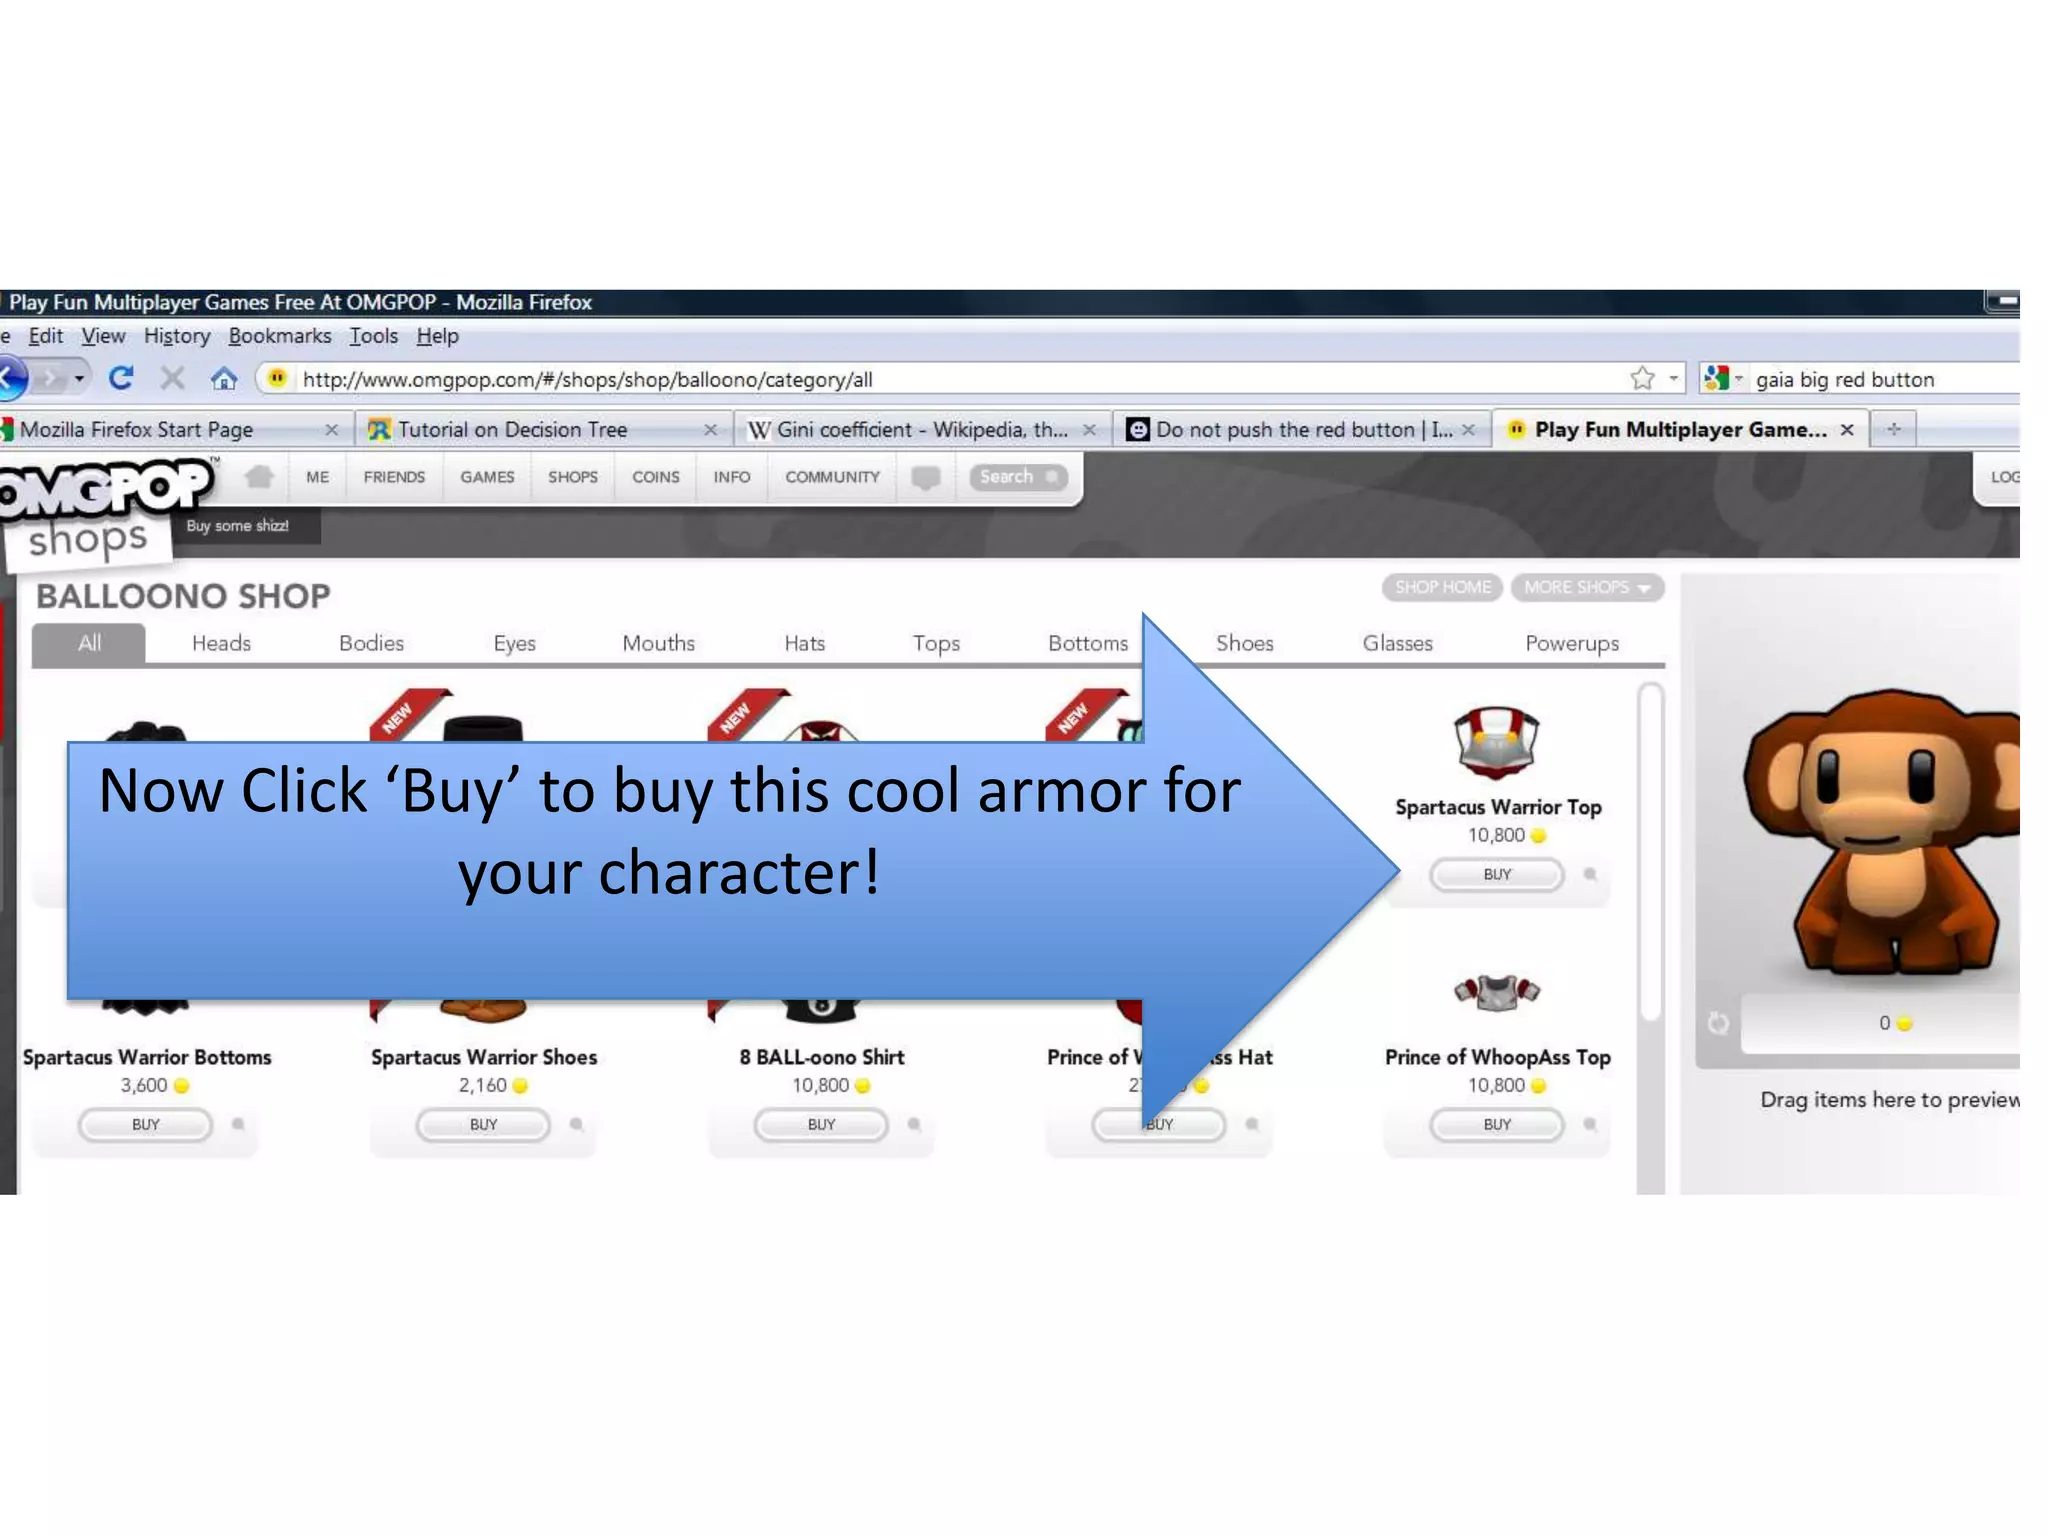
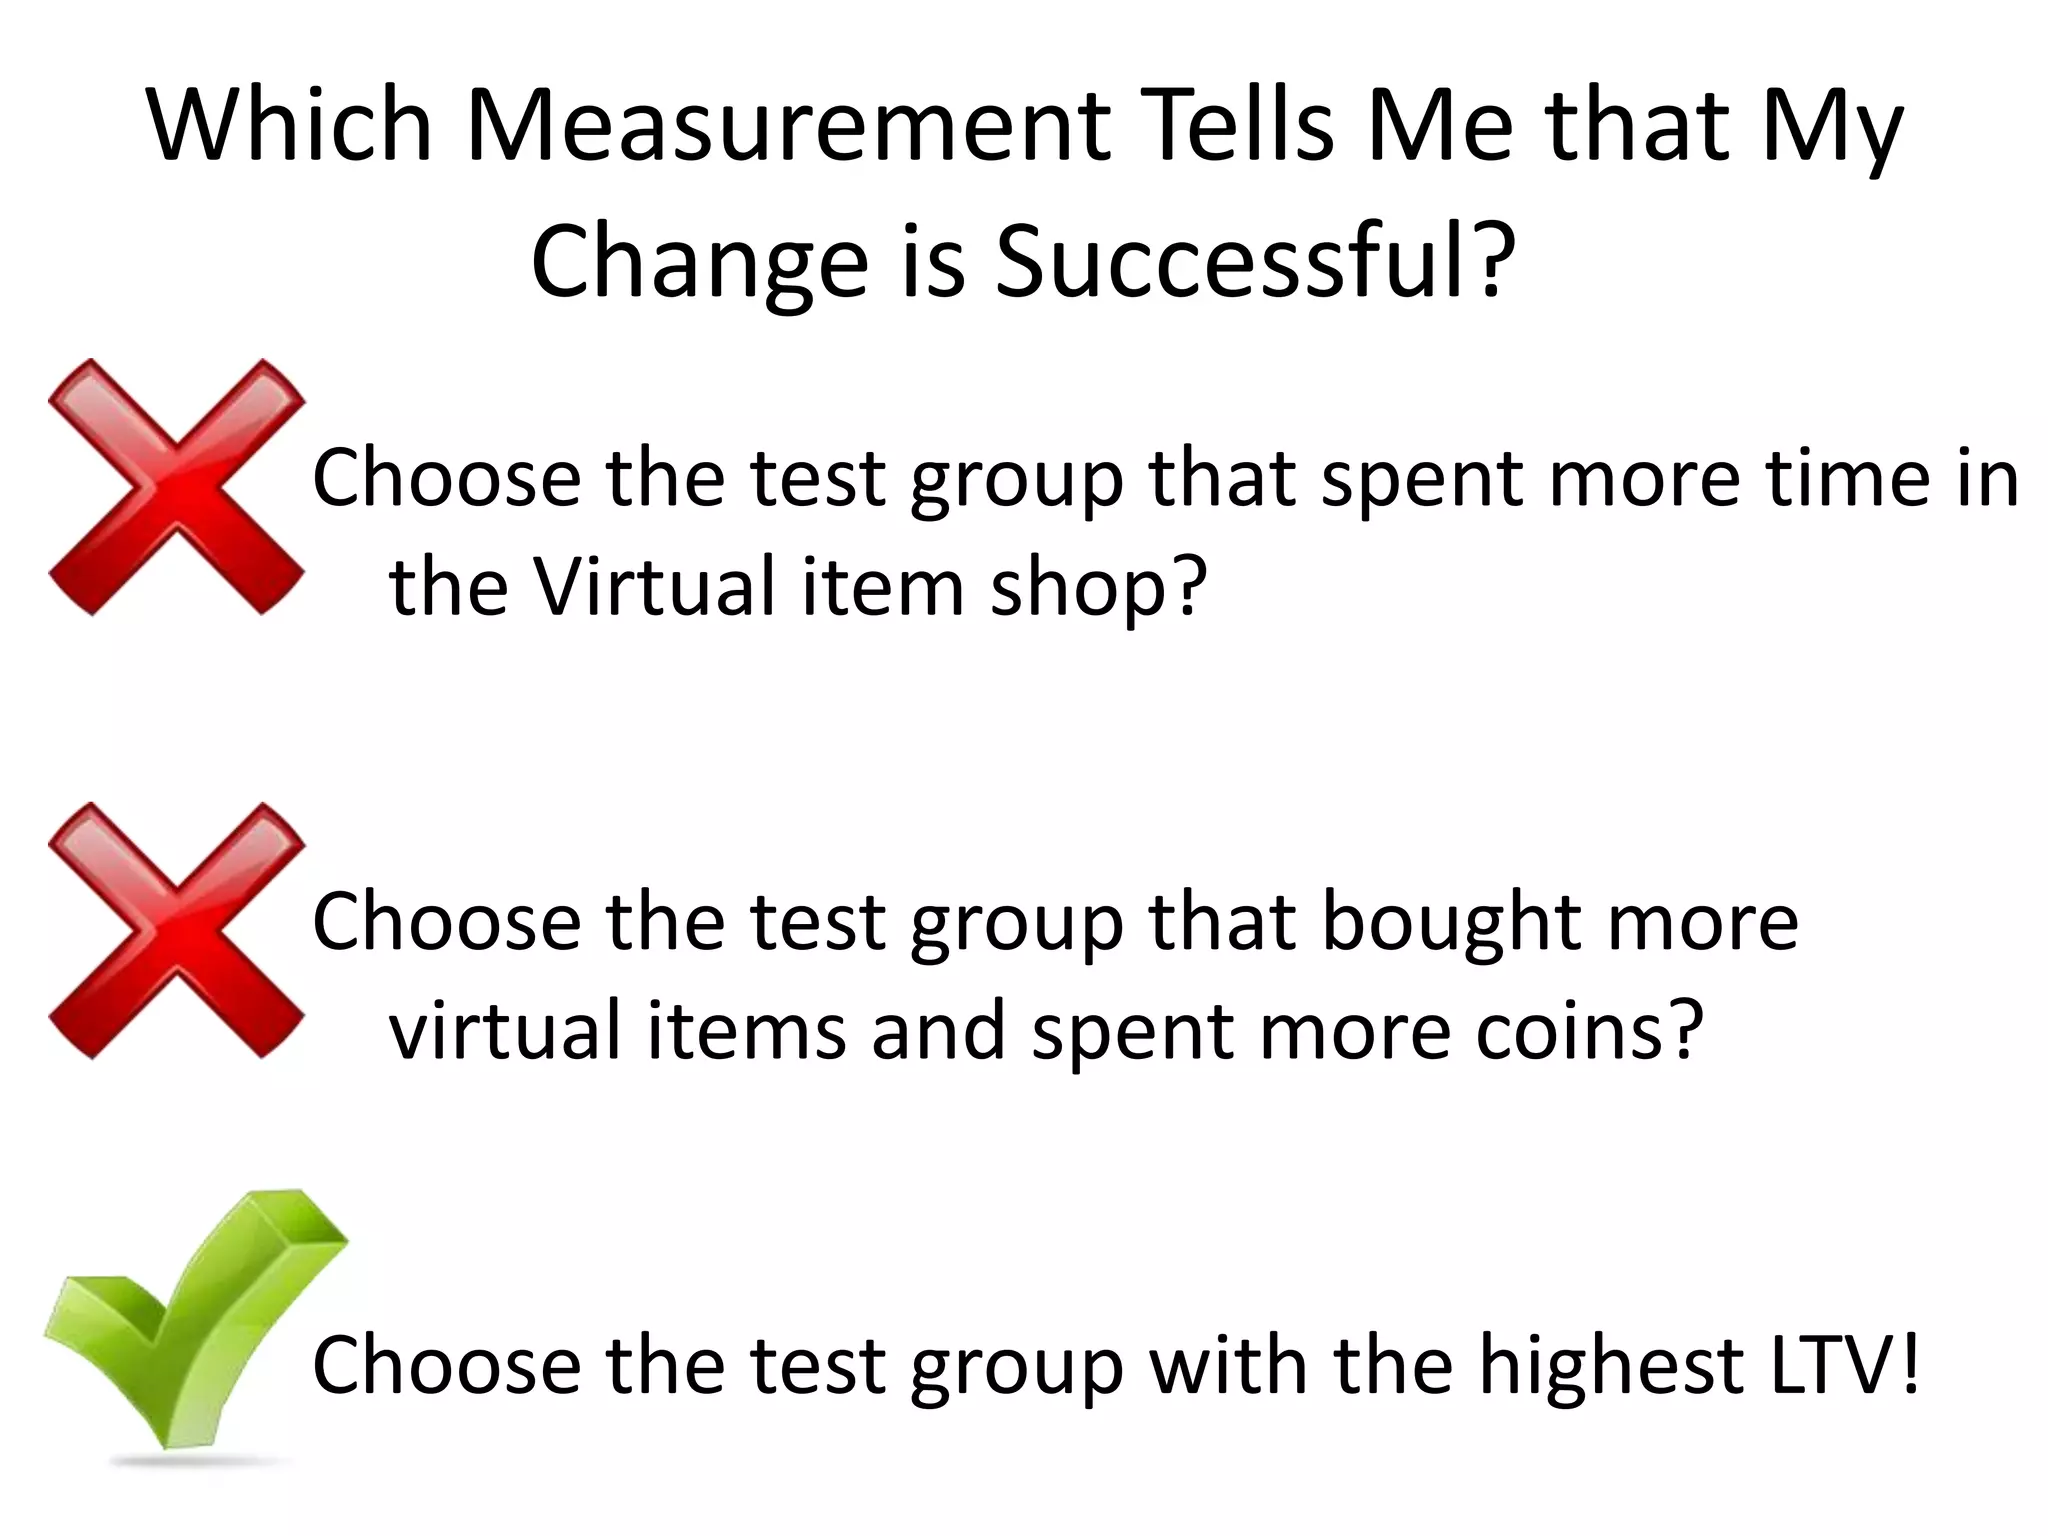
- The document discusses how to use predictive analytics and A/B testing to increase user conversion and revenue for a gaming startup.
- By analyzing user data using decision trees, they found paying users had different experiences than non-paying users, spending more virtual currency on items.
- They implemented an A/B test where new users in group B were forced to spend coins on virtual items initially to mimic paying users' experiences.
- The success of this change would be measured by whether group B bought more virtual items and spent more coins, indicating aligning user experiences increased conversion.
2. How to win at business Earn X+ε per user (Lifetime Value) Pay X to acquire a user (Cost per Acquisition) Black Box 𝑖=0𝑛𝜀𝑖 = WIN (where n is large, and ε>0)
3. “What am I investigating?” “Where do I start?” “What data do I use?” “How do I model my data?” “What is the data telling me?” “What do I do with my new insights?” “How do I know my insights are working?”
4. Customer Lifetime Value How much is a user worth to me over his/her lifetime? CLV(C,S,R) = C * S * R C: conversion to pay S: average transaction size R: average number of purchases over lifetime
5. How do we increase revenue? Conversion = # paying users / # total users Social Gaming sites usually get 1% (low) - 5% (godly)!
14. We have to justify every minute spent on predictive analytics
15. How long do we spend developing, testing, and measuring X feature?”
16.
17. How do we increase conversion? Our site contains MANY features Chat Games Walls Notifications Surveys Pictures Where do we focus our efforts? Which has the greatest ROI?
18. What causes a user to buy? Our Guiding Mantra: A user’s experience on the site is directly correlated with his/her probability to pay P(Buy) P(Buy’) On Site Experience Changes Before After
19. What site experience is causing users to pay? Let’s translate into analytical questions: “What are indicators of paying users?” “What features are unique to paying users?” “What unique experience do payers have that drive them to pay?” “What features separate paying users from nonpaying users?”
20. “What am I investigating?” “Where do I start?” “What data do I use?” “How do I model my data?” “What is the data telling me?” “What do I do with my new insights?” “How do I know my insights are working?”
21. We aggregated over 100 features gender age site_level gameplays logins_count play_intensity login_intensity cents_first_purchase number_virtual_goods_purchased amount_on_first_purchase ingame_items_purchased total_coins_spent total_coins_earned coin_balance number_of_friends total_friends_invited facebook_connected candystand_user aim_user gifts_sent gifts_received ip_address has_mobile_number has_uploaded_photo signup_date pay_date time_to_first_purchase_roundup time_to_first_purchase_round profile_items_purchased balloono_items_purchased
22.
23. So we hired a 3rd party data service to validate
24.
25.
26. We can use the gender questions to build a simple predictive model Input Raw Data Set Choose label Choose classifier Train on X% of the data Test on Y% of the data Remove irrelevant features
27. Name of the game: Train a model with the highest accuracy (confidence) ML Features Result Data Accuracy determined by data – want to remove data that doesn’t contribute relevant information (i.e. remove noise)
28. Choosing Features 1. Intuition to choose many possible important features 2. Remove features that you can’t trust 3. Approximate Importance of features 4. Train model 5. Re-Train model on subsets of feature list and choose features that yield highest accuracy
29. Problems Comparing Features Between Our Users Select Features Common to payers and Nonpayers Keep Distributions Intact Our Experience: Had to compare users stats right before their first purchase (behavior on site changes after first purchase) -100 Plays -20 days on site -Paid $20 -10 Plays -1 days on site -Didn’t pay
33. “What am I investigating?” “Where do I start?” “What data do I use?” “How do I model my data?” “What is the data telling me?” “What do I do with my new insights?” “How do I know my insights are working?”
34. What does a Classification Model do? Model ‘learns’ to classify apples and oranges Classification Model Labeled Apples and Oranges pruning, optimize parameters, weights, etc Unlabeled Fruit Classification Model % Chance of Being an Apple (or orange)
35. Applying a Predictive Model Purpose We are a startup, we need quick results, interpretation, and action Decision Tree Pros: Easily Understood / interpreted Calculates Quickly Cons Local max only (greedy) Less Accuracy
39. Purity Measure Homogeneity of the Labels Degree of Homogeneity is measured through: Entropy Gini Index others = probability of occurence of class j in the sample
40. Decision Tree Algorithm (simplified) Calculate Impurity for Original Sample (probability for each ) P(Payer) = P, P(nonpayer) = N, use relative frequencies Entropy: -P*log(P) + -N*log(N) **Entropy of a single label is zero ( if 1 class C, P(C) =1, thus log(1) = 0) 2. Calculate Information Gain for each possible attribute split split table -- difference in impurity measure is called the Information Gain IG= E(Original Table) – Sum_i (n * k /n * E( Feature_table_i ) 3. Choose the attribute split that results in the highest information gain 4. Remove Splitting Attribute, Recusively keep splitting on highest information gain attribute – Done when no more attributes, information gain is too tiny, or max depth of tree
41. Calculate Impurity for Sample P(Payer) = P, P(nonpayer) = N, use relative frequencies Entropy: -P*log(P) + -N*log(N) **Entropy of a single label is zero ( if 1 class C, P(C) =1, thus log(1) = 0)
43. Decision Tree Algorithm (simplified) Calculate Entropy for Original Table(probability for each ) P(Payer) = P, P(nonpayer) = N, use relative frequencies Entropy: -P*log(P) + -N*log(N) **Entropy of a single label is zero ( if 1 class C, P(C) =1, thus log(1) = 0) 2. Take the difference in entropy between our original table and the weighted sum of the split tables -- difference in impurity measure is called the Information Gain IG= E(Original Table) – Sum_i (n * k /n * E( Feature_table_i ) 3. Choose the attribute split that results in the highest information gain 4. Keep splitting on highest information gain attributes, repeat until a certain depth of tree has been reached, or until a certain lower threshold of information gain is achieved
44. Setting Up a Decision Tree Using RapidMiner (http://archive.ics.uci.edu/ml/datasets/Wine) Merlot Shiraz Merlot Cabernet Merlot
45. some features # friends # plays Win percentages coins earned Photos Uploaded Coins spent Purchases of different virtual items # Plays for each game Fill rate for each game Game Lengths Facebook / Myspace / aim Gifts sent / received Location etc
46. Can Use impurity for a quick ‘approximate’ ranking of feature importance for segmenting The highest information gain split, the more relevant the feature is for segmenting
47. Ideas for what features seperated nonpaying users from paying users?
48. Results showed four different ‘groups’ of users People who hadn’t interacted with goods or virtual currency people who got just a free virtual good people who bought 1-3 virtual goods and spent at least 1 virtual currency People who bought 7.5 + virtual items Group 1 had almost no people who spent real $$, group 4 had the most. Intuitive! The goal is then to take a smaller step and get people to interact with the virtual goods and currency from day one.
53. Payers and Nonpayers are having different experiences! Most people purchase at the START of their experience (seen in distribution of payers) People who spend $$ are those who spend their virtual currency buying virtual goods Extracting Insights From The Model
54. We want the nonpaying user to have the same experience as the paying user
56. On a website… So you cant click for the user, but... You control the flows, i.e you ‘direct’ people where to click, and have HUGE INFLUENCE over what users do on your site Only one link? No where else to go.
57. We want people to buy more virtual items and spend more coins at the start of their experience…and we can direct where people click… So?
58. On the first login, directFORCE all new users to spend coins buying virtual items!
59. Theory Someone can easily go through the site without EVER having spent a single coin. Lubricate the purchasing process Habituate users to spend / buy early and often Getting people to spend more coins will increase conversion Forcing NOT the same as User Elected Action, But it Likens their Experiences!
60. A Quick Look Back Extract ‘Insights’ from the model See most relevant separating features Bridge the gap between separating features
61. Data at the Helm Hard to make ‘Guiding Decisions’ Data Inspires Confidence in decisions moving forward Worse Case - learn how data changed in response to change on website, new insight!
63. A/B Testing Show some users layout ‘A’ Show other users layout ‘B’ Measure how many people who see layout ‘A’ who do some action vs people who saw layout ‘B’ Choose the layout that had the highest conversion to action Google Web Optimizer for HTML A/B Testing
64. Implementing an A/B Test GROUP A (control group - no changes) GROUP B (Force Buy) Signup Play Leaves Put User Into Shop, Give Coins, Popup to Buy a Virtual item Signup Play Leaves
66. Which Measurement Tells Me that My Change is Successful? Choose the test group that spent more time in the Virtual item shop? Choose the test group that bought more virtual items and spent more coins? Choose the test group with the highest LTV!