OpenStreetMap
•Download as PPTX, PDF•
1 like•1,591 views

OpenStreetMap is a free and open editable map of the world created by volunteers. Users can view, edit, and use geographic data from anywhere on Earth. The project harnesses tools to create, assemble, and share geographic information provided freely by individuals.

Recommended
More Related Content
What's hot
What's hot (20)
Viewers also liked
Viewers also liked (13)
Similar to OpenStreetMap
Similar to OpenStreetMap (20)
More from Martijn van Exel
More from Martijn van Exel (12)
Recently uploaded
Recently uploaded (20)
OpenStreetMap
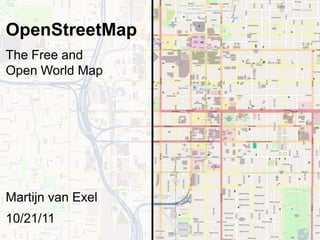
- 1. OpenStreetMap The Free and Open World Map Martijn van Exel 10/21/11
- 2. OpenStreetMap is a free editable map of the whole world. It is made by people like you. OpenStreetMap allows you to view, edit and use geographical data in a collaborative way from anywhere on Earth. OpenStreetMap is Volunteered Geographic Information: the harnessing of tools to create, assemble, and disseminate geographic data provided voluntarily by individuals. Goodchild, M.F. (2007). "Citizens as sensors: the world of volunteered geography". GeoJournal 69 (4): 211–221
- 3. Free ● As in: without (many) licensing restrictions ● As in: at no cost to acquire
- 4. Editable ● Compare to Wikipedia ● 450,000 contributors ● Data is always in flux
- 5. OpenStreetMap objects Nodes Ways Points with (X,Y) and attributes Ordered set of nodes. Polygons are closed ways, not a separate entity. Can have attributes. Relations Groups of objects with a functional or geographic relationship
- 7. OpenStreetMap „Standards‟ ● Conventions rather than standards ● Discussed on mailing lists and Wiki ● Proposal and voting system for new tags ● You can map whatever you want ● The only rule is verifiability
- 8. OpenStreetMap editing tools Potlatch – Flash-based web editor
- 9. OpenStreetMap editing tools JOSM – Java-based desktop editor
- 10. Mapping Strategies (1) Surveying with GPS, Camera, pen & paper Mapping Party in the UK
- 11. Mapping Strategies (1) Surveying with GPS, Camera, pen & paper Walking Papers
- 12. Mapping Strategies (2) “Armchair mapping” • Permission to trace over Bing satellite and aerial imagery • Enables mapping remote / disaster areas without local contributors
- 14. Mapping Strategies (3) Importing free and open data US TIGER line data import
- 15. OpenStreetMap is many maps
- 16. OpenCycleMap OpenCycleMap http://opencyclemap.org/
- 17. TopOSM TopOSM http://toposm.com/us/index.html
- 18. 8-bit cities http://8bitcity.com/map?New%20York
- 19. Maps on a blanket https://wiki.openstreetmap.org/wiki/Featured_Images/Jul-Sep_2011#Week_27
- 22. Maps on a Kindle http://www.kindle-maps.com/blog/kindle-specific-map-style.html
- 23. Wheelchair Routing http://www.rollstuhlrouting.de/routenplaner.html
- 24. Maps and directions on a SatNav https://wiki.openstreetmap.org/wiki/Featured_Images/Oct-Dec_2011#Week_41
- 25. OpenTripPlanner
- 26. OpenTripPlanner • Multimodal trip planner for Portland metro • Beta launched this week • All Open Source software • OpenStreetMap as base layer – most cost effective solution • Result: improved trip advice, lower cost • But: data quality not consistent – lot of cleanup / enhancement required
- 27. WARM VS. COLD G E O G R A P H Y ● Free form ● Commissioned ● Driven by personal ● Driven by abstracted needs and interests use cases ● Organic ● Pre-defined ● Bottom-up ● Top-down ● Continuous ● Discrete
- 28. Warm geography requires local communities Ortigas/Mandaluyong (Phillipines) mapping party Photo from http://bit.ly/oJ3fKZ OpenStreetMap requires local communities
- 30. Community score card ● 95% of edits done by 12% of users ● 9% untouched TIGER ● 4.8 avg version increase of TIGER roads ● 8% of features touched in last 3 months, 40% in last year 77°
- 31. Community score card ● 95% of edits done by 5% of users ● 32% untouched TIGER ● 1.4 avg version increase of TIGER roads ● 14% of features touched in last 3 months, 52% in last year 59°
- 32. Community score card ● 95% of edits done by 13% of users ● 4% untouched TIGER ● 4.2 avg version increase of TIGER roads ● 2% of features touched in last 3 months, 7% in last year 59°
- 33. Community score card ● 95% of edits done by 27% of users ● 13% untouched TIGER ● 2.6 avg version increase of TIGER roads ● 26% of features touched in last 3 months, 62% in last year 87°
- 34. Community score card ● 95% of edits done by 6% of users ● 24% untouched TIGER ● 1.5 avg version increase of TIGER roads ● 3% of features touched in last 3 months, 5% in last year 38°
- 35. Community score card ● 95% of edits done by 8% of users ● 40% untouched TIGER ● 0.9 avg version increase of TIGER roads ● 4% of features touched in last 3 months, 12% in last year 34°
- 36. Community score card ● 95% of edits done by 26% of users ● 80% untouched TIGER ● 0.4 avg version increase of TIGER roads ● 1% of features touched in last 3 months, 7% in last year 20°
- 38. SIGN-UP CONTRIBUTE COLLABORATE OWN
- 39. Conclusions ● Free and editable geodata inspires and enables ● OpenStreetMap is good enough for professional use* ● Local communities required for up-to-date, HQ data ● Barrier to entry is a significant challenge for OpenStreetMap
- 41. Thank you Martijn van Exel m@rtijn.org
Editor's Notes
- WelcomeI would like to spend the next 30-40 minutes with you talking about OpenStreetMap:An OSM primer: what is it, how it came about.Some examples of how OSM is being usedSpecial considerations with regard to data qualityPractical OSM if there’s time left.
- OpenStreetMap is is a free editable map of the whole world. It is made by people like you.OpenStreetMap allows you to view, edit and use geographical data in a collaborative way from anywhere on Earth.OpenStreetMap is a prime example of VGI, Volunteered Geographic Information, a term devised by Michael Goodchild to capture the harnessing of tools to create, assemble, and disseminate geographic data provided voluntarily by individuals.Let’s break this brief explanation of OSM down a bit.
- Free does not only mean that you don’t have to pay to acquire the data, it also means that you can use it without many of the licensing restrictions that proprietary data sets are burdened with. Basically you can use it for anything you like, as long as you give proper credit to OpenStreetMap, and you share anything you create using OpenStreetMap under these same terms.
- It’s editable, which has enormous implications for the data and its uses. 450,000 people have signed up to contribute to OSM, although as we will see, not all of them are actively contributing data.The fact that anyone can go in and edit the data means that OSM is in a constant state of flux. The data you download today will not be the same as the data you download tomorrow. There is no guarantee that every single contribution actually improves the map. Contributors may inadvertently or purposefully vandalize the map. Let’s have a look at how OpenStreetMap editing works.
- The basic data model is extremely simple. There’s nodes, which are points with X and Y coordinates. A node can have an arbitrary amount of attributesWays are ordered sets of nodes interpreted as a line or an area. Ways can also have attributes in the form of key-value pairs.Relations are groups of ways and / or nodes that have a functional or geographical relationship. Examples of relation use is for multipolygons, but also bus routes and turn restrictions.
- Here’s an example of an OSM object, describing the University library. It has a unique ID, a timestamp telling us when it was last edited, the version number, the changeset number – a changeset is basically an editing session – and the user who last edited the object (me). Then the nodes out of which this way feature is built up. Note that no coordinates are stored in the way object itself.Lastly the tags, which are the attrributes. How do you know which to use?
- OpenStreetMap does not have real standards, it has conventions. The most common attributes are agreed upon using a voting system, the OpenStreetMap wiki and the mailing lists. Anyone can propose a new tag and have the community discuss it and vote on the proposal. There is nothing that will stop you from starting to use your own tags right away, though. You can map whatever you want, as long as it’s verifiable.
- Let’s look at the editors. There are many, also for mobile devices. I will discuss the most prominent ones here. The most visible editor is called Potlatch, and it’s available in the edit tab on the web site. It allows you to do all but the most complex editing tasks in a relatively user-friendly environment. There is also a sandbox mode that does not save your edits.
- JOSM is the full featured desktop OpenStreetMap editor. It has the editing and manipulation features of a modern desktop GIS.
- OSM was started in 2004 in the UK, out of frustration by a group of students unable to get a hold of good quality geospatial data. It has since spread all over the world. This movie shows the growth of OSM in 2008.What we see is that some areas, notably the US, see a sudden influx of data. This is because OSM is not only fed by individuals contributing local knowledge, but also by data imports. For the US, we have seen the TIGER line data import in early 2008. Look at that in detail.
- The fact that OpenStreetMap is free and editable has inspired people with very different backgrounds and interests to create very diverse things Let's look at a few examples
- This is taken from OpenCycleMap. It is a web site that highlights things that are interesting and important for cyclists: bike paths and lanes, repair and parts shops, signposted routes, trails.
- This is a topographic map style as seen on toposm.org. Here, OpenStreetMap is combined with several other map sources to create a nice looking general purpose map.
- Decidedly less useful but an interesting take on mapping are these city maps inspired by the 8-bit home computer graphics of the 1980. OpenStreetMap data was used to create these maps.
- OpenStreetMap is also keeping folks warm on these blankets that you can have custom made from softcities.
- OpenStreetMap can also be seen outdoors. Here's an example of a tourist information display in the Croatian town of Sinj (left), and an information display in a bus shelter in Kosice, Slovakia.
- An example of OpenStreetMap used in a print publication. Nike Grid was an urban game run by Nike in the UK in 2010 where the players earned points for completing runs in a grid consisting of postal code regions.Interestingly Nike used the OpenStreetMap-based maps without the required attribution. This was later added.
- OpenStreetMap also allows Kindle users to have maps on their devices. Because of the limited screen capabilities, a specialized cartography needed to be designed. OpenStreetMap offers the flexibility to do that.
- This is a routing web site. On the surface it looks like many you may have seen. This particular one however is aimed at wheelchair users. Wheelchair routing requires information on steps, curbs, inclines and other potential obstacles for wheelchair users. This information is not available in existing maps, so they added it themselves in OpenStreetMap and used OSM for calculating the wheelchair routes.
- OpenStreetMap can also be used to power navigation devices. In Russia, OpenStreetMap is the only map that provides door to door navigation in some areas.
- OpenStreetMap has one defining quality: it's warm geography. People sharing their knowledge about their own neighborhoods.
- First I plan to go into what motivates people in general - as defined in the classic Maslov hierarchy of human needs. The dimensions particularly interesting for OSM are a the ones higher up in the hierarchy: sense of belonging, esteem and self-actualization. I am not an expert on this so I'm just going to go into this briefly. I then plan to connect this to gaming and how playing (certain kinds of) games taps into these needs.
- Initial idea was about badges.Has drawbacks – people just in it for the badges,It should be about more that just quantitative achievements
- Introduce the topic.Gaming and qualityCreate tension – how could gaming help OSM?