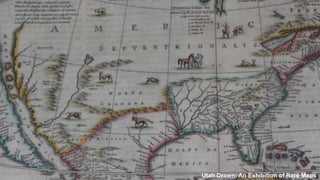
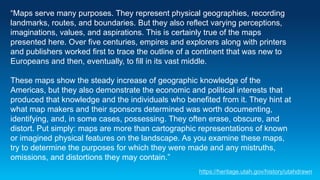
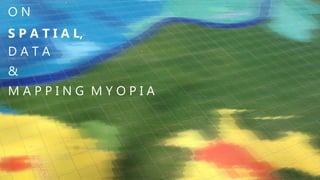
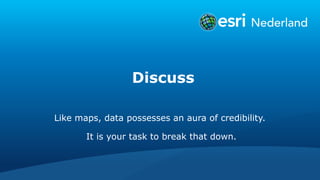
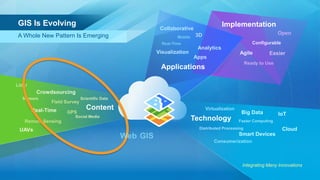
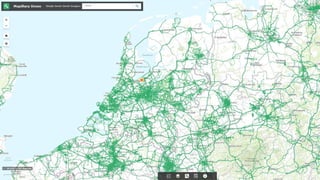
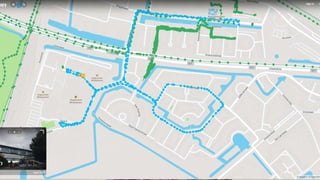
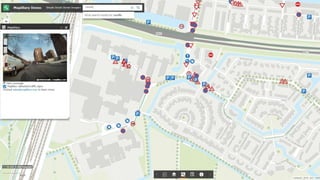
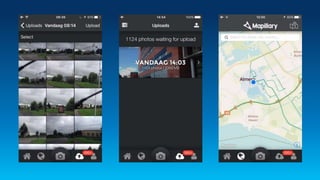
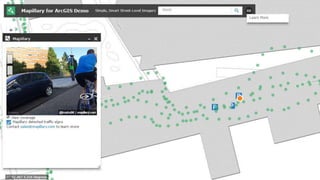
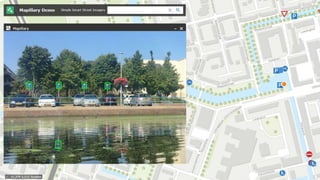
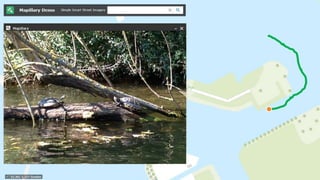
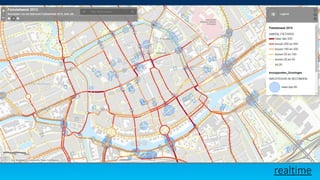
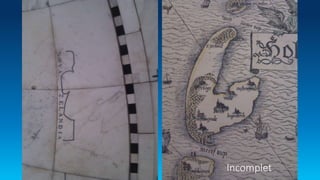
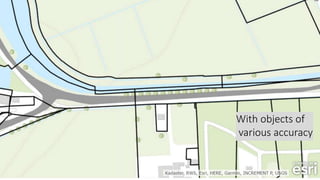
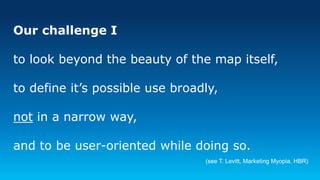
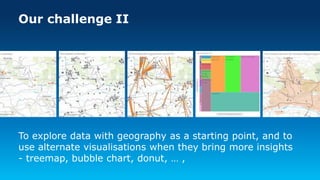
O N
S P A T I A L,
D A T A
&
M A P P I N G M Y O P I A
Geo-information Science, Wageningen U (geo)
Your questions?
Today’s goal: encourage critical geographic thinking
What is the correct map?
What is the meaning of these symbols?
My 2 second rule: get the
message of a map in 2
seconds, or start looking
for an error grammer in
SemiologyofGraphics,JacquesBertin
Utah Drawn: An Exhibition of Rare Maps
“Maps serve many purposes. They represent physical geographies, recording
landmarks, routes, and boundaries. But they also reflect varying perceptions,
imaginations, values, and aspirations. This is certainly true of the maps
presented here. Over five centuries, empires and explorers along with printers
and publishers worked first to trace the outline of a continent that was new to
Europeans and then, eventually, to fill in its vast middle.
These maps show the steady increase of geographic knowledge of the
Americas, but they also demonstrate the economic and political interests that
produced that knowledge and the individuals who benefited from it. They hint at
what map makers and their sponsors determined was worth documenting,
identifying, and, in some cases, possessing. They often erase, obscure, and
distort. Put simply: maps are more than cartographic representations of known
or imagined physical features on the landscape. As you examine these maps,
try to determine the purposes for which they were made and any mistruths,
omissions, and distortions they may contain.”
https://heritage.utah.gov/history/utahdrawn
O N
S P A T I A L,
D A T A
&
M A P P I N G M Y O P I A
III Reader
Week 1 (SDI concepts)
 1. “Spatial data infrastructure for Sustainable land management”
(background information)
 2. “Spatial data infrastructures as Complex Adaptive Systems”
(essential read)
My question
What is spatial?
What is not spatial?
Spatial?
Geographic Data Combine layers of data to gain
new insights
No zombies in Haiti?
Discuss
Like maps, data possesses an aura of credibility.
It is your task to break that down.
ON
S P A T I A L,
D A T A
&
M A P P I N G M Y O P I A
3D
Visualization
Analytics
Apps
Collaborative
Applications
Open
Configurable
Agile Easier
Ready to Use
Implementation
GPS
UAVs
Real-Time
Crowdsourcing
Sensors Scientific Data
Remote Sensing
Field Survey
Social Media
Content
Big Data
Cloud
Virtualization
IoT
Consumerization
Smart Devices
Technology
Integrating Many Innovations
A Whole New Pattern Is Emerging
GIS Is Evolving
Data is/was…
collected by experts
consciously
closed
static
structurecreated by software
subset of reality
send as input to an analytical process
on your computer
Ignoringthequantitativeview
Data is/becoming…
collected by a crowd
unconsciously
open
real-time
no-structurecreated by data
the analytical process is send to the data
closer to realitythink clusters and cloud
22Met dank aan: Kadaster, Rijkswaterstaat, Rotterdam,…
open
A picture of reality
Rotterdam Canvas Basislaag voor eigen informatie
A picture of reality
Philli
A picture of reality
By the crowd
realtime
1124, 8942, 1.755.410.209
Discuss
As data is increasingly real-time,
the atlas of our world is always alive.
ON
S P A T I A L,
D A T A
&
M A P P I N G M Y O P I A
Please remember
Great maps are beautiful, insightful, but they also may be…
Incomplet
With hard to define borders
With objects of
various accuracy
Outdated
This grid on our world
..diminishes, but it will always stay.
Discuss
The more we measure, the more we know.
Our challenge I
to look beyond the beauty of the map itself,
to define it’s possible use broadly,
not in a narrow way,
and to be user-oriented while doing so.
(see T. Levitt, Marketing Myopia, HBR)
Our challenge II
To explore data with geography as a starting point, and to
use alternate visualisations when they bring more insights
- treemap, bubble chart, donut, … ,
Discuss
What makes a map perfect?
Final Thoughts
Develop a t-shape profile
Do challenge the status quo
Get the science of meaningful maps
Recommended
Books & Papers
J Bertin, Sémiologie graphique, (in French, English)
Edward Tufte (www.edwardtufte.com) Beatifull Evidence (here)
Marketing Myopia, T. Levitt (here)
The Floating Sheep Manifesto (here)
MOOCs
Going Places with Spatial Analysis, starts april 12th! here
Critical thinking, e.g. Think Again series by Duke on Coursera, here
Introduction to Philosophy: God, Knowledge and Consciousness, by MIT on EdX, here
Do pm me if you are considering to include Big data / GeoAnalytics in your thesis
O N
S P A T I A L,
D A T A
&
M A P P I N G M Y O P I A
@jwvaneck
Geo-information Science, Wageningen University (geo)

On Spatial, Data and Mapping myopia

  • 1.
    O N S PA T I A L, D A T A & M A P P I N G M Y O P I A Geo-information Science, Wageningen U (geo)
  • 2.
    Your questions? Today’s goal:encourage critical geographic thinking
  • 3.
    What is thecorrect map?
  • 4.
    What is themeaning of these symbols?
  • 5.
    My 2 secondrule: get the message of a map in 2 seconds, or start looking for an error grammer in
  • 6.
  • 7.
    Utah Drawn: AnExhibition of Rare Maps
  • 8.
    “Maps serve manypurposes. They represent physical geographies, recording landmarks, routes, and boundaries. But they also reflect varying perceptions, imaginations, values, and aspirations. This is certainly true of the maps presented here. Over five centuries, empires and explorers along with printers and publishers worked first to trace the outline of a continent that was new to Europeans and then, eventually, to fill in its vast middle. These maps show the steady increase of geographic knowledge of the Americas, but they also demonstrate the economic and political interests that produced that knowledge and the individuals who benefited from it. They hint at what map makers and their sponsors determined was worth documenting, identifying, and, in some cases, possessing. They often erase, obscure, and distort. Put simply: maps are more than cartographic representations of known or imagined physical features on the landscape. As you examine these maps, try to determine the purposes for which they were made and any mistruths, omissions, and distortions they may contain.” https://heritage.utah.gov/history/utahdrawn
  • 9.
    O N S PA T I A L, D A T A & M A P P I N G M Y O P I A
  • 10.
    III Reader Week 1(SDI concepts)  1. “Spatial data infrastructure for Sustainable land management” (background information)  2. “Spatial data infrastructures as Complex Adaptive Systems” (essential read)
  • 11.
    My question What isspatial? What is not spatial?
  • 12.
  • 13.
    Geographic Data Combinelayers of data to gain new insights
  • 15.
  • 16.
    Discuss Like maps, datapossesses an aura of credibility. It is your task to break that down.
  • 17.
    ON S P AT I A L, D A T A & M A P P I N G M Y O P I A
  • 18.
    3D Visualization Analytics Apps Collaborative Applications Open Configurable Agile Easier Ready toUse Implementation GPS UAVs Real-Time Crowdsourcing Sensors Scientific Data Remote Sensing Field Survey Social Media Content Big Data Cloud Virtualization IoT Consumerization Smart Devices Technology Integrating Many Innovations A Whole New Pattern Is Emerging GIS Is Evolving
  • 20.
    Data is/was… collected byexperts consciously closed static structurecreated by software subset of reality send as input to an analytical process on your computer Ignoringthequantitativeview
  • 21.
    Data is/becoming… collected bya crowd unconsciously open real-time no-structurecreated by data the analytical process is send to the data closer to realitythink clusters and cloud
  • 22.
    22Met dank aan:Kadaster, Rijkswaterstaat, Rotterdam,… open
  • 23.
    A picture ofreality
  • 24.
    A picture ofreality
  • 25.
    A picture ofreality
  • 26.
    A picture ofreality
  • 27.
    Rotterdam Canvas Basislaagvoor eigen informatie A picture of reality
  • 28.
  • 29.
  • 38.
  • 43.
  • 44.
    Discuss As data isincreasingly real-time, the atlas of our world is always alive.
  • 45.
    ON S P AT I A L, D A T A & M A P P I N G M Y O P I A
  • 46.
    Please remember Great mapsare beautiful, insightful, but they also may be…
  • 47.
  • 48.
    With hard todefine borders
  • 49.
  • 50.
  • 51.
    This grid onour world
  • 52.
    ..diminishes, but itwill always stay.
  • 53.
    Discuss The more wemeasure, the more we know.
  • 54.
    Our challenge I tolook beyond the beauty of the map itself, to define it’s possible use broadly, not in a narrow way, and to be user-oriented while doing so. (see T. Levitt, Marketing Myopia, HBR)
  • 55.
    Our challenge II Toexplore data with geography as a starting point, and to use alternate visualisations when they bring more insights - treemap, bubble chart, donut, … ,
  • 58.
  • 59.
    Final Thoughts Develop at-shape profile Do challenge the status quo Get the science of meaningful maps
  • 60.
    Recommended Books & Papers JBertin, Sémiologie graphique, (in French, English) Edward Tufte (www.edwardtufte.com) Beatifull Evidence (here) Marketing Myopia, T. Levitt (here) The Floating Sheep Manifesto (here) MOOCs Going Places with Spatial Analysis, starts april 12th! here Critical thinking, e.g. Think Again series by Duke on Coursera, here Introduction to Philosophy: God, Knowledge and Consciousness, by MIT on EdX, here Do pm me if you are considering to include Big data / GeoAnalytics in your thesis
  • 61.
    O N S PA T I A L, D A T A & M A P P I N G M Y O P I A @jwvaneck Geo-information Science, Wageningen University (geo)

Editor's Notes

  • #2 Guest lecture at the end of this course
  • #3 Today’s mission. Make students think about spatial, data, and mapping myopia
  • #4 None, or both. The serve a different purpose.
  • #5 The symbols explained: large transitstations, important transitstation, end- and transitstations, misc stations. It just makes me wonder: why are large transitstations not important? What are ‘just’ stations?
  • #6 A typical violation of cartographic grammar.
  • #7 http://understandinggraphics.com/visualizations/information-display-tips/
  • #8 The problem with many olds maps: they really invite the reader to explore.
  • #9 Not shown in class, still a nice read.
  • #11 By now students should know what spatial data is about
  • #12 Challenge to give examples of non spatial data (pardon my bias).
  • #13 It this a spatial app?
  • #14 Still the most effective way to explain what GIS is about
  • #15 Still a great website to explain the limits of maps
  • #16 No zombies in Haiti? How can this be? Hardly any in Africa? There must be a mistake here.
  • #17 just an thought experiment if you will. A possible nice discussion in class.
  • #19 Content has become a big contributor to solutions in the Esri platform.
  • #20 GIS used to be a lot about data capture. The growth has brought us much more data. The relationship with people and software has changed. Many applications now are mostly data, and just a bit of software.
  • #21 Many aspects of data are changing. This picked out three here.
  • #23 Open data has allowed us to make new maps and serve many users with these maps
  • #24 We now can have many more ‘pictures of reality’. They synthesize into a better picture of the real world.
  • #29 http://www.arcgis.com/apps/CEWebViewer/viewer.html?3dWebScene=d749583752924e0e8c0312a6677fe075
  • #30 Data collection itself has opened up. Anyone can contribute to Mapillary. Organisations as well..
  • #35 Automatic recognition of symbols. Note the different tracks of the bikes.
  • #36 Automatic recognition of symbols. Note the one in the water.
  • #37 We actually mapped turtles that day in sunny Almere
  • #38 Mapilary next step
  • #39 What (near) realtime data contributes
  • #41 When data turns into BIG data II (not the slider on the bottom)
  • #42 Realtime NDW (vrijdag 18 maart 2016)
  • #43 Start a small project working with realtime data. Placemeter makes that real easy.
  • #44 We have been able to put together many new datasets. In 2016: for 1124 users, which downloaded 8942 datasets.
  • #45 We have to get used to the idea that maps portray moving data. Not static.
  • #46 Why myopia? We do not see objects far away sharply? We do lose a lot of insight if we only look from a far way?
  • #47 Our vision of the future of maps is blurry by definition. These factor don’t help either.
  • #48 Only one side of New Zeeland mapped.
  • #49 Typical questions of a topographer
  • #50 The parcelboundery and the waterboundery are very, very different.
  • #51 Watch out of outdated data
  • #52 Cartography designes a –regular- grid which is overlay on the world. Because of more data, realtime turning into big data, the grid is diminishing. There will be less hiding behind the grid. But it will always be there.
  • #54 A possible classroom exercise.
  • #55 The beauty of the maps is tempting. Like with marketing myopia, we are defining the use of maps often to narrow. We should look beyond the current bounderies of usage, and do so in a customer centric manner.
  • #56 My 2nd challenge: if we explore data, not all variables of the data are best presented just in a map.
  • #57 We should use more graphic representations. Easy experiment with what brings out our message in the strongest way.
  • #58 http://www.regiocanons.nl/overijssel/overijssel/een-perfecte-lantkaerte