Download as PDF, PPTX


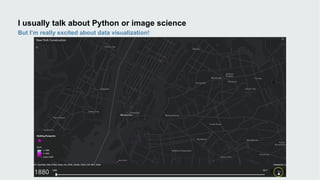
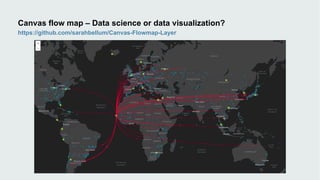
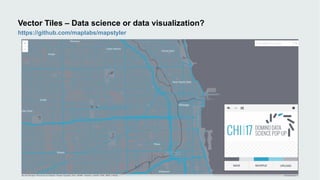
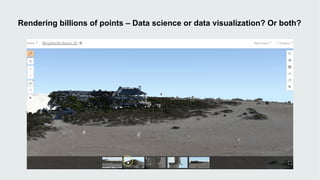
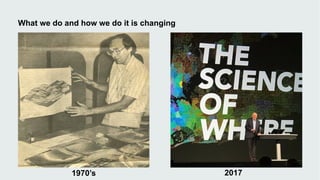


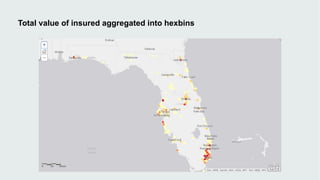


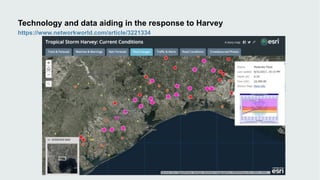
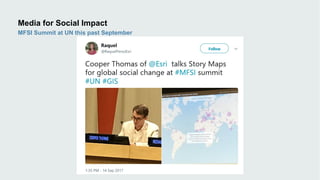
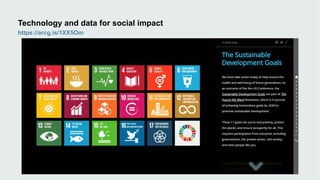

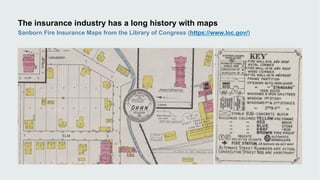
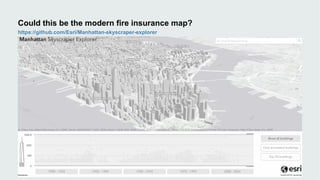
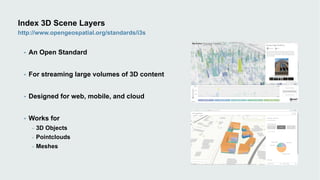
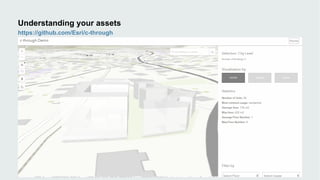

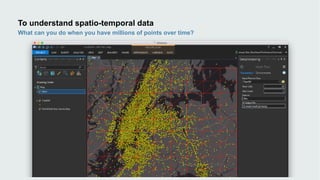
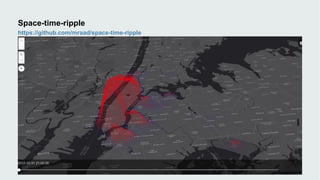
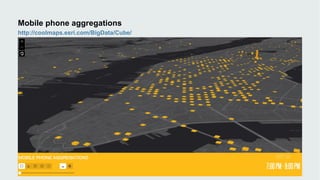
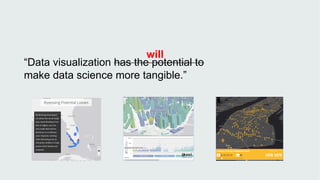


This document discusses how data visualization can make data science more tangible and accessible. It provides examples of using maps and interactive visualization to tell stories with data and simplify complex datasets. Visualization tools can turn raw data into insights by aggregating information over space and time. The document advocates using all dimensions of data, like integrating 3D models with spatiotemporal data, to better understand assets and dynamic systems.


![[EN] Maps and Digital Tools For Activists [RO] Hărți și instrumente digitale ...](https://cdn.slidesharecdn.com/ss_thumbnails/hriiinstrumentedigitalepentruactiviti-150817180833-lva1-app6892-thumbnail.jpg?width=640&height=640&fit=bounds)