Downloaded 476 times
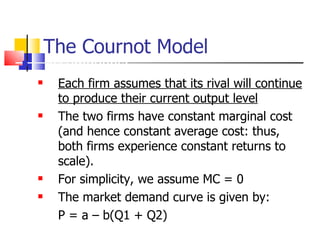

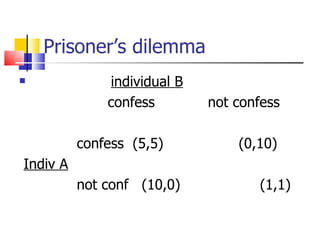
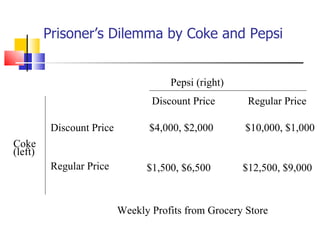
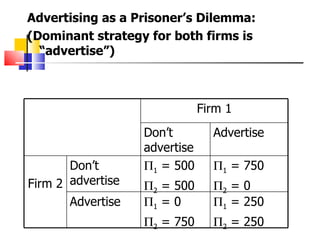
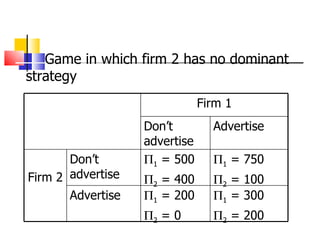
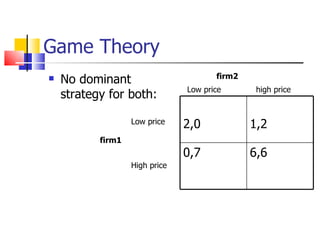
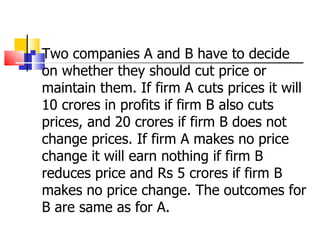

This document discusses various concepts related to oligopoly market structure including: 1) Oligopoly is characterized by few sellers that make interdependent decisions regarding price and output. Barriers to entry allow for potential economic profits in the long run. 2) Models of oligopoly include Cournot, Sweezy, and collusive models like cartels with price leadership. 3) Game theory can be used to analyze strategic interactions between oligopolists through concepts like the prisoner's dilemma, Nash equilibrium, and concentration measures.


![5G Explained! A High Level Overview [Introduction]](https://cdn.slidesharecdn.com/ss_thumbnails/5gexplainedahighleveloverview-260119165306-cc137a3e-thumbnail.jpg?width=640&height=640&fit=bounds)


