Download to read offline


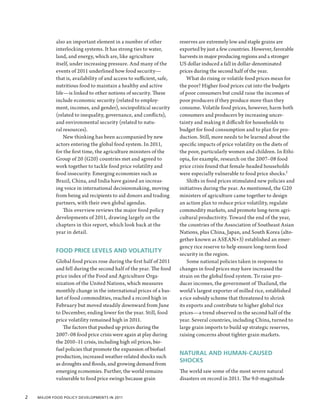


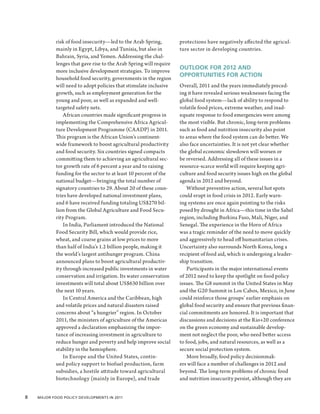


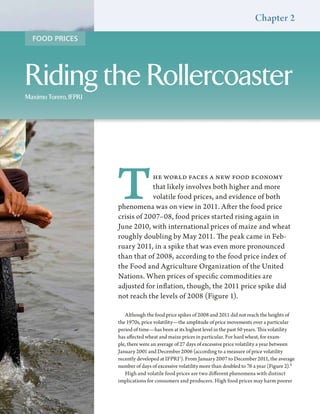


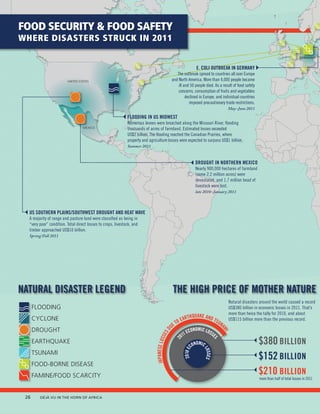


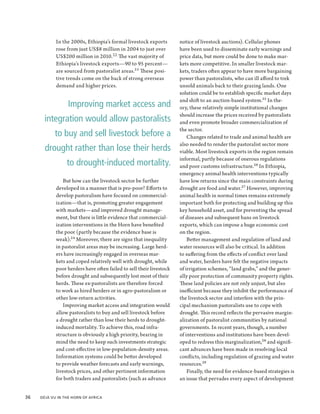


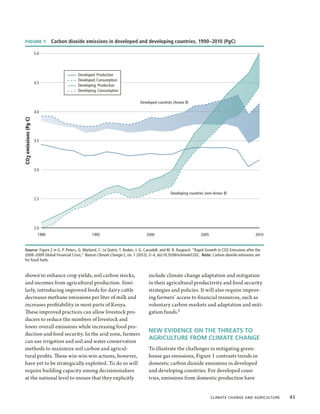


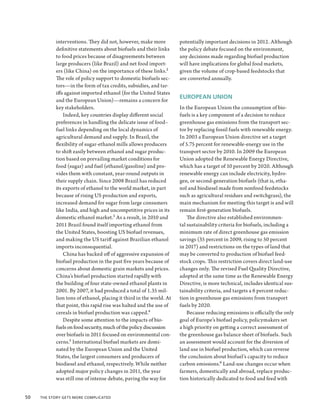


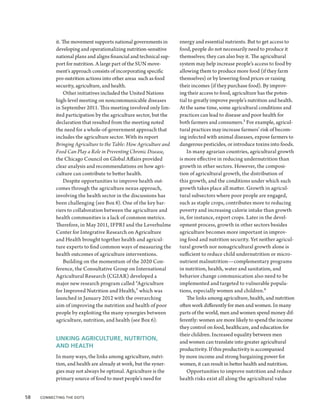


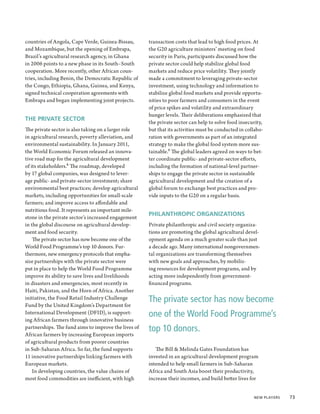
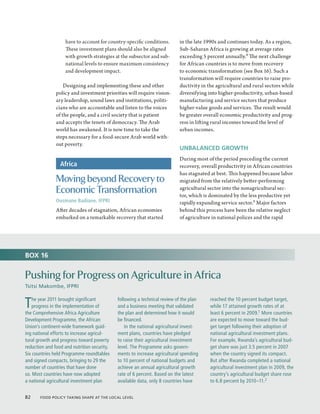
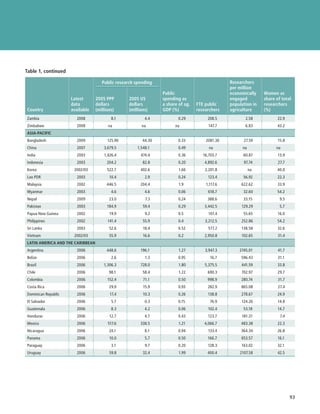
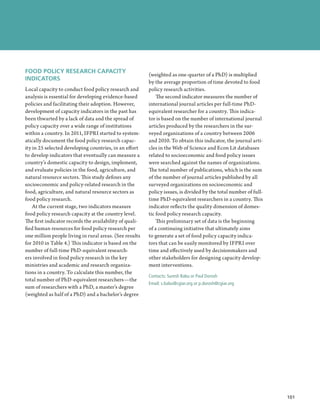
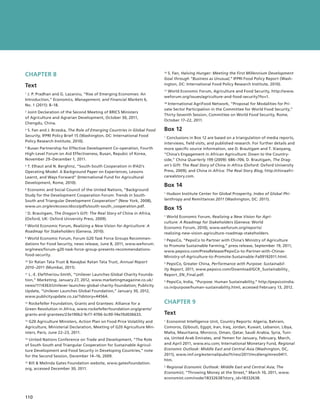
![East—have recently emerged as active partners in FIGURE 2 Aid from emerging economies,
technical and economic cooperation in develop- 2005–09
ing regions, especially Africa. Official development
assistance—or foreign aid—from the emerg- ■ ODA from Saudi Arabia,
Kuwait, and UAE
12
ing donors rose from US$4.6 billion in 2005 to ■ Foreign assistance from BRICS
US$10.4 billion in 2009 (Figure 2). These donors 10 ■ ODA from other non-OECD
DAC members
contributed about 10 percent of global aid flows 8
US $ Billion
in 2008.6
6
China is fast becoming a major investor in
Africa, although Chinese engagement in Afri- 4
can agriculture is both more diverse and smaller 2
than is generally perceived (see Box 12). In 2000, 0
China moved to consolidate this cooperation by 2005 2006 2007 2008 2009
establishing the Forum on China–Africa Coopera-
tion, which meets every three years. As part of this Source: Reproduced from K. Smith, Non-DAC Donors and Humanitar-
ian Aid: Shifting Structures, Changing Trends (Somerset, UK: Develop-
initiative, China has significantly boosted its aid ment Initiatives, Global Humanitarian Assistance, 2011). Notes: Aid
budget in recent years, with a stronger emphasis on data are for official development assistance (ODA). OECD is Organ-
isation for Economic Co-operation and Development; BRICS is Brazil,
agricultural development. Overall aid from China Russia, India, China, and South Africa; and DAC is Development Assis-
to Africa is estimated to have almost quadrupled tance Committee.
from US$684 million in 2001 to US$2,476 million
in 2009.7 At the 2010 United Nations High-Level 5,000 agricultural personnel from these countries
Meeting on the Millennium Development Goals, to China for training. By 2011, China had already
China pledged to establish 30 demonstration cen- established 14 centers for agricultural research in a
ters for agricultural technologies in other develop- number of African countries.
ing countries, dispatch 3,000 agricultural experts India is also bolstering its cooperation with
and technicians to these countries, and invite Africa. For example, the Africa–India Forum
for at least three years. During this time, in Tanzania, tobacco in Zimbabwe, and communities, and large Chinese farms
Chinese experts will demonstrate how the nonspecific crops in Zambia, Ethiopia, are no exception. However, surprisingly
centers can develop income-generation Guinea, Benin, the Democratic Republic of little evidence exists for the common
activities to boost sustainability (while the Congo, and Cameroon. assumption that the Chinese plan to
also looking for new business opportuni- As of yet, few of the existing Chinese use African land for China’s own food
ties for their institutes and firms). investments in Africa appear to be larger security. China imports no grain from
In another experiment, Chinese com- than 5,000 hectares. Several larger Africa—instead, cotton, sesame seeds,
panies began to lease some of the old Chinese biofuel projects proposed in and tobacco head the list. Chinese
Chinese aid projects in the 1990s, as they Zambia (jatropha), Ethiopia (sugarcane), agroprocessing companies have con-
were privatized: Sukula sugar complex in and the Democratic Republic of Congo tractual partnerships with local small-
Mali, Magbass in Sierra Leone, and Koba (maize) have stalled or been abandoned. holders who grow cotton (in Malawi,
in Guinea, for instance. In 2004, China’s As a Chinese official commented in Mozambique, and Zambia) and tobacco
Ministry of Commerce started to encour- Tanzania: “Agriculture is risky. It is hard to (in Zimbabwe). The majority of Chinese
age country-specific opportunities for have [a] ‘win–win.’” farms appear to produce food for local
Chinese agricultural investment: cotton Land transfers frequently pres- markets. The evidence, at least for now,
in Egypt, fruit and nuts in Nigeria, sisal ent food security risks for local does not support the rumors.1
New Players 71](https://image.slidesharecdn.com/oc72-120424053736-phpapp01/85/Oc72-82-320.jpg)


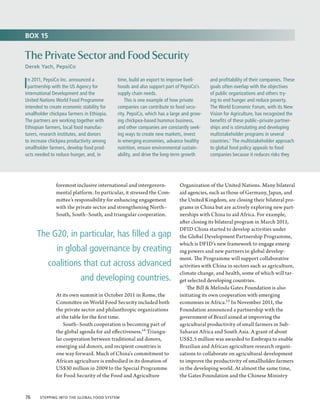


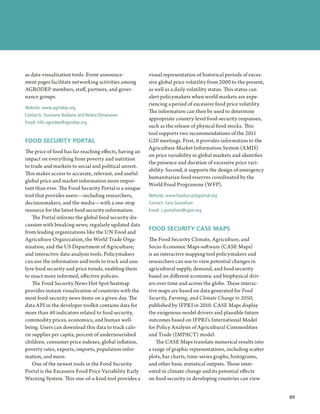

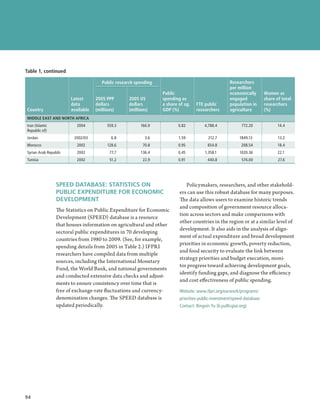
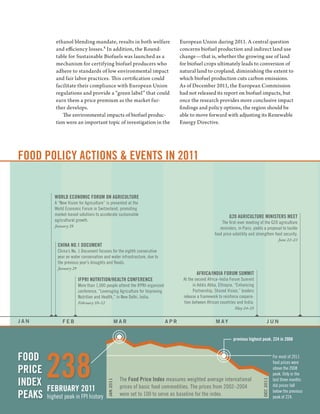
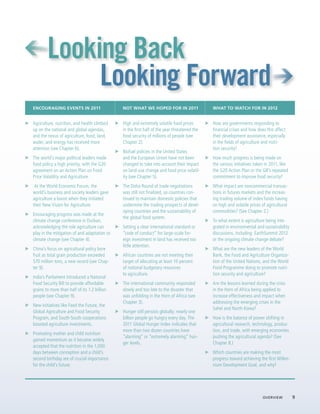
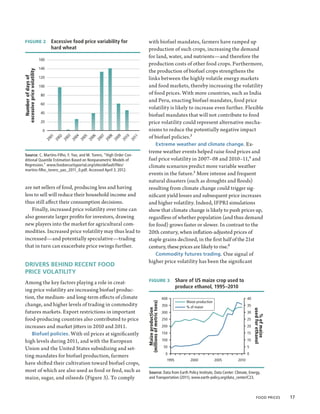
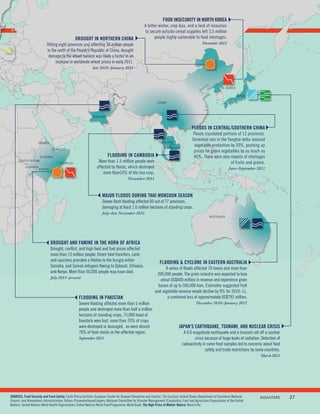
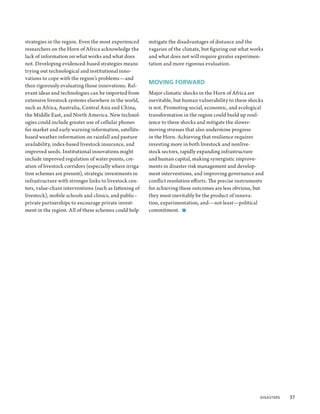
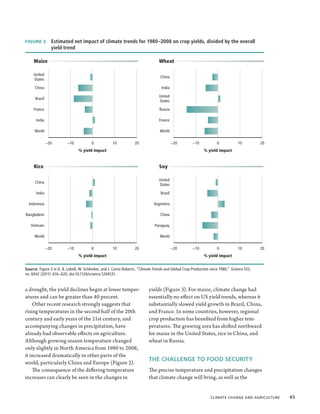
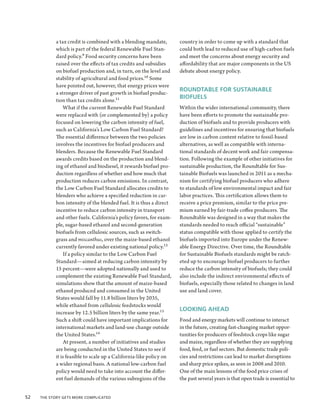
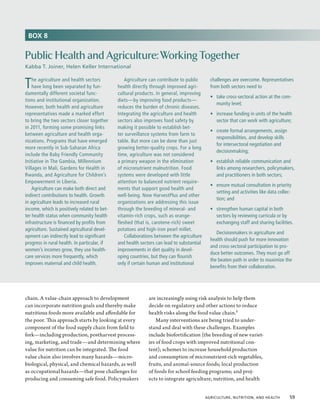
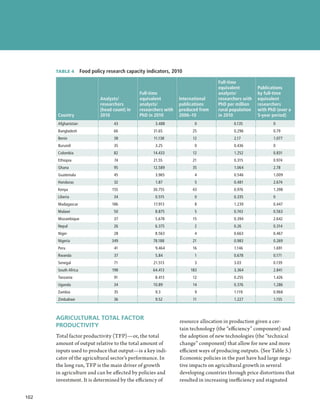
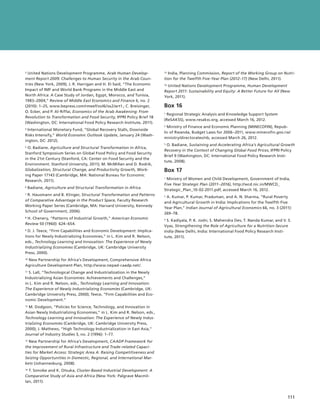
![TABLE 2 Agricultural public expenditure for economic development, by country
Per capita agricultural
Agricultural expenditure of total
Agricultural expenditure, 2005 population, 2005 Ratio of agricultural
expenditure, 2005 US international dollars international dollars expenditure to
dollars (billions) (billions) (billions) agricultural GDP (%)
Country 1980 1995 2009 1980 1995 2009 1980 1995 2009 1980 1995 2009
EAST ASIA AND PACIFIC
China 7.14 8.87 68.6 17.20 21.37 165.17 17.1 17.2 121.0 10.9 4.5 19.1
Fiji 0.03 0.03 0.03 [1] 0.04 0.03 0.03 [1] 65.9 43.3 39.6 [1] 8.4 5.8 6.5 [1]
Indonesia 1.80 1.80 1.56 [1] 4.44 4.43 3.86 [1] 29.4 22.2 16.6 [1] 9.3 4.8 3.5 [1]
Malaysia 0.75 0.97 2.32 1.68 2.16 5.17 121.5 104.4 185.0 10.8 8.7 15.2
Mongolia 0.01 0.05 [1] 0.02 0.15 [1] 8.8 57.8 [1] 1.4 8.8 [1]
Myanmar 19.26 12.39 18.30 [1] 0.44 0.29 0.42 [1] 13.5 6.8 9.0 [1] 8.0 2.7 1.6 [1]
Papua New 0.08 0.05 0.02 [1] 0.19 0.12 0.06 [1] 57.6 25.4 8.9 [1] 8.3 3.1 1.2 [1]
Guinea
Philippines 0.43 0.86 1.14 1.08 2.16 2.89 22.8 31.2 31.5 3.2 5.7 7.2
Thailand 0.76 2.14 2.02 1.92 5.42 5.11 40.4 90.8 74.4 7.8 16.8 9.0
Vanuatu 0.001 0.003 0.003 [1] 0.003 0.01 0.01 [1] 23.0 31.5 25.3 [1] 4.4 5.5 3.2 [1]
Vietnam 0.33 0.71 1.12 2.38 15.1 27.4 4.6 4.7
EUROPE AND CENTRAL ASIA
Azerbaijan 0.08 0.19 [1] 0.27 0.61 [1] 34.4 69.6 [1] 6.2 12.5 [1]
Belarus 0.13 1.13 0.36 3.12 34.7 323.5 4.8 30.2
Bulgaria 0.02 0.14 0.04 0.37 5.0 48.6 0.5 8.8
Georgia 0.03 0.07 17.0 3.9
Kazakhstan 0.11 0.64 0.25 1.47 15.4 92.9 2.6 14.3
Kyrgyz 0.02 0.02 [1] 0.05 0.06 [1] 12.0 11.2 [1] 2.2 1.9 [1]
Republic
Latvia 0.06 0.43 0.10 0.81 41.6 357.3 7.3 83.7
Lithuania 0.28 0.34 0.51 0.62 140.8 187.0 17.7 36.6
Moldova 0.01 0.06 0.03 0.16 7.8 43.9 1.5 16.7
Romania 2.41 1.95 1.45 [1] 5.00 4.06 3.02 [1] 225.2 178.9 139.7 [1] 12.3 11.4 14.5 [1]
Russia 0.22 1.94 0.48 4.32 3.2 30.2 0.6 4.6
Turkey 0.54 0.58 2.98 [1] 0.90 0.97 4.99 [1] 20.3 16.4 71.2 [1] 0.2 1.1 6.3 [1]
Ukraine 0.54 1.64 35.8 7.5
Notes: [1] Data are from 2007. [2] Data are from 2008. [3] Data are from 2004.
95
](https://image.slidesharecdn.com/oc72-120424053736-phpapp01/85/Oc72-106-320.jpg)
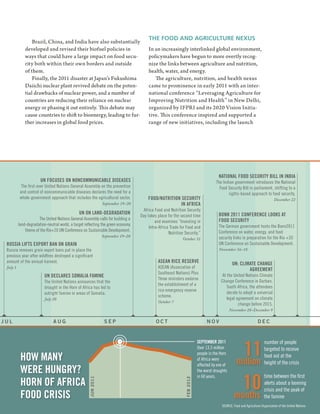
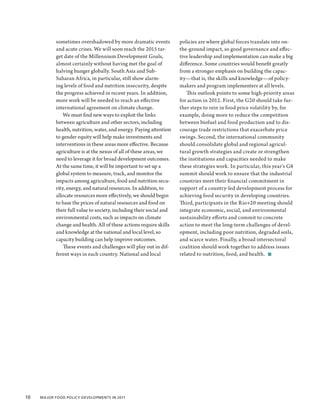
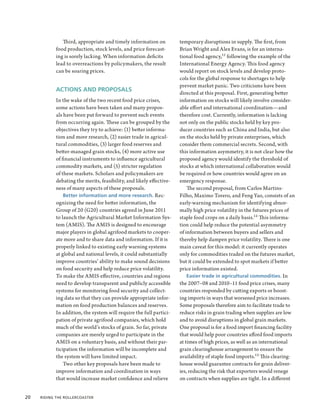
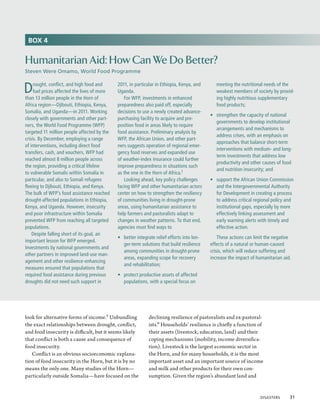
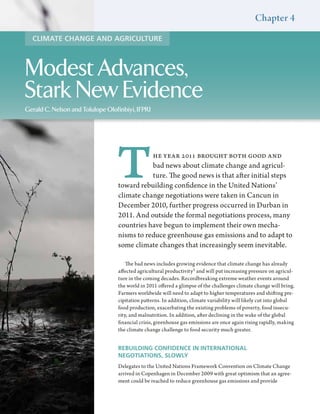
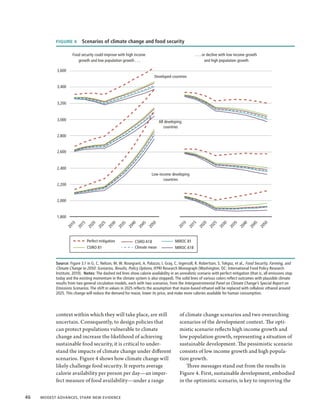
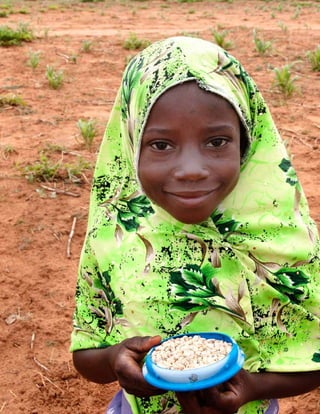
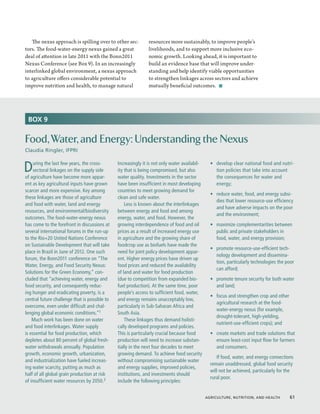
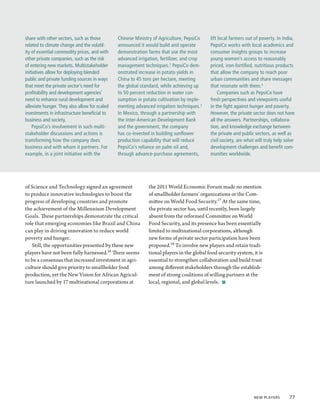
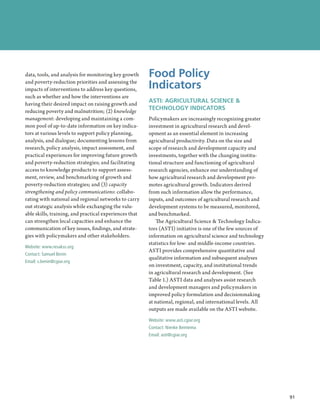
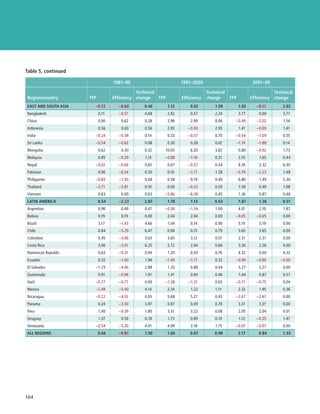
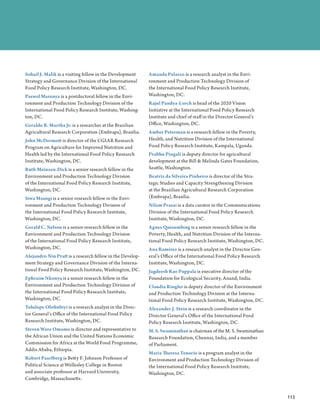
![Table 2, continued
Per capita agricultural
Agricultural expenditure of total
Agricultural expenditure, 2005 population, 2005 Ratio of agricultural
expenditure, 2005 US international dollars international dollars expenditure to
dollars (billions) (billions) (billions) agricultural GDP (%)
Country 1980 1995 2009 1980 1995 2009 1980 1995 2009 1980 1995 2009
LATIN AMERICA AND THE CARIBBEAN
Argentina 0.00 0.14 0.11 [1] 0.00 0.32 0.25 [1] 0.003 9.2 6.4 [1] 1.7 0.6 [1]
Bolivia 0.01 0.003 0.03 [1] 0.03 0.01 0.11 [1] 5.1 1.6 11.7 [1] 0.3 2.2 [1]
Brazil 2.98 0.61 [1] 5.18 1.06 [1] 32.0 5.6 [1] 7.4 1.1 [1]
Chile 0.18 0.17 0.41 [2] 0.30 0.28 0.68 [2] 26.6 19.6 40.5 [2] 6.8 2.3 8.4 [2]
Costa Rica 0.06 0.04 0.19 0.13 0.08 0.37 53.9 22.1 79.7 4.7 2.2 10.8
Dominican 0.30 0.19 0.13 [1] 0.53 0.33 0.23 [1] 90.8 41.6 24.3 [1] 12.1 9.4 5.0 [1]
Republic
El Salvador 0.03 0.03 0.01 0.50 0.53 0.10 107.6 92.4 16.5 13.4 13.9 2.3
Guatemala 0.14 0.05 0.06 0.26 0.09 0.12 37.0 8.9 8.7 3.8 1.3 1.6
Jamaica 0.08 0.10 0.13 0.16 51.6 58.6 7.3 14.2
Mexico 8.58 3.17 4.39 [1] 13.17 4.87 6.75 [1] 191.5 52.8 61.8 [1] 20.2 9.4 13.3 [1]
Panama 0.11 0.03 0.12 [1] 0.22 0.06 0.23 [1] 110.3 22.9 69.9 [1] 18.2 3.6 9.3 [1]
St. Vincent and 0.002 0.004 0.003 [1] 0.004 0.01 0.01 [1] 37.7 60.2 51.2 [1] 6.3 7.1 7.9 [1]
the Grenadines
Uruguay 0.04 0.04 0.06 [1] 0.07 0.08 0.11 [1] 23.2 25.6 34.0 [1] 1.6 3.5 3.0 [1]
MIDDLE EAST AND NORTH AFRICA
Algeria 0.53 1.23 1.21 2.84 42.8 81.4 7.2 9.6
Egypt 0.66 0.90 0.87 [1] 2.39 3.25 3.15 [1] 53.1 52.4 40.9 [1] 12.0 8.8 5.8 [1]
Iran 0.97 1.07 0.78 3.27 3.59 2.62 84.7 60.1 35.8 7.1 4.9 3.4
Jordan 0.02 0.11 0.05 [2] 0.03 0.19 0.08 [2] 14.3 44.5 13.7 [2] 5.0 32.4 11.0 [2]
Lebanon 0.02 0.02 [2] 0.04 0.03 [2] 11.6 8.4 [2] 1.8 1.1 [2]
Morocco 0.54 0.54 0.40 [1] 0.98 0.97 0.72 [1] 50.0 36.0 23.3 [1] 11.5 9.1 4.4 [1]
Syria 1.26 2.40 2.02 0.72 1.37 1.15 80.3 96.4 57.4 8.1 8.1 5.3
Tunisia 0.53 0.45 0.52 1.15 0.97 1.13 177.6 108.0 109.4 28.4 17.3 15.1
Yemen 0.02 0.04 0.07 [1] 0.05 0.10 0.20 [1] 5.7 6.9 9.1 [1] 1.7 2.4 [1]
SOUTH ASIA
Bangladesh 0.18 0.24 0.85 0.51 0.68 2.42 6.3 5.8 16.5 2.9 2.6 6.2
Bhutan 0.01 0.03 0.04 0.03 0.09 0.12 72.0 170.2 168.3 17.0 21.6 21.3
India 1.82 3.50 13.07 5.47 10.51 39.21 7.8 10.9 32.5 2.5 2.9 6.4
Maldives 0.003 0.02 0.005 0.01 0.04 0.01 33.3 141.6 25.2 0.1 0.8 0.3
Nepal 0.06 0.09 0.14 0.20 0.28 0.43 13.3 12.8 14.5 3.8 3.8 4.1
Pakistan 0.12 0.08 1.07 0.37 0.24 3.35 4.6 1.9 19.6 1.3 0.4 3.8
Sri Lanka 0.16 0.24 0.40 [2] 0.46 0.70 1.14 [2] 30.8 38.2 55.7 [2] 7.4 6.7 10.0 [2]
96 ](https://image.slidesharecdn.com/oc72-120424053736-phpapp01/85/Oc72-107-320.jpg)
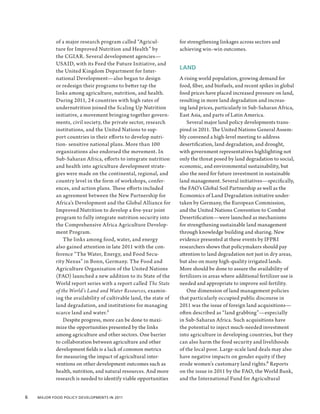
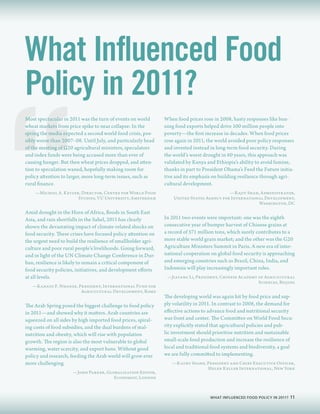
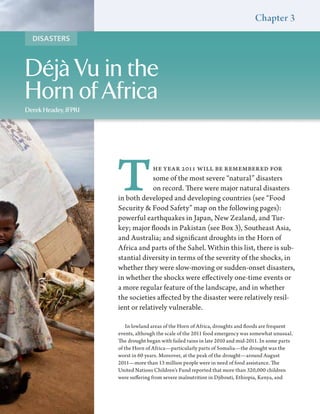
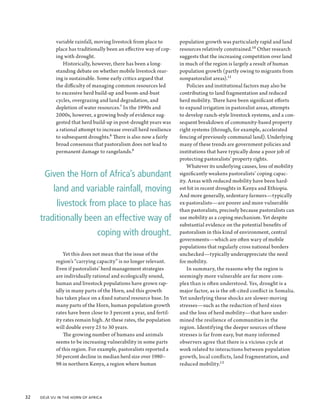
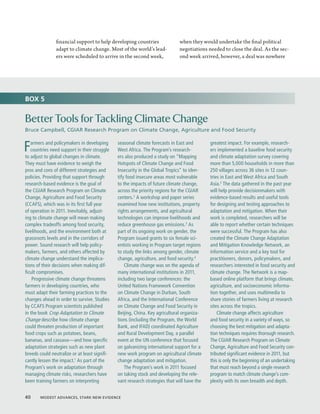
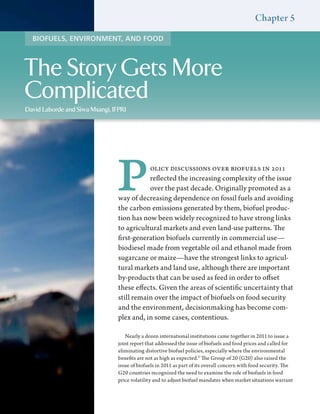
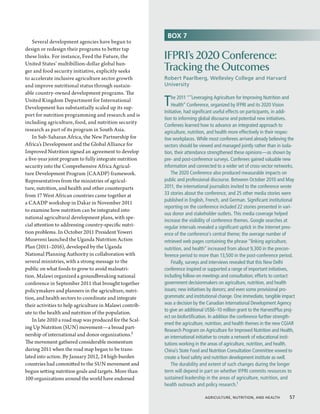
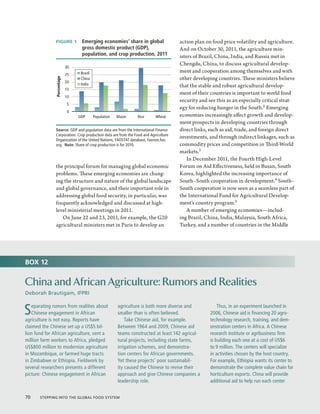
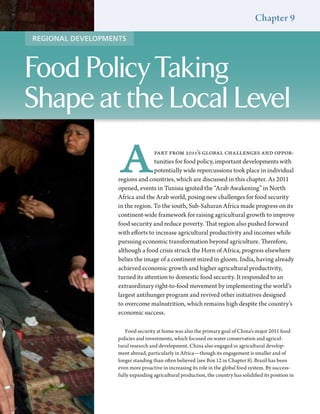
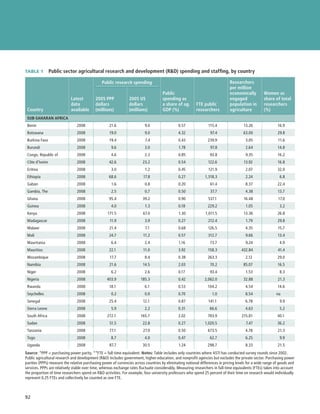
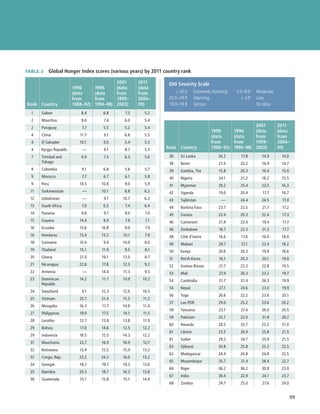
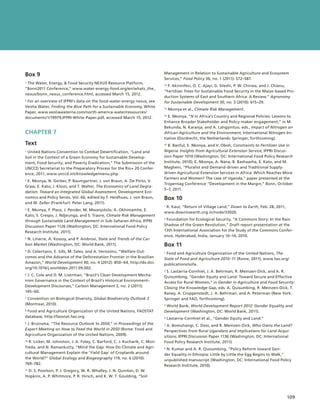
![Table 2, continued
Per capita agricultural
Agricultural expenditure of total
Agricultural expenditure, 2005 population, 2005 Ratio of agricultural
expenditure, 2005 US international dollars international dollars expenditure to
dollars (billions) (billions) (billions) agricultural GDP (%)
Country 1980 1995 2009 1980 1995 2009 1980 1995 2009 1980 1995 2009
SUB-SAHARAN AFRICA
Botswana 0.05 0.12 0.10 [1] 0.11 0.25 0.22 [1] 106.8 159.8 115.8 [1] 21.6 49.1 44.2 [1]
Cape Verde 0.002 0.02 0.002 0.02 6.2 44.3 2.5 14.6
Ethiopia 0.05 0.12 0.45 [1] 0.20 0.45 1.70 [1] 5.5 7.8 21.9 [1] 1.5 4.0 6.4 [1]
Ghana 0.06 0.02 0.01 [1] 0.13 0.04 0.03 [1] 12.0 2.3 1.3 [1] 0.1 0.6 0.4 [1]
Kenya 0.18 0.27 0.23 0.47 0.70 0.60 28.8 25.6 15.1 6.4 6.3 4.5
Lesotho 0.01 0.07 0.03 [2] 0.03 0.12 0.06 [2] 20.5 69.3 26.3 [2] 11.3 32.4 25.5 [2]
Liberia 0.02 0.01 0.000 [2] 0.05 0.02 0.000 [2] 25.9 9.1 0.05 [2] 3.9 10.7 0.02 [2]
Malawi 0.05 0.05 0.03 [1] 0.15 0.16 0.08 [1] 24.1 16.1 6.2 [1] 8.1 8.5 2.8 [1]
Mauritius 0.03 0.05 0.07 0.07 0.10 0.14 69.6 87.7 110.5 14.2 11.7 22.2
Namibia 0.10 0.11 [1] 0.15 0.16 [1] 92.1 72.4 [1] 17.7 13.7 [1]
Nigeria 0.53 0.14 0.23 [1] 1.16 0.31 0.51 [1] 15.3 2.8 3.5 [1] 1.8 0.4 0.5 [1]
Niger 0.03 0.04 0.07 0.08 7.6 5.5 2.9 3.0 2.3
Seychelles 0.01 0.002 [2] 0.01 0.004 [2] 152.2 44.0 [2] 25.0 10.7 [2]
South Africa 1.13 2.07 1.84 3.38 44.4 67.9 16.2 24.6
Swaziland 0.03 0.02 0.06 [1] 0.05 0.04 0.12 [1] 82.0 43.5 104.4 [1] 16.8 10.1 30.4 [1]
Uganda 0.003 0.01 0.08 0.01 0.03 0.23 0.7 1.3 7.1 0.6 0.4 2.2
Zambia 0.39 0.03 0.18 [1] 0.73 0.06 0.32 [1] 126.1 7.0 26.9 [1] 55.5 3.7 10.0 [1]
Zimbabwe 0.21 0.26 0.33 [1] 0.14 0.17 0.22 [1] 19.8 14.8 18.0 [1] 13.5 10.3 12.5 [3]
HIGH-INCOME OECD COUNTRIES
Australia 1.53 1.86 1.72 1.44 1.74 1.61 97.6 96.1 73.6 6.2 10.9 9.5
Canada 2.61 2.16 2.99 2.63 2.18 1.55 107.3 74.4 46.1 10.7 9.1 15.1
Czech Republic 0.49 1.99 0.82 3.34 79.5 319.6 10.2 60.6
Estonia 0.003 0.01 0.004 0.01 2.9 7.3 0.7 1.7
Finland 1.96 2.15 1.33 2.44 2.67 1.66 510.8 523.4 311.0 30.4 54.4 38.3
Greece 1.31 0.98 0.07 2.33 1.75 0.13 242.0 163.9 11.2 9.3 11.2 0.8
Hungary 3.38 1.27 2.57 5.24 1.97 3.99 489.7 191.0 398.5 22.6 20.4 70.0
Iceland 0.24 0.19 0.22 0.16 0.12 0.14 682.3 449.2 432.9 24.6 15.9 17.5
Ireland 1.51 0.83 0.76 1.88 1.03 0.95 549.4 286.5 474.5 37.8 18.9 58.7
Italy 0.002 0.10 1.38 0.002 0.14 1.91 0.04 2.5 31.7 0.001 0.3 6.5
Israel 0.71 0.61 0.22 [1] 0.86 0.74 0.27 [1] 230.9 138.6 38.4 [1] 17.8 12.9 3.7 [1]
Japan 16.09 10.52 15.90 13.68 8.95 13.52 118.0 71.9 106.8 17.3 13.6 25.8
Korea, Rep. 1.54 8.57 11.36 2.00 11.13 14.75 53.4 249.2 307.6 5.8 24.9 41.0
Luxembourg 0.07 0.07 0.11 0.09 0.09 0.13 255.7 217.7 263.8 49.0 47.2 135.3
New Zealand 1.18 0.27 0.49 1.12 0.26 0.46 354.3 70.8 106.4 19.5 4.6 7.6
Norway 3.85 3.24 2.10 2.79 2.35 1.52 682.0 538.1 314.9 64.0 46.3 50.9
Poland 1.05 2.94 1.78 5.02 46.4 131.1 6.5 21.6
97
](https://image.slidesharecdn.com/oc72-120424053736-phpapp01/85/Oc72-108-320.jpg)
![Table 2, continued
Per capita agricultural
Agricultural expenditure of total
Agricultural expenditure, 2005 population, 2005 Ratio of agricultural
expenditure, 2005 US international dollars international dollars expenditure to
dollars (billions) (billions) (billions) agricultural GDP (%)
Country 1980 1995 2009 1980 1995 2009 1980 1995 2009 1980 1995 2009
Portugal 0.81 0.44 1.44 0.78 142.0 73.3 15.8 14.6
Slovenia 0.11 0.17 0.23 0.36 117.4 176.2 16.7 27.6
Spain 1.98 0.27 0.82 3.08 0.42 1.28 82.1 10.7 28.0 7.8 1.2 4.2
Sweden 2.28 1.18 0.81 1.81 0.94 0.64 217.8 106.2 68.7 22.8 14.4 11.9
Switzerland 2.29 3.12 2.52 [2] 1.69 2.30 1.85 [2] 267.4 327.3 244.4 [2] 26.1 47.3 47.6 [2]
United 5.41 1.49 3.67 4.96 1.37 3.36 87.8 23.5 54.3 21.5 4.9 22.9
Kingdom
United States 16.25 11.89 20.11 16.25 11.89 20.11 70.7 44.6 65.4 10.9 8.2 16.0
HIGH-INCOME NON-OECD COUNTRIES
Bahamas 0.01 0.01 0.01 0.01 0.02 0.02 55.2 66.7 50.5 12.0 10.9 13.4
Bahrain 0.01 0.01 0.01 [2] 0.02 0.02 0.02 [2] 45.4 39.7 22.8 [2] 16.7 16.2 9.5 [2]
Croatia 0.13 0.62 0.21 0.95 43.9 214.8 6.0 24.2
Cyprus 0.15 0.12 0.10 0.27 0.21 0.19 398.7 240.1 171.3 47.8 29.6 43.8
Kuwait 0.01 0.12 0.13 0.02 0.18 0.19 11.0 109.6 71.7 13.0 61.6 33.0
Malta 0.02 0.01 0.04 0.04 0.03 0.07 109.8 77.1 175.0 31.2 17.6 46.9
Oman 0.05 0.13 0.06 0.10 0.24 0.12 [1] 81.2 109.7 47.5 [1] 28.0 20.7 9.6 [1]
Singapore 0.02 0.03 0.04 [1] 0.03 0.04 0.06 12.6 12.1 11.1 5.3 19.3 24.4
United Arab 0.06 0.05 0.05 0.09 0.08 0.08 86.0 34.4 11.8 2.3 3.4 2.6
Emirates
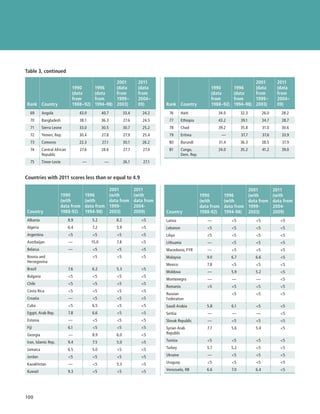
GLOBAL HUNGER INDEX
scores took place in Angola, Bangladesh, Ethio-
Each year, IFPRI calculates the Global Hunger pia, Mozambique, Nicaragua, Niger, and Viet-
Index (GHI), which is designed to comprehen- nam. Hunger worsened, however, in the Burundi,
sively measure and track hunger globally and by Comoros, Côte d’Ivoire, the Democratic Republic
country and region. To reflect the multidimen- of Congo, North Korea, and Swaziland.
sional nature of hunger, the GHI combines three By highlighting successes and failures in hunger
equally weighted indicators into one index num- reduction and providing insights into the drivers
ber: (1) the percentage of people who are under- of hunger, the GHI points to the geographic areas
nourished; (2) the percentage of children younger where policy action is most needed and suggests
than age five who are underweight; and (3) the where policy lessons can be learned.
mortality rate of children younger than age five.
Website: www.ifpri.org/publication/2011-global-hunger-index
According to the 2011 GHI, global hunger has
Contacts: Klaus von Grebmer or Tolulope Olofinbiyi
fallen slowly in the past two decades. (See specific
Email: k.vongrebmer@cgiar.org or t.olofinbiyi@cgiar.org
country scores for 2011 in Table 3.) From 1990
to 2011, the greatest improvements in absolute
98 ](https://image.slidesharecdn.com/oc72-120424053736-phpapp01/85/Oc72-109-320.jpg)

![NOTES
CHAPTER 1 indicate a period of excessive volatility. Periods of excessive volatil-
ity are identified based on a statistical test applied to the number of
Text times the extreme value occurs in a window of 60 consecutive days.
3 P. Al-Riffai, B. Dimaranan, and D. Laborde, “Global Trade and Envi-
N. Kumar and A. R. Quisumbing, Gendered Impacts of the 2007–08
1
ronmental Impact Study of the EU Biofuels Mandate,” report on a
Food Price Crisis: Evidence Using Panel Data from Rural Ethiopia, IFPRI
study carried out by the International Food Policy Research Insti-
Discussion Paper No. 1093 (Washington, DC: International Food Policy
tute (IFPRI) for the Directorate General on Trade of the European
Research Institute, 2011).
Commission (Brussels, 2010), mimeo; P. Al-Riffai, B. Dimaranan, and
2 Centre for Research on the Epidemiology of Disasters (CRED), Catho- D. Laborde, “European Union and United States Biofuel Mandates:
lic University of Louvain (Belgium), EM-DAT: The International Disas- Impacts on World Markets,” Technical Notes No. IDB-TN-191 (Wash-
ter Database, www.emdat.be/database. ington, DC: Inter-American Development Bank, 2010); D. Laborde,
3 Munich Re, “Review of Natural Catastrophes in 2011: Earthquakes Assessing the Land Use Changes Consequences of European Biofuel
Result in Record Loss Year,” press release, January 4, 2012. Policies and Its Uncertainties, ATLASS research report for the Direc-
4 H. De Gorter and D. Just, “The Economics of Blend Mandates for torate General on Trade of the European Commission (Brussels, 2011).
4 Organisation for Economic Co-operation and Development, Rising
Biofuels,” American Journal of Agricultural Economics 91, no. 3
(2009): 738–750. Food Prices: Causes and Consequences, OECD Policy Report (Paris,
2008), www.oecd.org/dataoecd/54/42/40847088.pdf; J. von Braun,
Food and Agriculture Organization of the United Nations, The State
5
Rising Food Prices: What Should Be Done? IFPRI Policy Brief (Wash-
of the World’s Land and Water Resources: Managing Systems at Risk
ington, DC: International Food Policy Research Institute, 2008); US
(Rome and London: FAO and Earthscan, 2011).
Department of Agriculture, World Agricultural Outlook Board, World
6 J. Behrman, R. Meinzen-Dick, and A. Quisumbing, “The Gender
Agricultural Supply and Demand Estimates, WASDE-460 (Washington,
Implications of Large-Scale Land Deals,” Journal of Peasant Studies DC, 2008); D. Headey and S. Fan, Reflections on the Global Food Cri-
39, no. 1 (2012): 49–79. sis: How Did It Happen? How Has It Hurt? And How Can We Prevent
7 High Level Panel of Experts on Food Security and Nutrition of the the Next One? Research Monograph 165 (Washington, DC: Interna-
Committee on World Food Security, Land Tenure and International tional Food Policy Research Institute, 2010); HM Government, The
Investments in Agriculture (Rome: 2011); Food and Agriculture Orga- 2007/08 Agricultural Price Spikes: Causes and Policy Implications (Lon-
nization of the United Nations, “FAO Head Warns on Land-Grabbing: don: Department for Environment, Food and Rural Affairs, 2010).
Foreign Investment as Tool for Development,” press release, May 5 R. H. Kripalani, J. H. Oh, A. Kulkarni, S. S. Sabered, and H. S. Chaud-
12, 2011; K. Deininger and D. Byerlee with J. Lindsay, A. Norton, H. hari, “South Asian Summer Monsoon Precipitation Variability: Cou-
Selod, and M. Stickler, Rising Global Interest in Farmland: Can It Yield pled Climate Model Simulations and Projections under IPCC AR4,”
Sustainable and Equitable Benefits? (Washington, DC: World Bank); Theoretical and Applied Climatology 90, nos. 3–4 (2007): 133–159;
International Fund for Agricultural Development, Responding to M. J. Salinger, “Climate Variability and Change: Past, Present, and
“Land Grabbing” and Promoting Responsible Investment in Agricul- Future—An Overview,” Climatic Change 70, nos. 1–2 (2005): 9–29;
ture, IFAD Occasional Paper Series (Rome: 2011). K. Viatcheslav, F. W. Zwiers, X. Zhang, and G. C. Hegerl, “Changes
in Temperature and Precipitation Extremes in the IPCC Ensemble
of Global Coupled Model Simulations,” Journal of Climate 20, no. 8
CHAPTER 2
(2010): 1419–1444; F. Giorgi, X. Bi , and J. Pal, “Mean, Interannual
Variability and Trends in a Regional Climate Change Experiment over
Text
Europe. II: Climate Change Scenarios (2071–2100),” Climate Dynamics
1 C. Martins-Filho, M. Torero, and F. Yao, “Estimation of Quan- 23, nos. 7–8 (2004): 839–858.
tiles Based on Nonlinear Models of Commodity Price Dynamics and 6 G. C. Nelson, M. W. Rosegrant, A. Palazzo, I. Gray, C. Ingersoll, R.
Extreme Value Theory” (Washington, DC: International Food Policy
Robertson, S. Tokgoz, et al., Food Security, Farming, and Climate
Research Institute, 2010), mimeo.
Change to 2050: Scenarios, Results, Policy Options (Washington, DC:
2 Figure 2 shows the results of a model of the dynamic evolution of
International Food Policy Research Institute, 2010).
daily returns based on historical data going back to 1954 (known as 7 M. Hernandez and M. Torero, “Examining the Dynamic Relationship
the Nonparametric Extreme Quantile [NEXQ] Model). This model is
between Spot and Futures Prices of Agricultural Commodities,” in
then combined with extreme value theory to estimate higher-order
Commodity Market Review 2009–2010 (Rome: Food and Agriculture
quantiles of the return series, allowing for classification of any par-
Organization of the United Nations, 2010).
ticular realized return (that is, effective return in the futures market)
8 W. Martin and K. Anderson, “Trade Distortions and Food Price
as extremely high or not. A period of time characterized by extreme
price variation (volatility) is a period of time in which we observe Surges,” paper prepared for the World Bank–University of Califor-
a large number of extreme positive returns. An extreme positive nia, Berkeley, conference “Agriculture for Development—Revisited,”
return is defined to be a return that exceeds a certain pre-established Berkeley, CA, USA, October 1–2, 2010.
threshold. This threshold is taken to be a high order (95 percent) con- B. Wright, International Grain Reserves and Other Instruments to
9
ditional quantile (that is, a value of return that is exceeded with low Address Volatility in Grain Markets, Policy Research Working Paper
probability: 5 percent). One or two such returns do not necessarily 5028 (Washington, DC: World Bank, 2009).
105
](https://image.slidesharecdn.com/oc72-120424053736-phpapp01/85/Oc72-116-320.jpg)
![10 P. Timmer, “Reflections on Food Crises Past,” Food Policy 35, no. 1 2 A. Sen, Poverty and Famines: An Essay on Entitlement and Depriva-
(2010): 1–11. tion (Oxford, UK: Clarendon Press, 1981).
11 B. Wright, Speculators, Storage, and the Price of Rice (Giannini 3 S. Devereux, “Introduction: From ‘Famines’ to ‘New Famines,’ in The
Foundation of Agricultural Economics, University of California, New Famines: Why Famines Persist in an Era of Globalization, ed. S.
Berkeley, 2008); Wright, International Grain Reserves and Other Devereux (London: Routledge, 2007).
Instruments to Address Volatility; A. Evans, The Feeding of the Nine 4 See, for example, J. G. McPeak, P. D. Little, and C. R. Doss, Risk and
Billion: Global Food Security for the 21st Century (London: Chatham Social Change in an African Rural Economy: Livelihoods in Pastoralist
House, 2009). Communities (New York: Routledge, 2011); F. Flintan, Broken Lands:
12 Martins-Filho, Torero, and Yao, “Estimation of Quantiles Based on Broken Lives? Causes, Processes, and Impacts of Land Fragmentation
Nonlinear Models of Commodity Price Dynamics.” in the Rangelands of Ethiopia, Kenya, and Uganda (Nairobi: REGLAP
13 A. Sarris, Hedging Cereal Import Price Risks and Institutions to [Regional Learning and Advocacy Programme], 2011); and Devereux,
Assure Import Supplies, FAO Working Paper (Rome: Food and Agricul- Vulnerable Livelihoods in Somali Region, Ethiopia.
ture Organization of the United Nations, 2009). J. F. Maystadt, A. Mabiso, and O. Ecker, “Climate Change and Civil
5
Wright, International Grain Reserves and Other Instruments to
14 War in Somalia: Does Drought Fuel Conflict through Livestock Price
Address Volatility; J. Lin, “Prepared Remarks Presented at the Round- Shocks?” paper presented at the US Agency for International Devel-
table on ‘Preparing for the Next Global Food Price Crisis,’” Center for opment/International Food Policy Research Institute Workshop on
Global Development, Washington, DC, October 17, 2008. Enhancing Resilience in the Horn of Africa, Washington, DC, Decem-
ber 13–14, 2011.
15 J. von Braun and M. Torero, Physical and Virtual Global Food
Reserves to Protect the Poor and Prevent Market Failure, Policy
6 T. J. Lybbert, C. B. Barrett, S. Desta, and D. L. Coppock, “Stochas-
Brief 4 (Washington, DC: International Food Policy Research Insti- tic Wealth Dynamics and Risk Management among a Poor Popu-
tute, 2008). lation,” Economic Journal 114, no. 498 (2004): 750–777; McPeak,
Little, and Doss, Risk and Social Change in an African Rural Economy;
16 Lin, “Prepared Remarks Presented at the Roundtable”; J. von Braun,
Flintan, Broken Lands; Devereux, Vulnerable Livelihoods in Somali
J. Lin, and M. Torero, “Eliminating Drastic Food Price Spikes: A Three-
Region, Ethiopia.
Pronged Approach for Reserves,” note for discussion (International
Food Policy Research Institute, Washington, DC, 2009); and for rice: I. Livingstone, “The Common Property Problem and Pastoralist Eco-
7
Timmer, “Reflections on Food Crises Past.” nomic Behavior,” Journal of Development Studies 23, no. 1 (1986):
5–19.
17 von Braun and Torero, Physical and Virtual Global Food Reserves; J.
8 Lybbert et al., “Stochastic Wealth Dynamics and Risk Management
von Braun and M. Torero, Implementing the Physical and Virtual Food
Reserves to Protect the Poor and Prevent Market Failure, IFPRI Policy among a Poor Population.”
Brief 10 (Washington, DC: International Food Policy Research Insti- P. D. Little, R. Behnke, J. McPeak, and G. Gebru, Retrospective
9
tute, 2009); J. von Braun and M. Torero, “Exploring the Price Spike,” Assessment of Pastoral Policies in Ethiopia, 1991–2008, Report Num-
Choices 24, no. 1 (2009), www.choicesmagazine.org/magazine/article. ber 1, Pastoral Economic Growth and Development Policy Assess-
php?article=58, accessed March 16, 2012. ment, study commissioned by the UK Department for International
Development (London, 2010).
Box 1 10 Lybbert et al., “Stochastic Wealth Dynamics and Risk Management
K. Anderson and S. Nelgen, “Agricultural Trade Distortions during
1
among a Poor Population.”
the Global Financial Crisis,” Oxford Review of Economic Policy 28, 11 Flintan, Broken Lands.
no. 1 (2012).
Little et al., “Retrospective Assessment of Pastoral Policies in Ethio-
12
2 W. Martin and K. Anderson, “Export Restrictions and Price Insula-
pia, 1991–2008”; Flintan, Broken Lands; McPeak, Little, and Doss, Risk
tion during Commodity Price Booms,” American Journal of Agricul-
and Social Change in an African Rural Economy.
tural Economics 94, no. 2 (2012): 422–27.
13 Devereux, Vulnerable Livelihoods in Somali Region, Ethiopia.
For a review, see D. Headey, A. S. Taffesse, and L. You, Enhanc-
14
CHAPTER 3 ing Resilience in the Horn of Africa: An Exploration into Alternative
Investment Options, IFPRI Discussion Paper 1176 (Washington, DC:
Text International Food Policy Research Institute, 2012).
1 S. Devereux, Vulnerable Livelihoods in Somali Region, Ethiopia, 15 Devereux, Vulnerable Livelihoods in Somali Region, Ethiopia.
Research Report No. 57 (Sussex, UK: Institute for Development Stud- Headey, Taffesse, and You, Enhancing Resilience in the Horn
16
ies, 2006); C. Funk, A Climate Trend Analysis of Kenya: August 2010, of Africa.
US Geological Survey Fact Sheet 2010-3074 (Washington, DC: US Geo-
P. D. Little, Somalia: Economy without State (Bloomington, IN, USA:
17
logical Survey, 2010); A. P. Williams and C. Funk, “A Westward Exten-
Indiana University Press, 2003).
sion of the Warm Pool Leads to a Westward Extension of the Walker
Circulation, Drying Eastern Africa,” Climate Dynamics 37, nos. 11–12
(2011): 2417–2435.
106 ](https://image.slidesharecdn.com/oc72-120424053736-phpapp01/85/Oc72-117-320.jpg)
![18 McPeak, Little, and Doss, Risk and Social Change in an Afri- [CCAFS], 2011), http://ccafs.cgiar.org/sites/default/files/assets/docs/
can Rural Economy; Devereux, Vulnerable Livelihoods in Somali ccafsreport5-climate_hotspots_final.pdf.
Region, Ethiopia. 3 K. K. Garg, L. Karlberg, J. Barron, S. P. Wani, and J. Rockstrom,
19 Ibid. “Assessing Impacts of Agricultural Water Interventions in the Kotha-
20 Ibid. pally Watershed, Southern India,” Hydrological Processes 26, no. 3
(2011): 287–404, http://dx.doi.org/10.1002/hyp.8138.
21 Little, Somalia: Economy without State.
4 J. Wang, J. Huang, and S. Rozelle, Climate Change and China’s Agri-
Headey, Taffesse, and You, Enhancing Resilience in the Horn
22
cultural Sector: An Overview of Impacts, Adaptation, and Mitigation,
of Africa.
Issue Brief No. 5 (Geneva and Washington, DC: International Centre
Little et al., “Retrospective Assessment of Pastoral Policies in Ethio-
23
for Trade and Sustainable Development and International Food and
pia, 1991–2008.” Agricultural Trade Policy Council, 2010).
24 Y. Aklilu and A. Catley, Livestock Exports from the Horn of Africa: 5 E. Bryan, C. Ringler, B. Okoba, J. Koo, M. Herrero, and S. Silvestri,
An Analysis of Benefits by Pastoralist Wealth Group and Policy Impli- Agricultural Management for Climate Change Adaptation, Green-
cations (Medford, MA: Feinstein International Center, Tufts Univer- house Gas Mitigation, and Agricultural Productivity: Insights from
sity, 2010). Kenya, IFPRI Discussion Paper 1098 (Washington, DC: International
25 McPeak, Little, and Doss, Risk and Social Change in an African Food Policy Research Institute, 2011).
Rural Economy. 6 W. Schlenker and M. J. Roberts, “Nonlinear Temperature Effects
26 Devereux, Vulnerable Livelihoods in Somali Region, Ethiopia. Indicate Severe Damages to US Crop Yields under Climate Change,”
Proceedings of the National Academy of Sciences of the United States
27 Personal communication with John Graham, USAID Ethiopia.
of America 106, no. 37 (2009): 15594–15598, http://dx.doi.org/10.1073/
Headey, Taffesse, and You, Enhancing Resilience in the Horn
28
pnas.0906865106.
of Africa.
7 Lobell, Schlenker, and Costa-Roberts, “Climate Trends and Global
J. Konyndyk, “Exploring the Links between Peacebuilding and
29
Crop Production since 1980.”
Drought Resiliency in the Horn: Lessons from Mercy Corps’ Pro-
grams,” presentation at “Enhancing Resilience in the Horn of Africa,” Box 5
a workshop hosted by the US Agency for International Development 1 S. S. Yadav, R. Redden, J. L. Hatfield, H. Lotze-Campen, and A. Hall,
and the International Food Policy Research Institute, Washington, DC,
eds., Crop Adaptation to Climate Change (West Sussex, England, UK:
December 13–1.
Wiley, 2011).
Box 3 2 Ericksen P, Thornton P, Notenbaert A, Cramer L, Jones P, Herrero M.
1 P. A. Dorosh, S. J. Malik, and M. Krausova, “Rehabilitating Agri-
2011. Mapping hotspots of climate change and food insecurity in
the global tropics. CCAFS Report no. 5. CGIAR Research Program on
culture and Promoting Food Security Following the 2010 Pakistan
Climate Change, Agriculture and Food Security (CCAFS). Copenhagen,
Floods,” Pakistan Development Review 49, no. 3 (2010): 167–192.
Denmark. Available online at: www.ccafs.cgiar.org. http://ccafs.cgiar.
2 For more information on the 2011 floods in Pakistan, see the Food
org/resources/climate_hotspots
and Agriculture Organization of the United Nations, “Pakistan Floods
3 CGIAR Research Program on Climate Change, Agriculture and
2011,” www.fao.org/emergencies/country_information/list/asia/paki-
Food Security, “Climate Change Emissions and Livelihoods at the
stanfloods2011, accessed March 15, 2012.
Forest-Farm Frontier,” http://ccafs.cgiar.org/news/pro-poor-mitiga-
Box 4 tion/climate-change-emissions-and-livelihoods-forest-farm-frontier,
accessed February 15, 2012.
1 For more information on the crisis in the Horn of Africa, see World
4 CGIAR Research Program on Climate Change, Agriculture and Food
Food Programme, “Horn of Africa Crisis,” www.wfp.org/crisis/horn-
of-africa, accessed March 15, 2012. Security, “Meet the Gender, Climate Change, Agriculture, and Food
Security Grant Recipients,” http://ccafs.cgiar.org/news/decision-
support/meet-gender-climate-change-agriculture-and-food-security-
Chapter 4 grant-recipients, accessed February 15, 2012.
http://ccafs.cgiar.org/news/research-highlights/
5
Text change-and-innovation-climate-adaptation-practices
See for example D. B. Lobell, W. Schlenker, and J. Costa-Roberts,
1
“Climate Trends and Global Crop Production since 1980,” Science 333,
no. 6042 (2011): 616–620, http://dx.doi.org/10.1126/science.1204531.
Chapter 5
2 P. Ericksen, P. Thornton, A. Notenbaert, L. Cramer, P. Jones, and
Text
M. Herrero, Mapping Hotspots of Climate Change and Food Insecu-
rity in the Global Tropics, CCAFS Report No. 5 (Copenhagen: CGIAR Food and Agriculture Organization of the United Nations and
1
Research Program on Climate Change, Agriculture and Food Security Organisation for Economic Co-operation and Development, Price
Volatility in Food and Agricultural Markets: Policy Responses, policy
107
](https://image.slidesharecdn.com/oc72-120424053736-phpapp01/85/Oc72-118-320.jpg)


The International Food Policy Research Institute's 2011 Global Food Policy Report analyzes major developments in global food policy in 2011. Key developments include: 1) Agriculture and food security rose to the top of development agendas as investments increased from countries, international organizations, and private groups. 2) Volatile food prices remained a challenge as staple grain reserves were low and a few countries dominated exports, though prices fell in the second half of 2011 due to good harvests and a stronger dollar. 3) Interconnected challenges around agriculture, nutrition, health, climate change, and natural resources received more recognition, though further action is still needed to address issues like the 2011 famine in the Horn of Africa.


