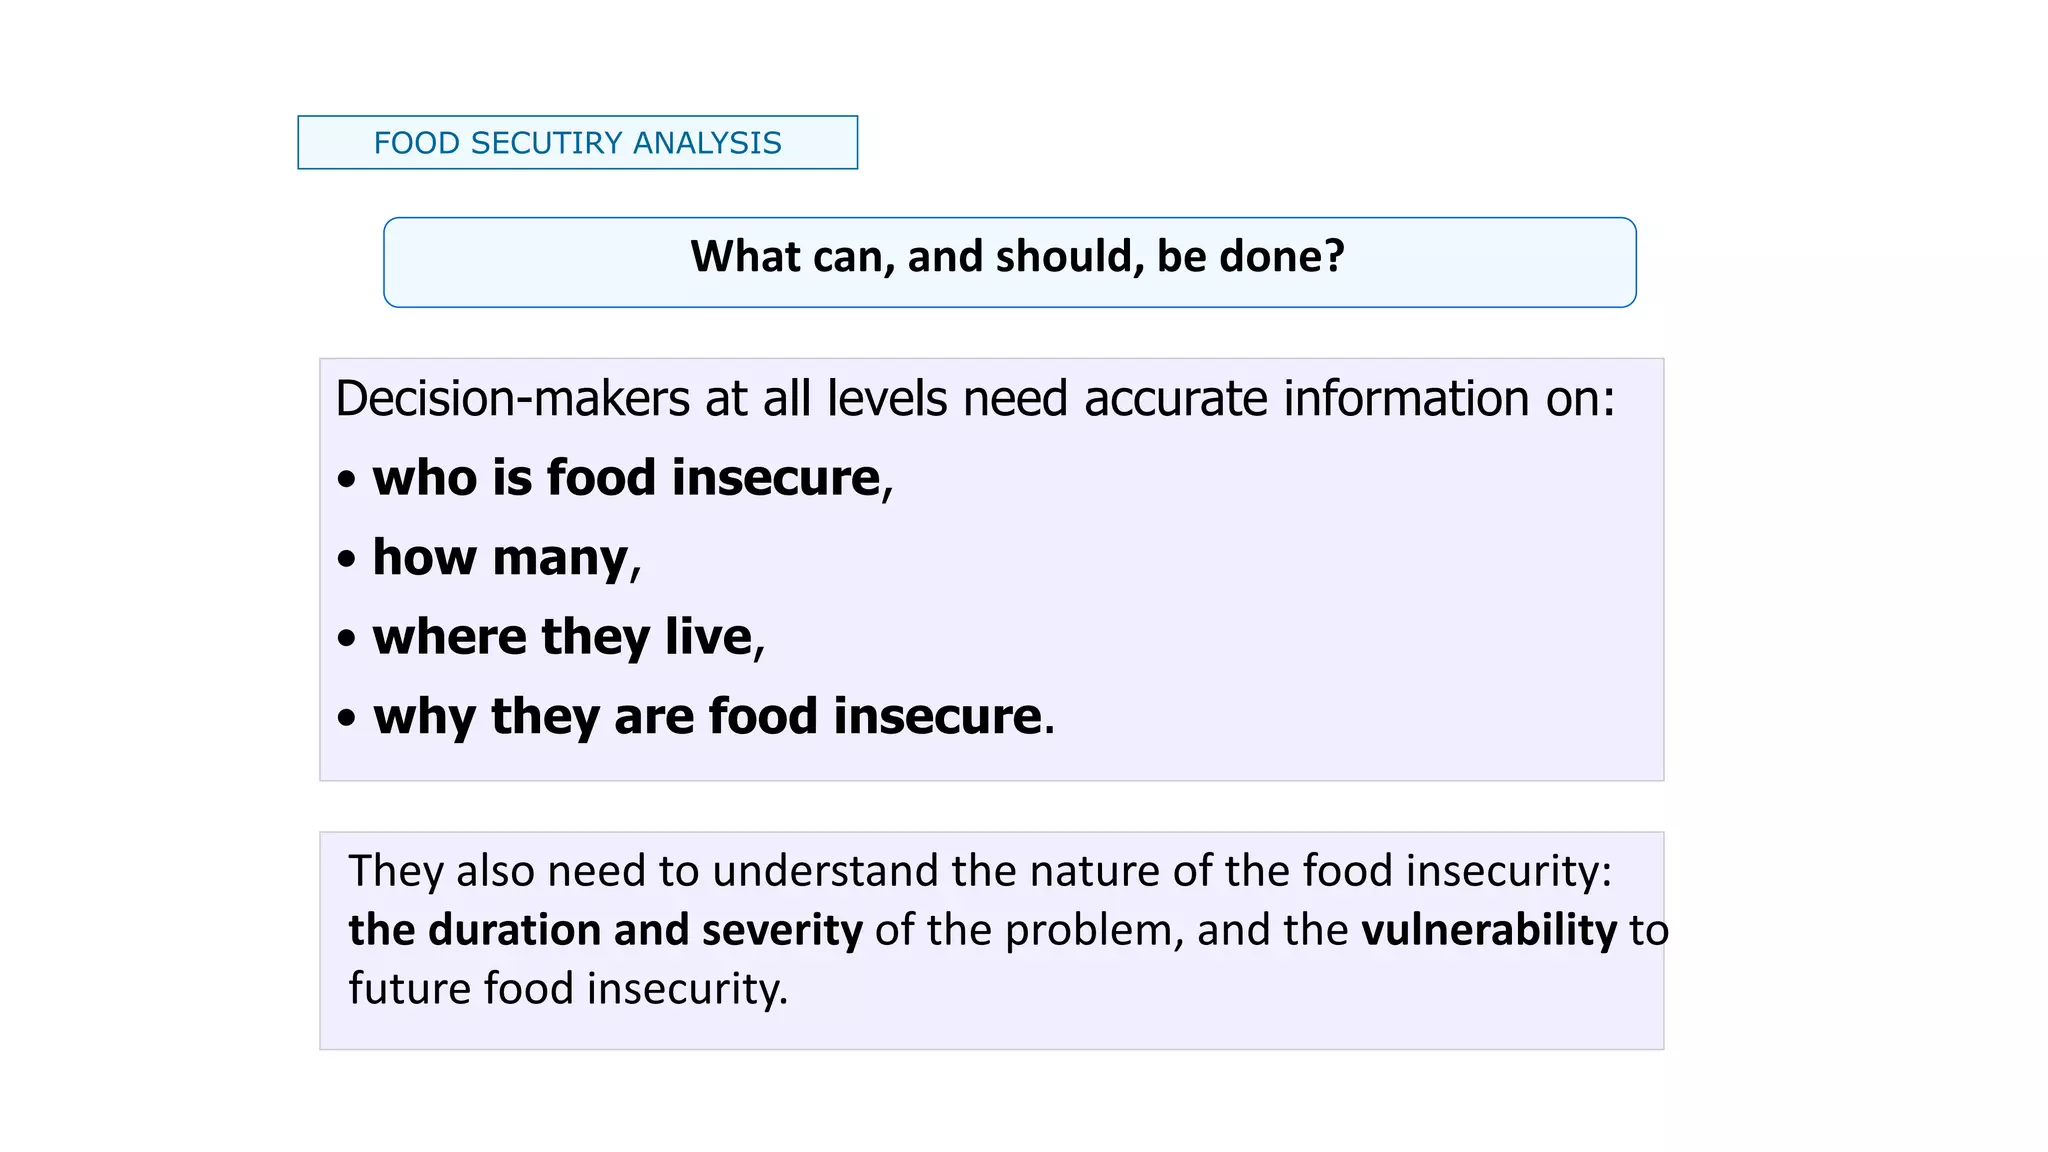
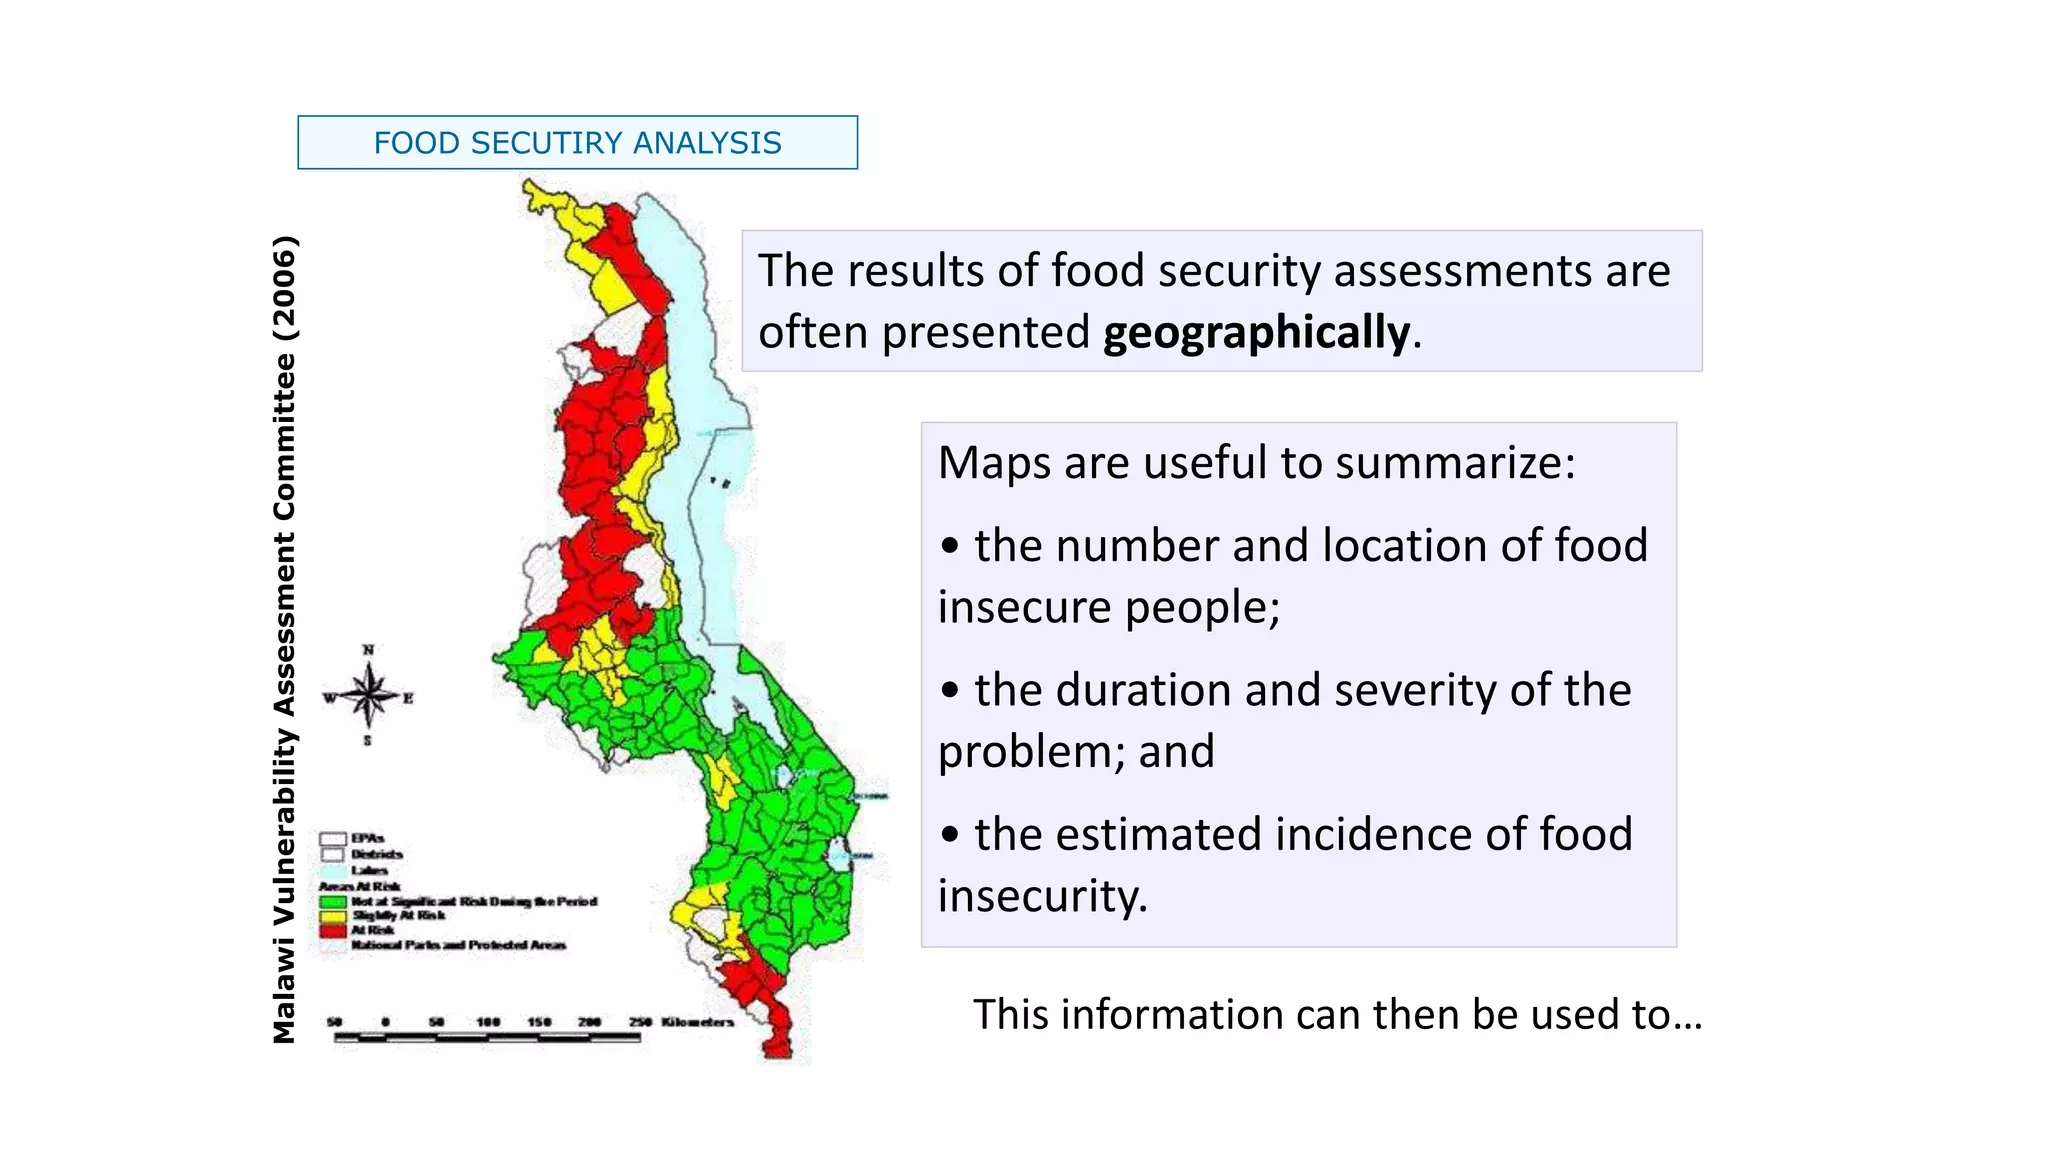
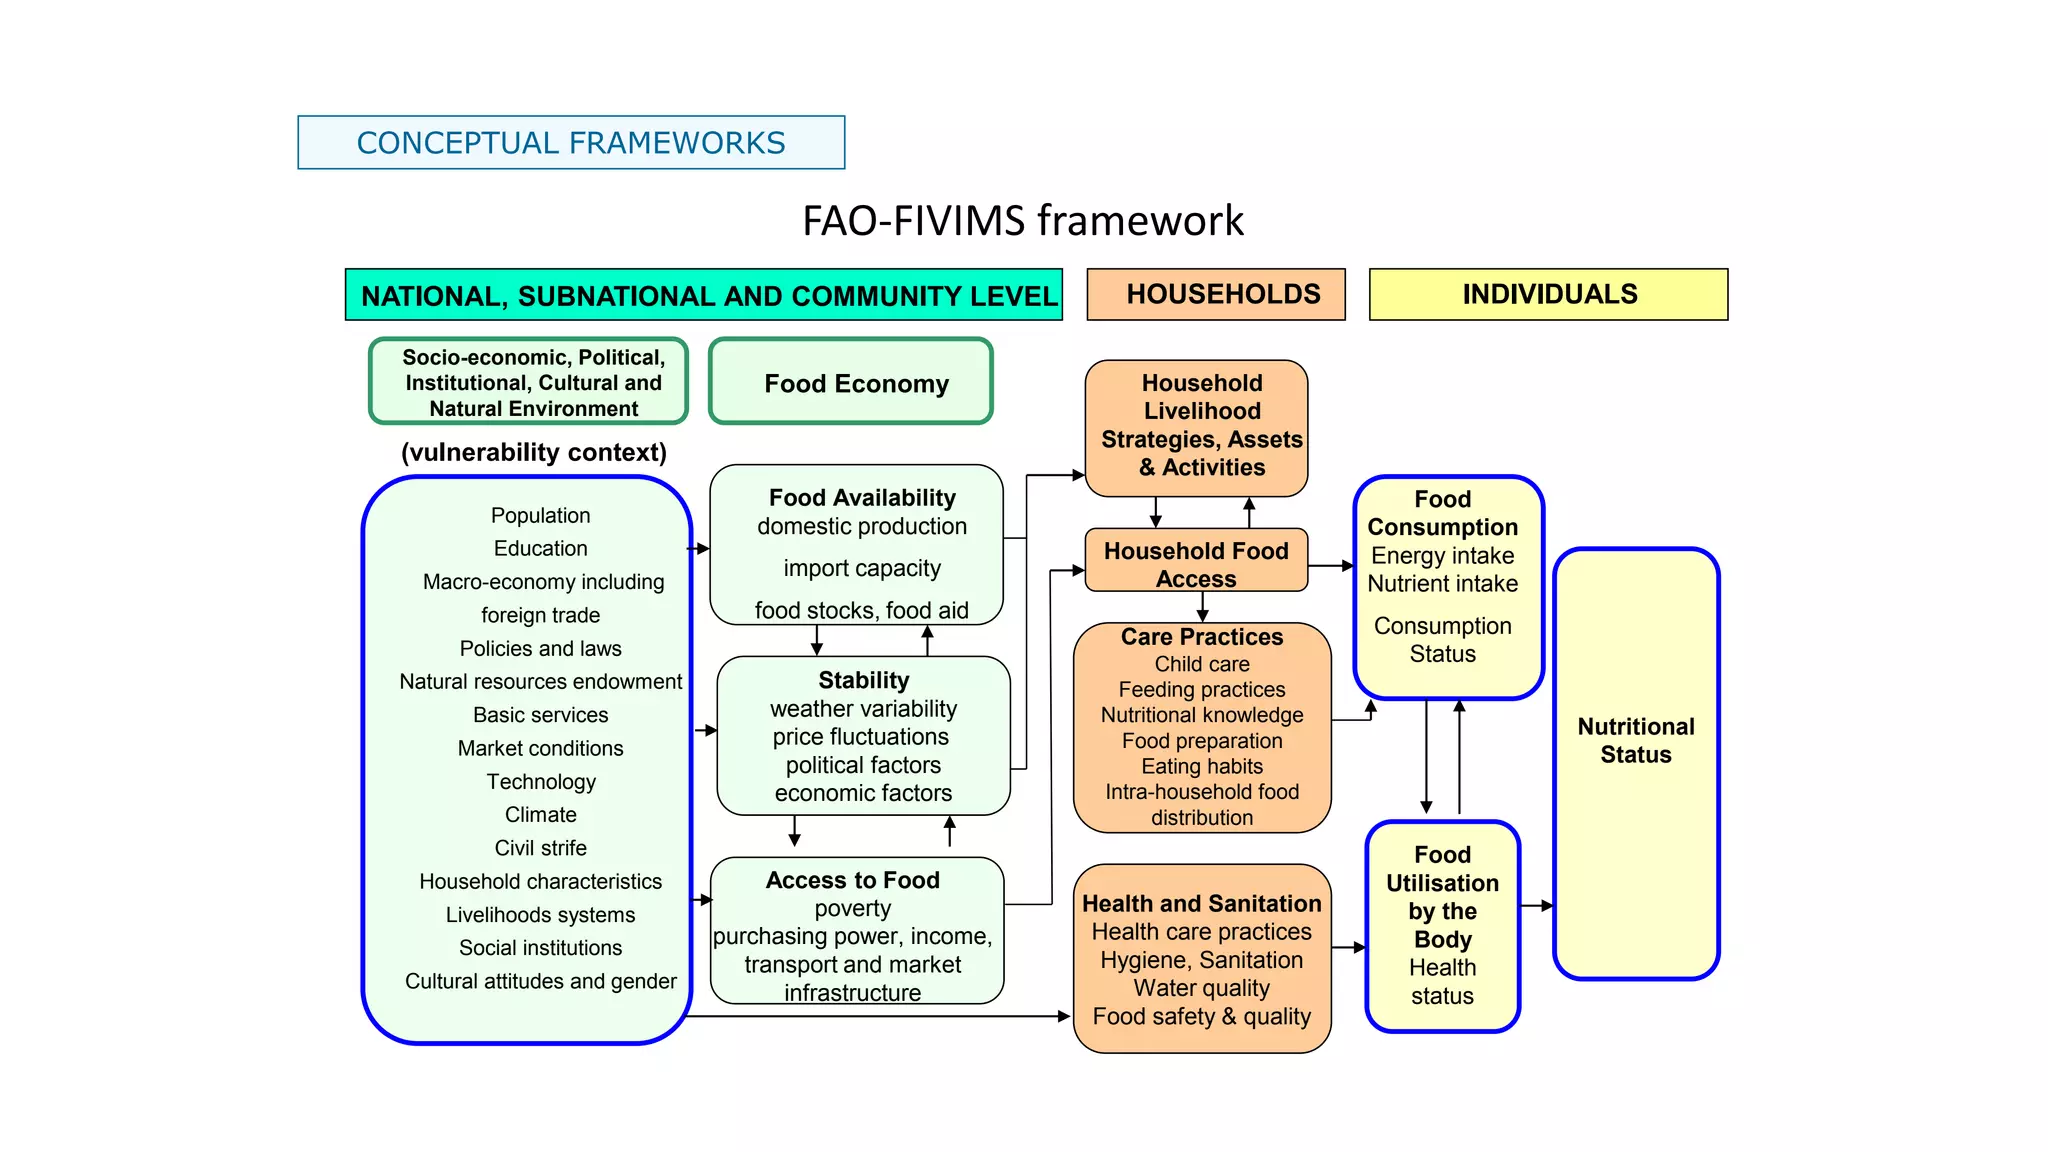
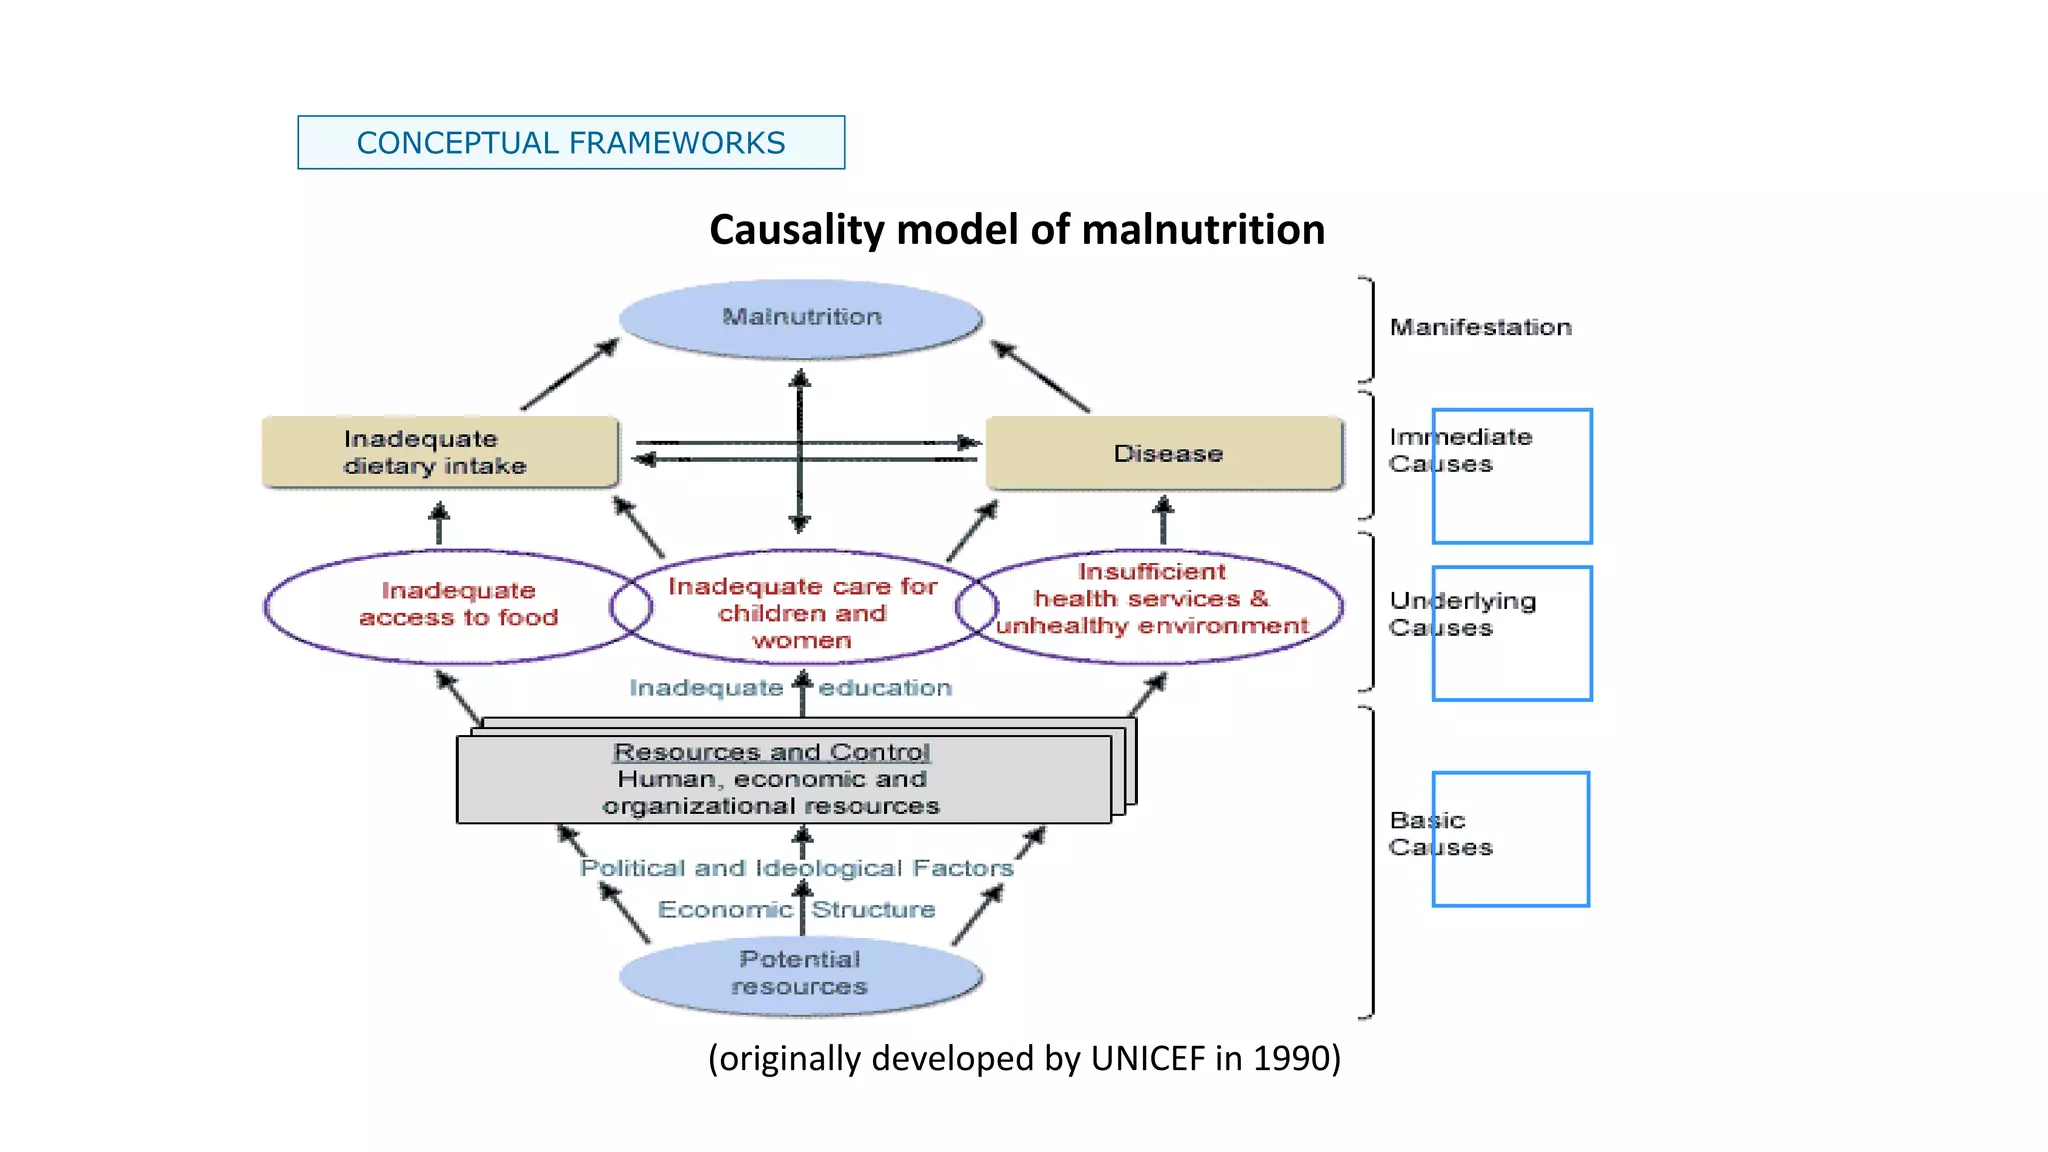
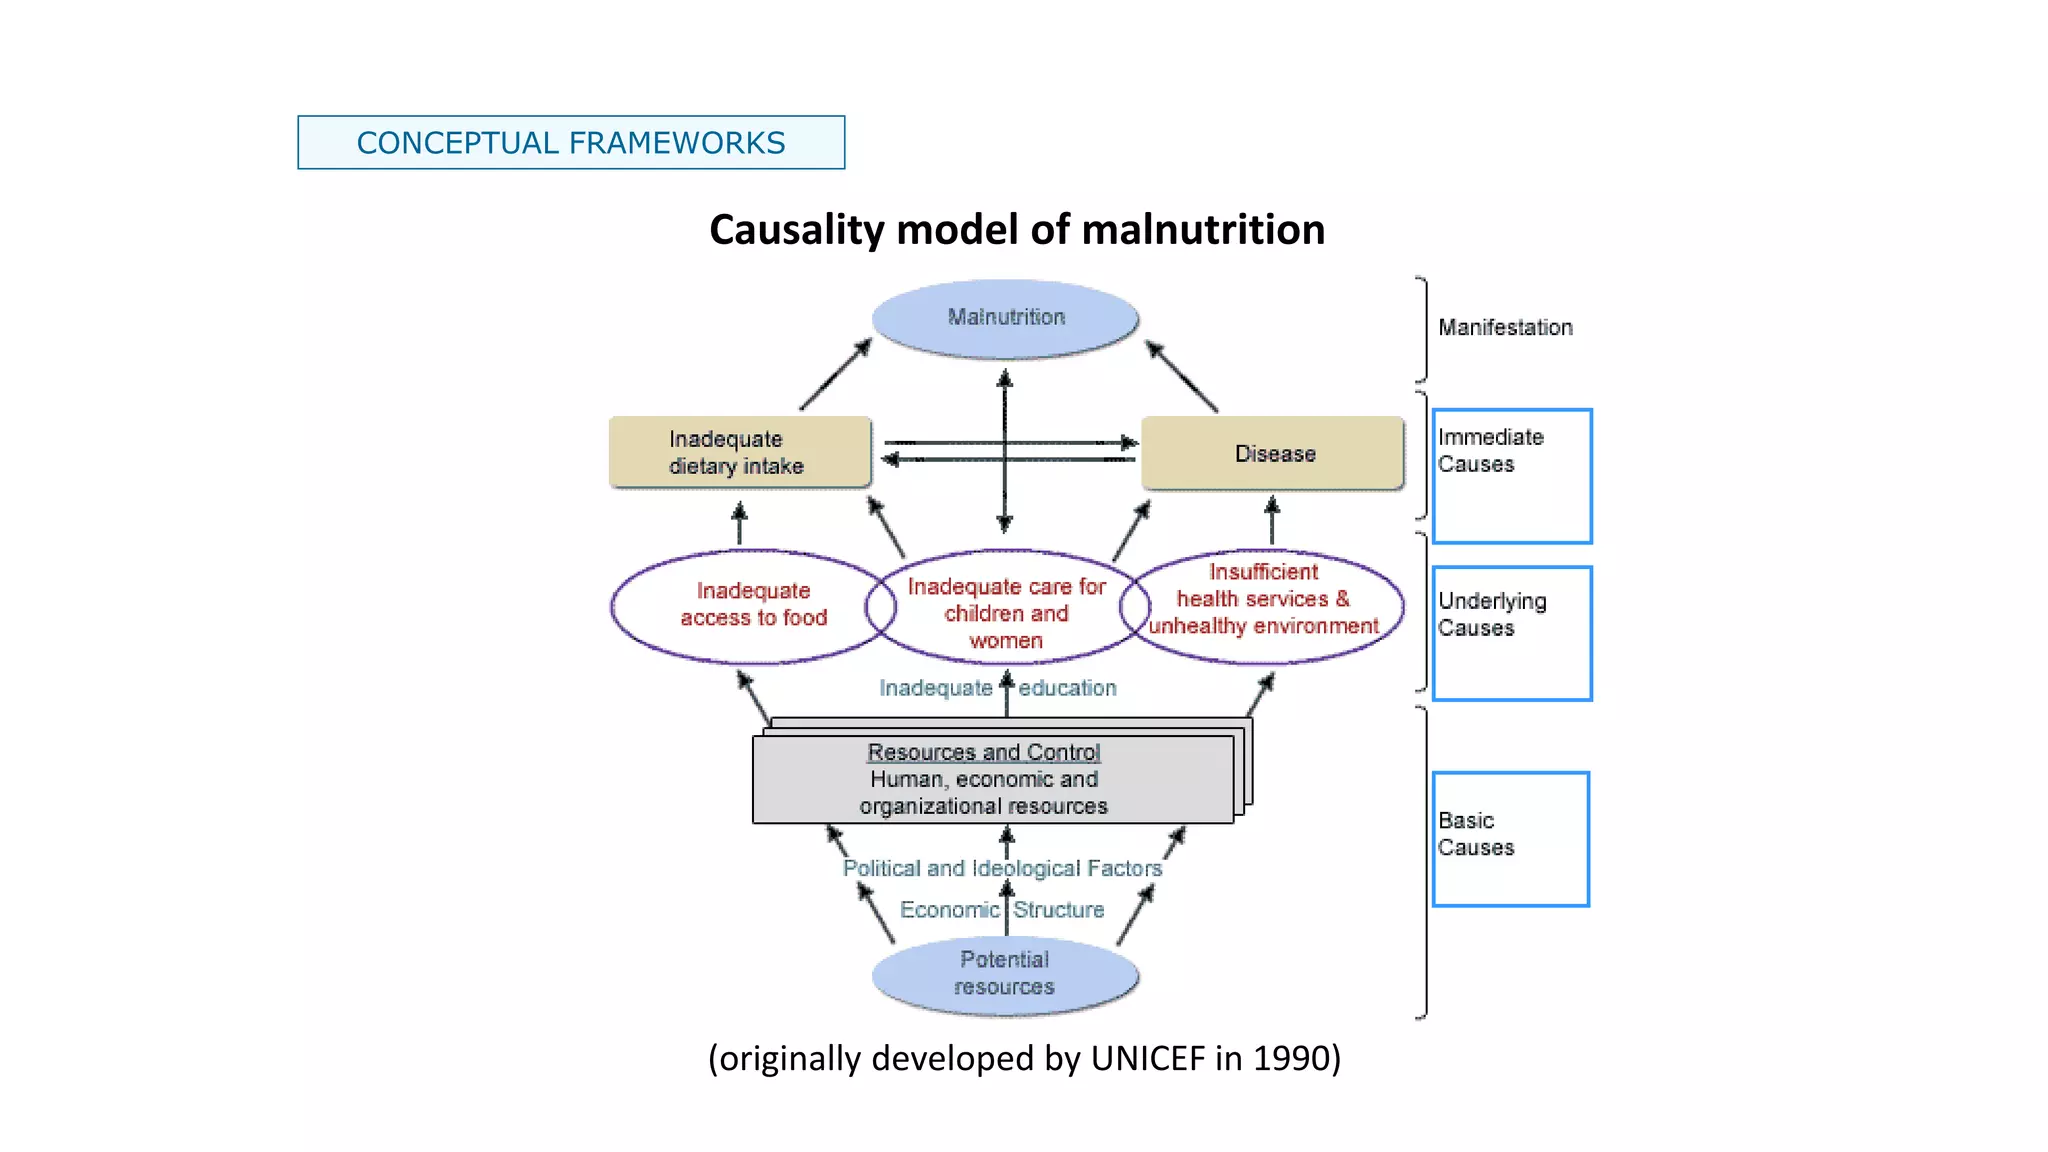
unit 3
Underlying causes of food insecurity;
concepts and framework
Dr. Abdirashid Ahmed Hussein
BSc IN Veterinary science department of animal husbandry in
university of Somalia (Uniso)
BSc in public health in Somvill university
Email: abwaanrashka39@gmail.com
Underlying causes of food insecurity; concepts and
framework
Underlying causes of food insecurity
Food and conflict
• Since the collapse of the central government in 1991, there have
been at least seven periods of food insecurity that coincided with
droughts.
• Some were times of famine, which the UN defines according to
certain measures of hunger, malnutrition and death, and others
were food crises, when hunger and malnutrition rose sharply.
• The major events were: a famine in 1991–92, food crises in 1999–
2000, 2006 and 2008, another famine in 2011–12, a food crisis in
2014 and a food crisis verging on famine in 2016–17.
Normal rainfall patterns
• The main rainy season (called gu) is from April to June and a second
rainy season (called deyr) is from October to November.
• All other months are dry. Crop prices follow a seasonal trend: they
decrease in July/August as the gu harvest replenishes(full) stocks,
increase between September and December as market stocks are
used up, and decrease again in January/February with
the deyr harvest.
• The rains are particularly crucial to the Somalis whose livelihoods
depend on the land
The role of War between armed groups
• In southern Somalia are the key agricultural areas and fighting is going
this strategic area.
Recent drought
• Drought has a severe impact. In 2016, poor gu rains led to a low
harvest. Later that year, the deyr rains were also poor and the harvest
fell by 70%.
• In the northern parts of Somalia the dry season was hotter and
drier than usual, and the region had experienced drought during the
previous two years. This destroyed the harvest and livestock.
• In southern Somalia, 2017 began with a dry season that was hotter
and drier than usual. The 2017 gu rains started late and were below
normal, which led to a low harvest.
Mitigating drought and preventing famine
• It is wrong to blame climate change for famine and conflict. These can
either be prevented, or the impact minimized, if institutions and
mechanisms of good governance are in place.
• For example, the severe 1973–75 drought in Somalia affected 700,000
people (20% of the population) and the death toll was
around 20,000 (less than 1%).
• The country at the time had a strong central government and
institutions that dealt effectively with the natural disaster and
reduced its impact.
FOOD SECUTIRY ANALYSIS
Decision-makers at all levels need accurate information on:
• who is food insecure,
• how many,
• where they live,
• why they are food insecure.
What can, and should, be done?
They also need to understand the nature of the food insecurity:
the duration and severity of the problem, and the vulnerability to
future food insecurity.
FOOD SECUTIRY ANALYSIS
Food security is a complex concept: no one indicator can
adequately describe who is food secure and who is not.
Hence, decision makers will
need complementary and
multiple methods to assess the
incidence of food insecurity in
different contexts.
In practice, measuring and analyzing food security is technically
challenging. Data on various food security dimensions is still
scarce and poorly integrated.
FOOD SECUTIRY ANALYSIS
Example of method
Prevalence of undernourishment
A widely-used indicator for food insecurity is the head
count of persons undernourished or deprived of food used
by FAO.
This estimate is made at the national level and is most
useful for inter-country comparisons and measuring
progress towards global hunger targets. However, it is less
useful for developing detailed national food security
policies and programs.
It is a measure of energy deficiency (not enough food) and
does not say anything about food quality
FOOD SECUTIRY ANALYSIS
Example of method:
Household Food Economy
The household food economy approach uses a model
to estimate who is at risk of future food insecurity.
The HFE method has mainly been used to assess food
crises, where temporary shocks have left large
numbers of people food insecure.
It has not been widely applied to assess chronic food
insecurity.
FOOD SECUTIRY ANALYSIS
Example of method:
Malnutrition assessments
Nutritionists have several well-developed indicators of
malnutrition. The main ones look at the nutrition of young
children, and compare:
• their height against age (‘stunting’),
• their weight against height (‘wasting’), or
• their weight for age (a combination of stunting and wasting).
In addition there are specific indicator levels for deficits of the
main micronutrients, including iron, vitamin A and iodine (also
known as ‘hidden hunger’).
Malawi
Vulnerability
Assessment
Committee
(2006)
FOOD SECUTIRY ANALYSIS
Maps are useful to summarize:
• the number and location of food
insecure people;
• the duration and severity of the
problem; and
• the estimated incidence of food
insecurity.
This information can then be used to…
The results of food security assessments are
often presented geographically.
FOOD SECUTIRY ANALYSIS
…this information can then be used to:
• advocate and raise awareness of the need for action;
• gauge the severity of the problem and the urgency of
response required;
• determine the need for further detailed assessments;
• target the available resources to those most in need;
• monitor changes over time and adjust interventions
accordingly; and
• evaluate the impact of interventions.
CONCEPTUAL FRAMEWORKS
Example
For example, we may know that a certain population is malnourished.
However, this information alone would not help to guide a decision on
whether it is appropriate to improve:
• food availability (e.g. by a food fortification campaign),
• food access (e.g. by providing cash transfers),
• care practices (e.g. by nutritional education), or
• the health environment (e.g. through a vaccination campaign).
In order to plan appropriate
interventions decision makers need to
appreciate why people are food
insecure, by understanding underlying
causes.
CONCEPTUAL FRAMEWORKS
Frameworks are tools to improve our
understanding of complex realities,
processes and linkages, often through
an illustration of these complexities in a
simplified diagram.
Different frameworks have been produced to help understand links
among various food security dimensions, while also explaining
linkages with underlying causes and outcomes, as well as related
concepts and terms.
A food security conceptual framework also presents itself as a useful
tool for conducting food security analysis.
CONCEPTUAL FRAMEWORKS
Socio-economic, Political,
Institutional, Cultural and
Natural Environment
(vulnerability context)
Food Economy
Food Availability
domestic production
import capacity
food stocks, food aid
Access to Food
poverty
purchasing power, income,
transport and market
infrastructure
Household
Livelihood
Strategies, Assets
& Activities
Household Food
Access
Health and Sanitation
Health care practices
Hygiene, Sanitation
Water quality
Food safety & quality
Food
Consumption
Energy intake
Nutrient intake
Consumption
Status
Food
Utilisation
by the
Body
Health
status
Care Practices
Child care
Feeding practices
Nutritional knowledge
Food preparation
Eating habits
Intra-household food
distribution
Nutritional
Status
Stability
weather variability
price fluctuations
political factors
economic factors
Population
Education
Macro-economy including
foreign trade
Policies and laws
Natural resources endowment
Basic services
Market conditions
Technology
Climate
Civil strife
Household characteristics
Livelihoods systems
Social institutions
Cultural attitudes and gender
NATIONAL, SUBNATIONAL AND COMMUNITY LEVEL HOUSEHOLDS INDIVIDUALS
FAO-FIVIMS framework
CONCEPTUAL FRAMEWORKS
Causality model of malnutrition
(originally developed by UNICEF in 1990)
CONCEPTUAL FRAMEWORKS
Causality model of malnutrition
(originally developed by UNICEF in 1990)
Integrated Food Security Phase Classification
(IPC)
• The IPC is a set of tools and procedures to classify the nature and
severity of food insecurity for decision support.
• The IPC aims for optimal decision support, recognizing in reality there
will be less than ideal data and evidence.Thus, the approach of the
IPC is to make the best use of what evidence is available, but to do so
in a rigorous and transparent manner.
• The IPC is a set of tools and procedures to classify the nature and
severity of food insecurity for decision support.
• The IPC classifies areas with Acute Food Insecurity into five Phases:
Minimal, Stressed, Crisis, Emergency, and Famine.
• Each of these Phases has different implications for response
objectives.
• The IPC classifies the severity of the situation for two time periods:
the current situation and for a future projection.
• The future projection provides an early warning statement for
proactive decision making
The Four Functions of IPC
1) Building Technical Consensus
Purpose: To enable technical consensus from multi sectoral experts and
endorsement by key stakeholders.Tools: Technical Working Group
Composition Matrix
2) Classifying severity & causes
Purpose: To classify complex information on severity and causes into
meaningful categories for decision support.
Tools: IPC Analytical Framework, Acute Reference Tables, Chronic
Reference Table, Analysis Worksheets
3) Communicating for action
• Purpose: To communicate core aspects of situation analysis in a
consistent, accessible, and effective manner.
• Tools: IPC Communication Template
4) Quality Assurance
Purpose: To ensure technical rigor and neutrality of analysis.
Tools: Technical Working Group Self Assessment Tool, Peer Review
Assessment Tool
SUMMARY
Achieving food security for all at all times remains a major global challenge.
Where food insecurity problems remain, there may be severe consequences.
Concerns over food insecurity and hunger have generated global debate and
have resulted in well-defined political commitment to reduce food insecurity
through agreed-upon targets. However, progress has been disappointing.
Improved food security information and analysis can accelerate progress:
Firstly, it is important to measure the incidence and nature of food insecurity;
this information helps prioritize action to address food insecurity, target
interventions and monitor progress; however, measurement is technically
challenging and great care is needed in selecting and interpreting indicators.
Secondly, it is important to understand the causes of food insecurity; you
should now understand how various conceptual frameworks – specifically the
food security, malnutrition and sustainable livelihoods frameworks – can help
with this analysis; an understanding of the underlying problems is a first step
in selecting appropriate interventions.

Lecture 3 food insecurity

  • 1.
    unit 3 Underlying causesof food insecurity; concepts and framework Dr. Abdirashid Ahmed Hussein BSc IN Veterinary science department of animal husbandry in university of Somalia (Uniso) BSc in public health in Somvill university Email: abwaanrashka39@gmail.com
  • 2.
    Underlying causes offood insecurity; concepts and framework
  • 3.
    Underlying causes offood insecurity Food and conflict • Since the collapse of the central government in 1991, there have been at least seven periods of food insecurity that coincided with droughts. • Some were times of famine, which the UN defines according to certain measures of hunger, malnutrition and death, and others were food crises, when hunger and malnutrition rose sharply. • The major events were: a famine in 1991–92, food crises in 1999– 2000, 2006 and 2008, another famine in 2011–12, a food crisis in 2014 and a food crisis verging on famine in 2016–17.
  • 4.
    Normal rainfall patterns •The main rainy season (called gu) is from April to June and a second rainy season (called deyr) is from October to November. • All other months are dry. Crop prices follow a seasonal trend: they decrease in July/August as the gu harvest replenishes(full) stocks, increase between September and December as market stocks are used up, and decrease again in January/February with the deyr harvest. • The rains are particularly crucial to the Somalis whose livelihoods depend on the land
  • 5.
    The role ofWar between armed groups • In southern Somalia are the key agricultural areas and fighting is going this strategic area.
  • 6.
    Recent drought • Droughthas a severe impact. In 2016, poor gu rains led to a low harvest. Later that year, the deyr rains were also poor and the harvest fell by 70%. • In the northern parts of Somalia the dry season was hotter and drier than usual, and the region had experienced drought during the previous two years. This destroyed the harvest and livestock. • In southern Somalia, 2017 began with a dry season that was hotter and drier than usual. The 2017 gu rains started late and were below normal, which led to a low harvest.
  • 7.
    Mitigating drought andpreventing famine • It is wrong to blame climate change for famine and conflict. These can either be prevented, or the impact minimized, if institutions and mechanisms of good governance are in place. • For example, the severe 1973–75 drought in Somalia affected 700,000 people (20% of the population) and the death toll was around 20,000 (less than 1%). • The country at the time had a strong central government and institutions that dealt effectively with the natural disaster and reduced its impact.
  • 8.
    FOOD SECUTIRY ANALYSIS Decision-makersat all levels need accurate information on: • who is food insecure, • how many, • where they live, • why they are food insecure. What can, and should, be done? They also need to understand the nature of the food insecurity: the duration and severity of the problem, and the vulnerability to future food insecurity.
  • 9.
    FOOD SECUTIRY ANALYSIS Foodsecurity is a complex concept: no one indicator can adequately describe who is food secure and who is not. Hence, decision makers will need complementary and multiple methods to assess the incidence of food insecurity in different contexts. In practice, measuring and analyzing food security is technically challenging. Data on various food security dimensions is still scarce and poorly integrated.
  • 10.
    FOOD SECUTIRY ANALYSIS Exampleof method Prevalence of undernourishment A widely-used indicator for food insecurity is the head count of persons undernourished or deprived of food used by FAO. This estimate is made at the national level and is most useful for inter-country comparisons and measuring progress towards global hunger targets. However, it is less useful for developing detailed national food security policies and programs. It is a measure of energy deficiency (not enough food) and does not say anything about food quality
  • 11.
    FOOD SECUTIRY ANALYSIS Exampleof method: Household Food Economy The household food economy approach uses a model to estimate who is at risk of future food insecurity. The HFE method has mainly been used to assess food crises, where temporary shocks have left large numbers of people food insecure. It has not been widely applied to assess chronic food insecurity.
  • 12.
    FOOD SECUTIRY ANALYSIS Exampleof method: Malnutrition assessments Nutritionists have several well-developed indicators of malnutrition. The main ones look at the nutrition of young children, and compare: • their height against age (‘stunting’), • their weight against height (‘wasting’), or • their weight for age (a combination of stunting and wasting). In addition there are specific indicator levels for deficits of the main micronutrients, including iron, vitamin A and iodine (also known as ‘hidden hunger’).
  • 13.
    Malawi Vulnerability Assessment Committee (2006) FOOD SECUTIRY ANALYSIS Mapsare useful to summarize: • the number and location of food insecure people; • the duration and severity of the problem; and • the estimated incidence of food insecurity. This information can then be used to… The results of food security assessments are often presented geographically.
  • 14.
    FOOD SECUTIRY ANALYSIS …thisinformation can then be used to: • advocate and raise awareness of the need for action; • gauge the severity of the problem and the urgency of response required; • determine the need for further detailed assessments; • target the available resources to those most in need; • monitor changes over time and adjust interventions accordingly; and • evaluate the impact of interventions.
  • 15.
    CONCEPTUAL FRAMEWORKS Example For example,we may know that a certain population is malnourished. However, this information alone would not help to guide a decision on whether it is appropriate to improve: • food availability (e.g. by a food fortification campaign), • food access (e.g. by providing cash transfers), • care practices (e.g. by nutritional education), or • the health environment (e.g. through a vaccination campaign). In order to plan appropriate interventions decision makers need to appreciate why people are food insecure, by understanding underlying causes.
  • 16.
    CONCEPTUAL FRAMEWORKS Frameworks aretools to improve our understanding of complex realities, processes and linkages, often through an illustration of these complexities in a simplified diagram. Different frameworks have been produced to help understand links among various food security dimensions, while also explaining linkages with underlying causes and outcomes, as well as related concepts and terms. A food security conceptual framework also presents itself as a useful tool for conducting food security analysis.
  • 17.
    CONCEPTUAL FRAMEWORKS Socio-economic, Political, Institutional,Cultural and Natural Environment (vulnerability context) Food Economy Food Availability domestic production import capacity food stocks, food aid Access to Food poverty purchasing power, income, transport and market infrastructure Household Livelihood Strategies, Assets & Activities Household Food Access Health and Sanitation Health care practices Hygiene, Sanitation Water quality Food safety & quality Food Consumption Energy intake Nutrient intake Consumption Status Food Utilisation by the Body Health status Care Practices Child care Feeding practices Nutritional knowledge Food preparation Eating habits Intra-household food distribution Nutritional Status Stability weather variability price fluctuations political factors economic factors Population Education Macro-economy including foreign trade Policies and laws Natural resources endowment Basic services Market conditions Technology Climate Civil strife Household characteristics Livelihoods systems Social institutions Cultural attitudes and gender NATIONAL, SUBNATIONAL AND COMMUNITY LEVEL HOUSEHOLDS INDIVIDUALS FAO-FIVIMS framework
  • 18.
    CONCEPTUAL FRAMEWORKS Causality modelof malnutrition (originally developed by UNICEF in 1990)
  • 19.
    CONCEPTUAL FRAMEWORKS Causality modelof malnutrition (originally developed by UNICEF in 1990)
  • 20.
    Integrated Food SecurityPhase Classification (IPC) • The IPC is a set of tools and procedures to classify the nature and severity of food insecurity for decision support. • The IPC aims for optimal decision support, recognizing in reality there will be less than ideal data and evidence.Thus, the approach of the IPC is to make the best use of what evidence is available, but to do so in a rigorous and transparent manner. • The IPC is a set of tools and procedures to classify the nature and severity of food insecurity for decision support.
  • 21.
    • The IPCclassifies areas with Acute Food Insecurity into five Phases: Minimal, Stressed, Crisis, Emergency, and Famine. • Each of these Phases has different implications for response objectives. • The IPC classifies the severity of the situation for two time periods: the current situation and for a future projection. • The future projection provides an early warning statement for proactive decision making
  • 22.
    The Four Functionsof IPC 1) Building Technical Consensus Purpose: To enable technical consensus from multi sectoral experts and endorsement by key stakeholders.Tools: Technical Working Group Composition Matrix 2) Classifying severity & causes Purpose: To classify complex information on severity and causes into meaningful categories for decision support. Tools: IPC Analytical Framework, Acute Reference Tables, Chronic Reference Table, Analysis Worksheets
  • 23.
    3) Communicating foraction • Purpose: To communicate core aspects of situation analysis in a consistent, accessible, and effective manner. • Tools: IPC Communication Template 4) Quality Assurance Purpose: To ensure technical rigor and neutrality of analysis. Tools: Technical Working Group Self Assessment Tool, Peer Review Assessment Tool
  • 25.
    SUMMARY Achieving food securityfor all at all times remains a major global challenge. Where food insecurity problems remain, there may be severe consequences. Concerns over food insecurity and hunger have generated global debate and have resulted in well-defined political commitment to reduce food insecurity through agreed-upon targets. However, progress has been disappointing. Improved food security information and analysis can accelerate progress: Firstly, it is important to measure the incidence and nature of food insecurity; this information helps prioritize action to address food insecurity, target interventions and monitor progress; however, measurement is technically challenging and great care is needed in selecting and interpreting indicators. Secondly, it is important to understand the causes of food insecurity; you should now understand how various conceptual frameworks – specifically the food security, malnutrition and sustainable livelihoods frameworks – can help with this analysis; an understanding of the underlying problems is a first step in selecting appropriate interventions.