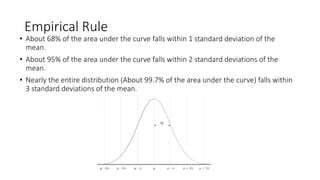
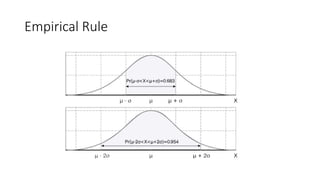
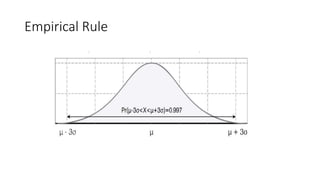
The document introduces the concept of the normal distribution and how it relates to many real-world datasets that follow a bell curve shape. It describes that a normal distribution is defined by its mean and standard deviation. It then validates the empirical rule for normal distributions, which states that approximately 68% of values fall within 1 standard deviation of the mean, 95% within 2 standard deviations, and 99.7% within 3 standard deviations. The document tests this by analyzing data on baby weights and calculating the percentages within each standard deviation range.