Downloaded 219 times
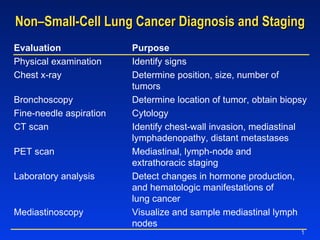
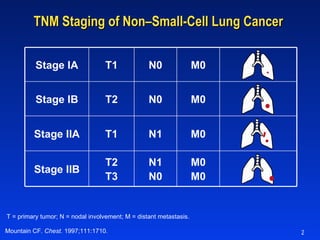
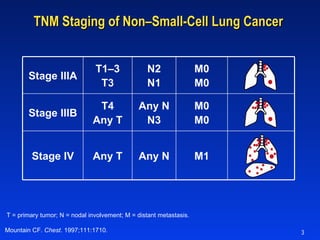
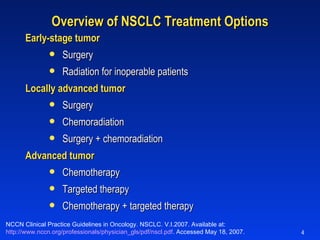

The document discusses methods for diagnosing and staging non-small cell lung cancer (NSCLC), including physical exams, imaging tests, biopsies and laboratory tests. It then describes the TNM staging system for NSCLC and outlines treatment options based on cancer stage, including surgery, radiation, chemotherapy and targeted therapy. Later sections provide details on studies evaluating the benefits of postoperative radiation therapy and chemoradiation for locally advanced NSCLC.


