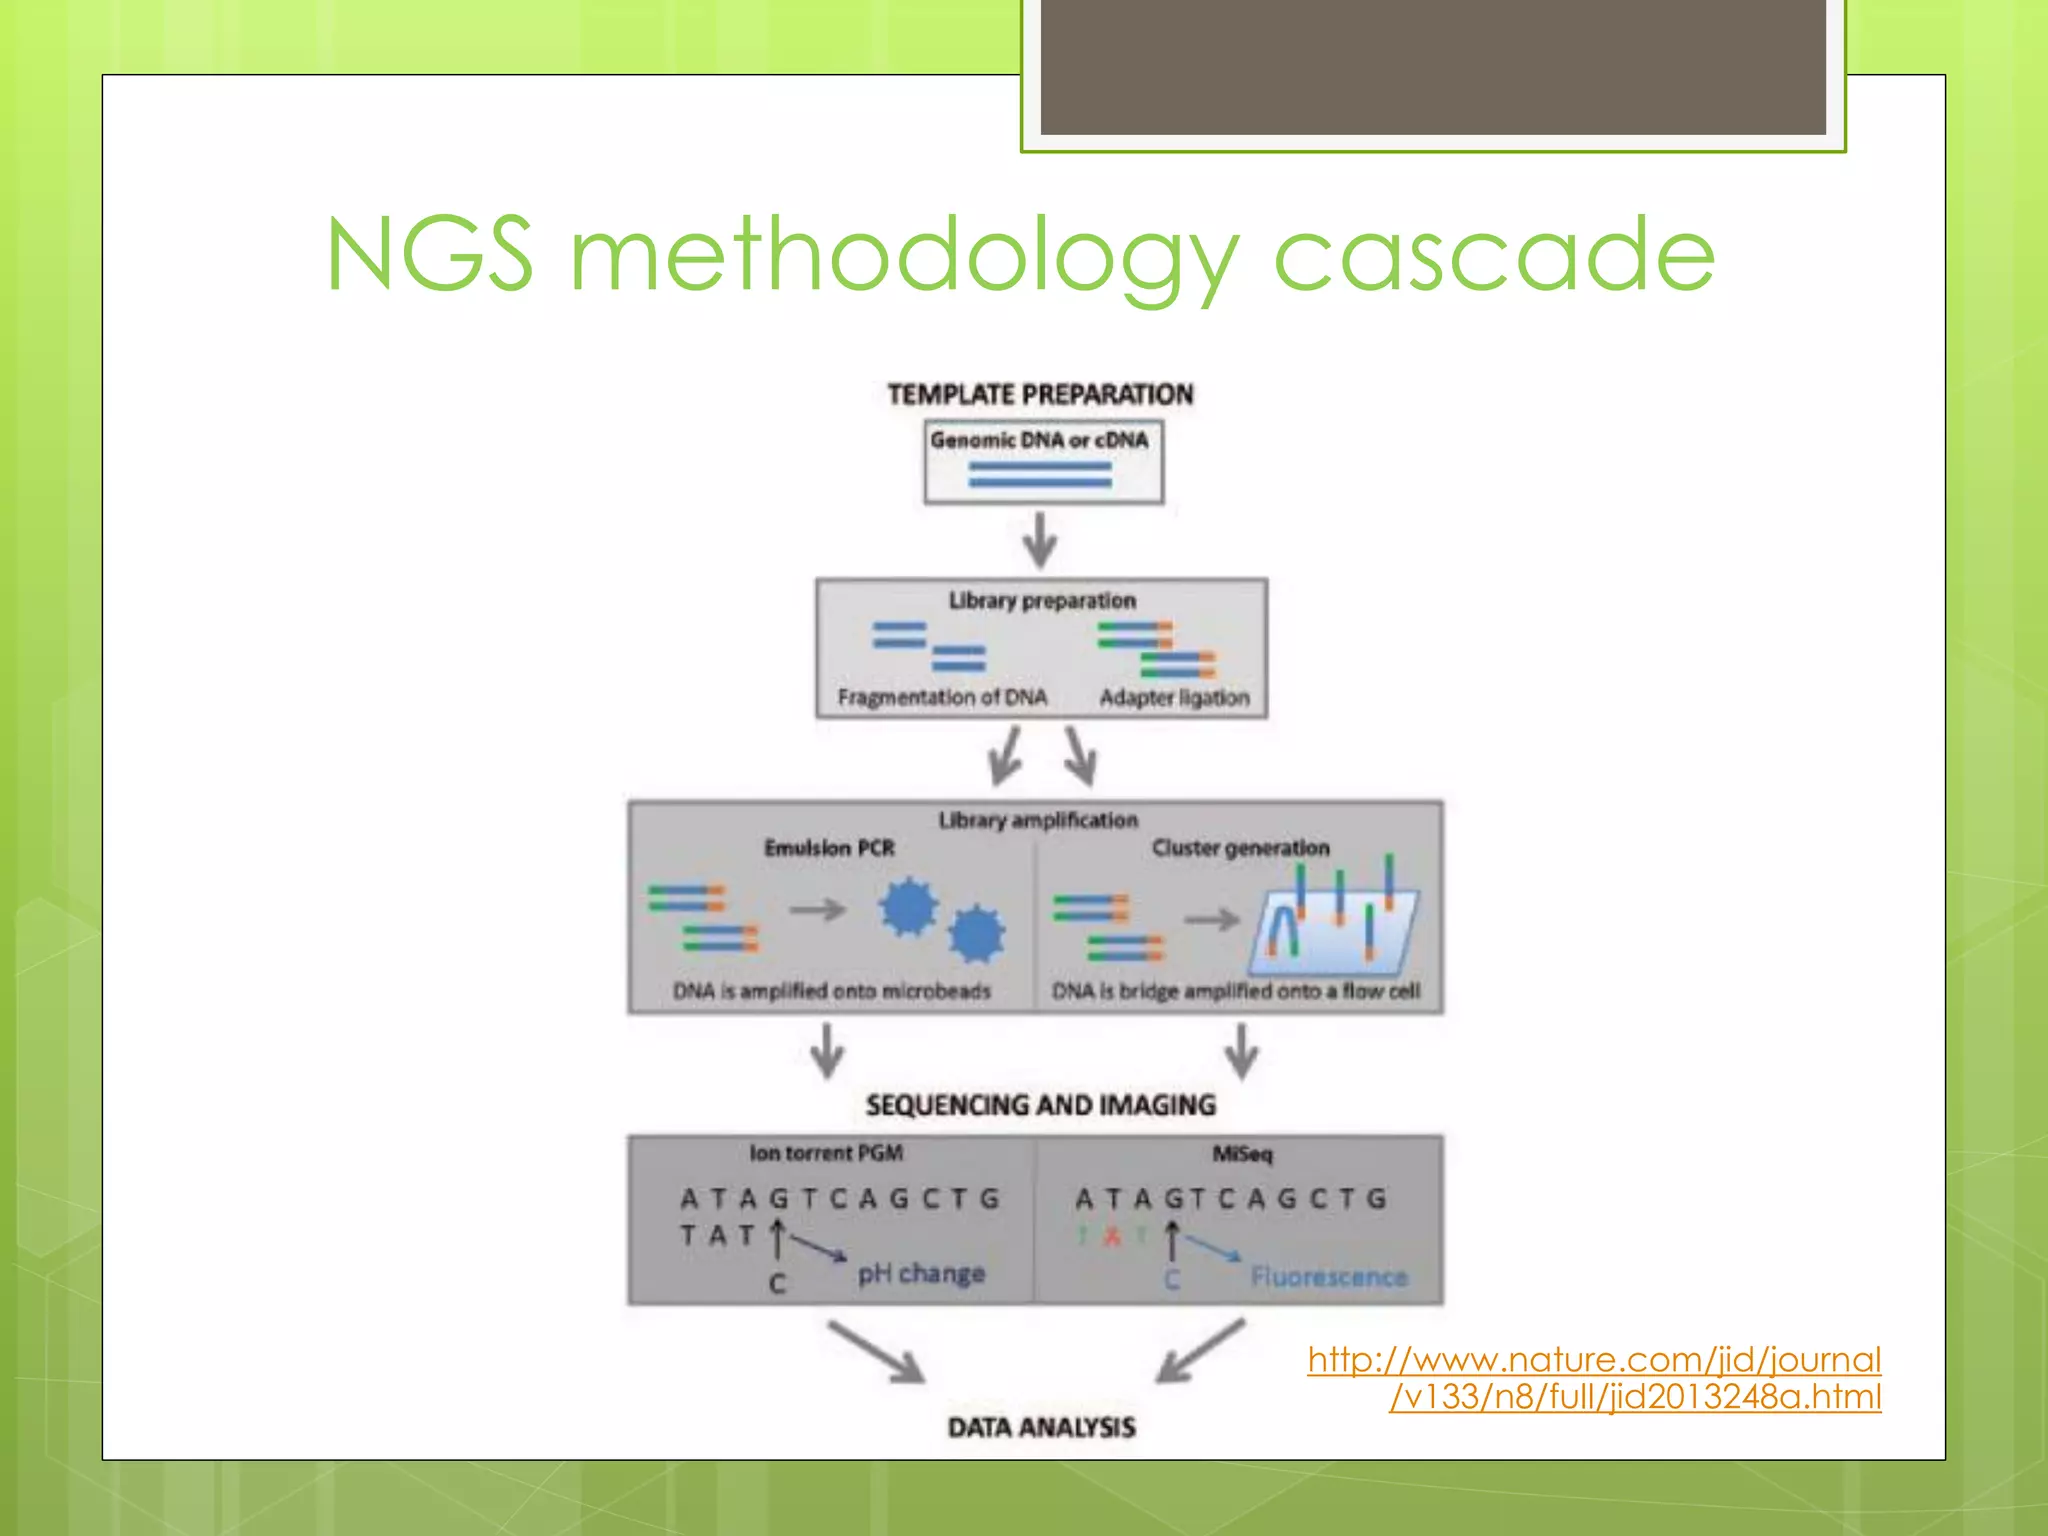
Next
Generation
sequencing in
Breast Cancer
Research
By: Seham Alshehri
MSc Biochemical research
OUTLINES
 MicroRNA (miRNA) and breast cancer.
 Next generation sequencing (NGS)
 Data analysis
Cancer overview
 Cancer is genetic disease
Is a group of diseases characterized by
uncontrolled cell division leading to a growth of
abnormal cells
Oncogenes=accelarators pedals
TS genes=breake pedals
miRNA in Cancer
 Recently discovered, miRNA is small RNA
molecules that play important roles in gene
expression.
 These small genes make much smaller RNA
that don’t make protein products but they
react controlling the expression of other
genes
 Some new researches showed that miRNA
play roles in controlling TS & oncogenes
expression!
miRNA in BC
 miRNAs dysregulation in BC was first
described in 2005.
 Some studies address the potential of miRNAs
as diagnostic marker for BC subtypes and as
prognostic markers for patient outcomes.
 Most of these studies were conducted using
microarrays or RT-PCR and thus limited to a
subset of miRNAs.
WeiWu.Hani Choudhry, Next generation
sequencing in cancer
research.Chrpter12,springer2013
MicroRNAs
 miRNAs regulate many genes critical for
tumorgenesis.
 Studies claim expression of miRNA in BC
could unfold mysteries of tumorgenesis
pathways and identify potential prognostic
and diagnostic markers
miRNA & NGS application
Next Generation Sequencing
(NGS)
NGS main steps
 Template preparation
 Sequencing and imaging
 Data analysis
Choose your protocol
 There is a collection of next-generation sequencing (NGS)
sample preparation protocols, was compiled from the scientific
literature to demonstrate the wide range of scientific questions
that can be addressed by Illumina’s sequencing by synthesis
technology.
 it will inspire researchers to use these methods or to develop
new ones to address new scientific challenges.
 These methods were developed by users, so readers should
refer to the original publications for detailed descriptions and
protocols.
Which protocol fits your trial!
NGS methodology cascade
www.nature.com/jid/journalhttp://
a.html2013248/full/jid8/n133/v
Gene Expression Analysis Involves:
 High quality RNA extracted from available
biological samples.
 large scale microarrays.
Reading Arrays:
STATISTICAL Genetics
Analysis
You may need to read this :
http://www.transcriptome.ens.fr/sgdb/contact/download/200602_StatsP
uces_INAPG.pdf
Statistical Methods for Microarray Data
Analysis is going through:
1-Genetics
2- Experimental Design
3-Data Normalization
4- Gene Clustering
5-Differintial Analysis
6- Survival Classification
http://www.transcriptome.ens.fr/sgdb/contact/d
ownload/200602_StatsPuces_INAPG.pdf
Material & Methods
 Data Generation
Ex: Phenotype Data, Genotype Data, Gene
Expression Data…
 Statistical Analysis
Ex: Filtering, software package( WGCNA),
Gene Network mapping, functional
enrichment analysis of network…
Statistical Analysis:1- Filtering
 FILTERING METHOD: used to isolate active genes from
inactive genes by ranking them according to their
expression.
 FILTRING CRITERIA:
Mean: ranking genes based on their average
level of expression in the population.
Variance: ranking genes based on the
variability of their expression.
Sum Covariance: incorporating both
diagonal and off-diagonal elements of the
covariance matrix of gene expression.
WGCNA
 Weighted gene co-expression network analysis is a
systems biology method for describing the correlation
patterns among genes across microarray samples.
 Weighted correlation network analysis (WGCNA) can
be used for :
-Finding clusters (modules) of highly correlated
genes,
-Summarizing such clusters using the module
eigengene or an intramodular hub gene,
- Relating modules to one another and to external
sample traits (using eigengene network methodology),
- And for calculating module membership measures
http://labs.genetics.ucla.edu/horv
ath/CoexpressionNetwork/Rpacka
ges/WGCNA/
2- Explore and recognize Key
genes by Statistical computing: R
1) Construct a gene co-expression network
- Correlation, topological overlap
2) Identify modules
- Clustering, Dynamic Tree cut
3) Relate modules to external information
- Gene Ontology enrichment, correlation to
phenotype/linkage analyses
2-:Identify models: Clustering
 Cluster Analysis
Hierarchical
K-means
Self-organizing maps
Maximum likelihood/mixture models
 Graphical Displays
Dendrogram
Heatmap
Multidimensional scaling plot
Modules
Dynamic Tree
cut strategy
Tree Dendrogram
Fixed height
(System biology)
Functional enrichment
 Interpretation of genome-scale data
often includes looking for the biological
functions that are enriched in lists of
genes.
/http://bioinfow.dep.usal.es/coexpression
3:Relate Modules to external
information: Mapping
Mapping clusters to the genome at
different loci:
• High LOD score for cluster (s)
mapped to a lucs!!!
• Physical position of a QTL lucs on
the genome(quantitative trait
lucs)
• SNPs on the QTL
• Correlation analysis of the cluster
with phenotype
Discussing the outcomes
 Results
 Discussion
 Future Plan
More Statistics
There are much more steps that by the end give an
initial clues, guiding the researcher to shift in system
biology
Further investigations: Again to
trails!!
overview on Next generation sequencing in breast csncer

overview on Next generation sequencing in breast csncer

  • 1.
    Next Generation sequencing in Breast Cancer Research By:Seham Alshehri MSc Biochemical research
  • 2.
    OUTLINES  MicroRNA (miRNA)and breast cancer.  Next generation sequencing (NGS)  Data analysis
  • 3.
    Cancer overview  Canceris genetic disease Is a group of diseases characterized by uncontrolled cell division leading to a growth of abnormal cells Oncogenes=accelarators pedals TS genes=breake pedals
  • 4.
    miRNA in Cancer Recently discovered, miRNA is small RNA molecules that play important roles in gene expression.  These small genes make much smaller RNA that don’t make protein products but they react controlling the expression of other genes  Some new researches showed that miRNA play roles in controlling TS & oncogenes expression!
  • 5.
    miRNA in BC miRNAs dysregulation in BC was first described in 2005.  Some studies address the potential of miRNAs as diagnostic marker for BC subtypes and as prognostic markers for patient outcomes.  Most of these studies were conducted using microarrays or RT-PCR and thus limited to a subset of miRNAs. WeiWu.Hani Choudhry, Next generation sequencing in cancer research.Chrpter12,springer2013
  • 6.
    MicroRNAs  miRNAs regulatemany genes critical for tumorgenesis.  Studies claim expression of miRNA in BC could unfold mysteries of tumorgenesis pathways and identify potential prognostic and diagnostic markers
  • 7.
    miRNA & NGSapplication
  • 8.
  • 9.
    NGS main steps Template preparation  Sequencing and imaging  Data analysis
  • 10.
    Choose your protocol There is a collection of next-generation sequencing (NGS) sample preparation protocols, was compiled from the scientific literature to demonstrate the wide range of scientific questions that can be addressed by Illumina’s sequencing by synthesis technology.  it will inspire researchers to use these methods or to develop new ones to address new scientific challenges.  These methods were developed by users, so readers should refer to the original publications for detailed descriptions and protocols.
  • 11.
  • 12.
  • 13.
    Gene Expression AnalysisInvolves:  High quality RNA extracted from available biological samples.  large scale microarrays.
  • 14.
  • 15.
    You may needto read this : http://www.transcriptome.ens.fr/sgdb/contact/download/200602_StatsP uces_INAPG.pdf
  • 16.
    Statistical Methods forMicroarray Data Analysis is going through: 1-Genetics 2- Experimental Design 3-Data Normalization 4- Gene Clustering 5-Differintial Analysis 6- Survival Classification http://www.transcriptome.ens.fr/sgdb/contact/d ownload/200602_StatsPuces_INAPG.pdf
  • 17.
    Material & Methods Data Generation Ex: Phenotype Data, Genotype Data, Gene Expression Data…  Statistical Analysis Ex: Filtering, software package( WGCNA), Gene Network mapping, functional enrichment analysis of network…
  • 18.
    Statistical Analysis:1- Filtering FILTERING METHOD: used to isolate active genes from inactive genes by ranking them according to their expression.  FILTRING CRITERIA: Mean: ranking genes based on their average level of expression in the population. Variance: ranking genes based on the variability of their expression. Sum Covariance: incorporating both diagonal and off-diagonal elements of the covariance matrix of gene expression.
  • 19.
    WGCNA  Weighted geneco-expression network analysis is a systems biology method for describing the correlation patterns among genes across microarray samples.  Weighted correlation network analysis (WGCNA) can be used for : -Finding clusters (modules) of highly correlated genes, -Summarizing such clusters using the module eigengene or an intramodular hub gene, - Relating modules to one another and to external sample traits (using eigengene network methodology), - And for calculating module membership measures http://labs.genetics.ucla.edu/horv ath/CoexpressionNetwork/Rpacka ges/WGCNA/
  • 20.
    2- Explore andrecognize Key genes by Statistical computing: R 1) Construct a gene co-expression network - Correlation, topological overlap 2) Identify modules - Clustering, Dynamic Tree cut 3) Relate modules to external information - Gene Ontology enrichment, correlation to phenotype/linkage analyses
  • 21.
    2-:Identify models: Clustering Cluster Analysis Hierarchical K-means Self-organizing maps Maximum likelihood/mixture models  Graphical Displays Dendrogram Heatmap Multidimensional scaling plot
  • 22.
  • 23.
    (System biology) Functional enrichment Interpretation of genome-scale data often includes looking for the biological functions that are enriched in lists of genes.
  • 24.
    /http://bioinfow.dep.usal.es/coexpression 3:Relate Modules toexternal information: Mapping Mapping clusters to the genome at different loci: • High LOD score for cluster (s) mapped to a lucs!!! • Physical position of a QTL lucs on the genome(quantitative trait lucs) • SNPs on the QTL • Correlation analysis of the cluster with phenotype
  • 25.
    Discussing the outcomes Results  Discussion  Future Plan
  • 26.
    More Statistics There aremuch more steps that by the end give an initial clues, guiding the researcher to shift in system biology
  • 28.