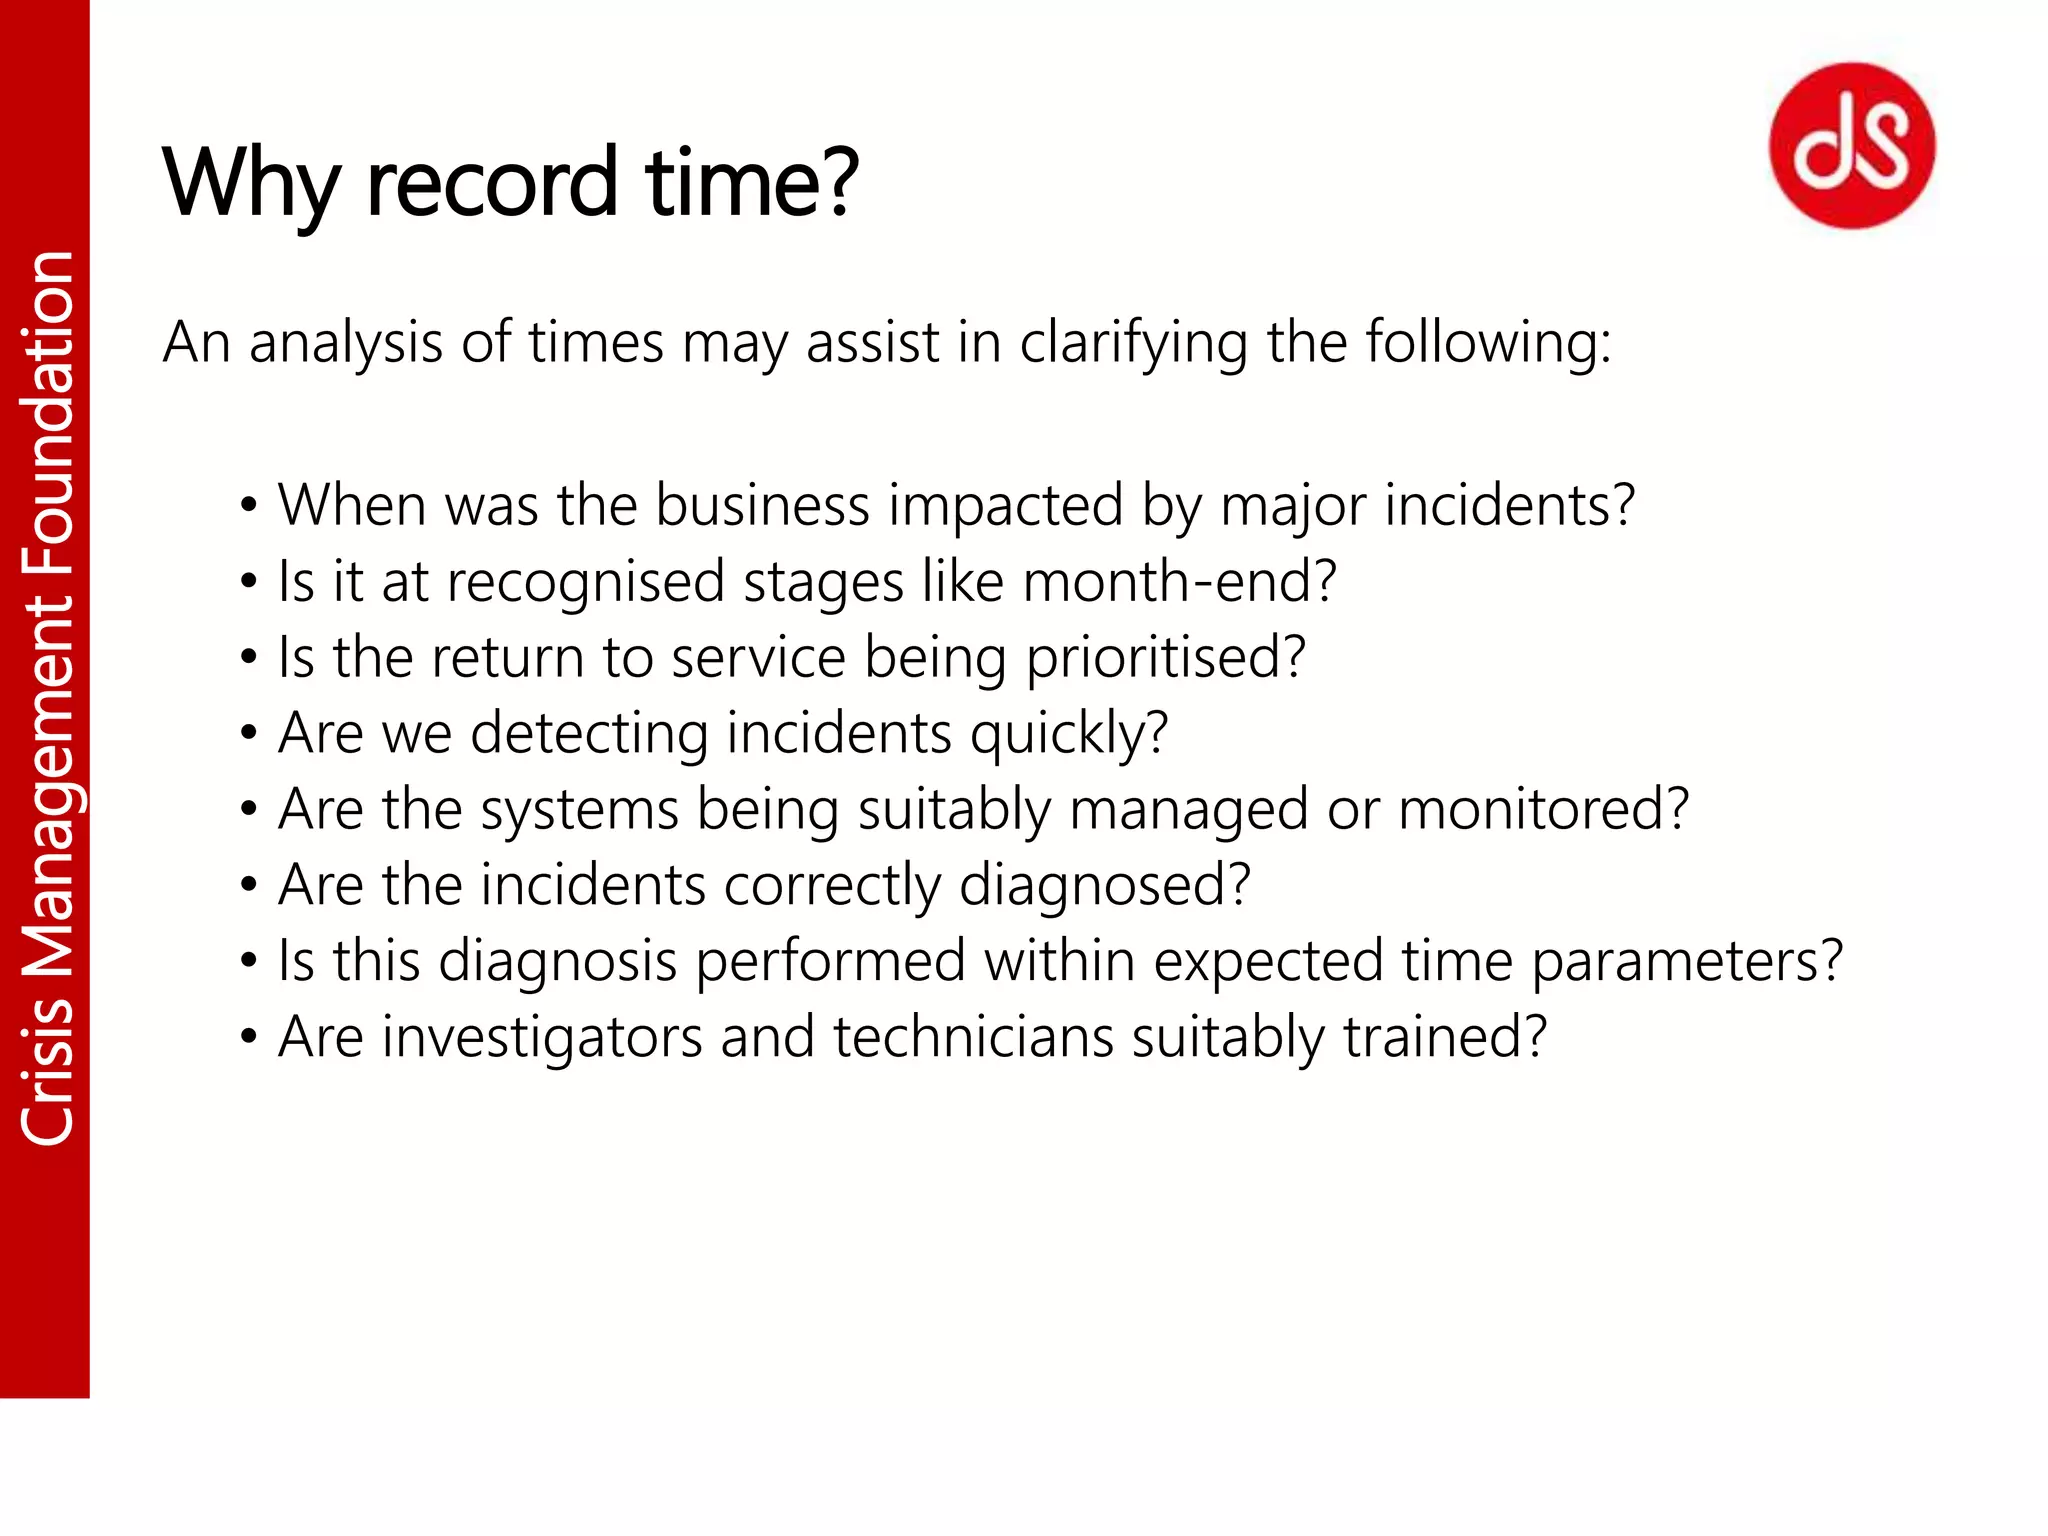
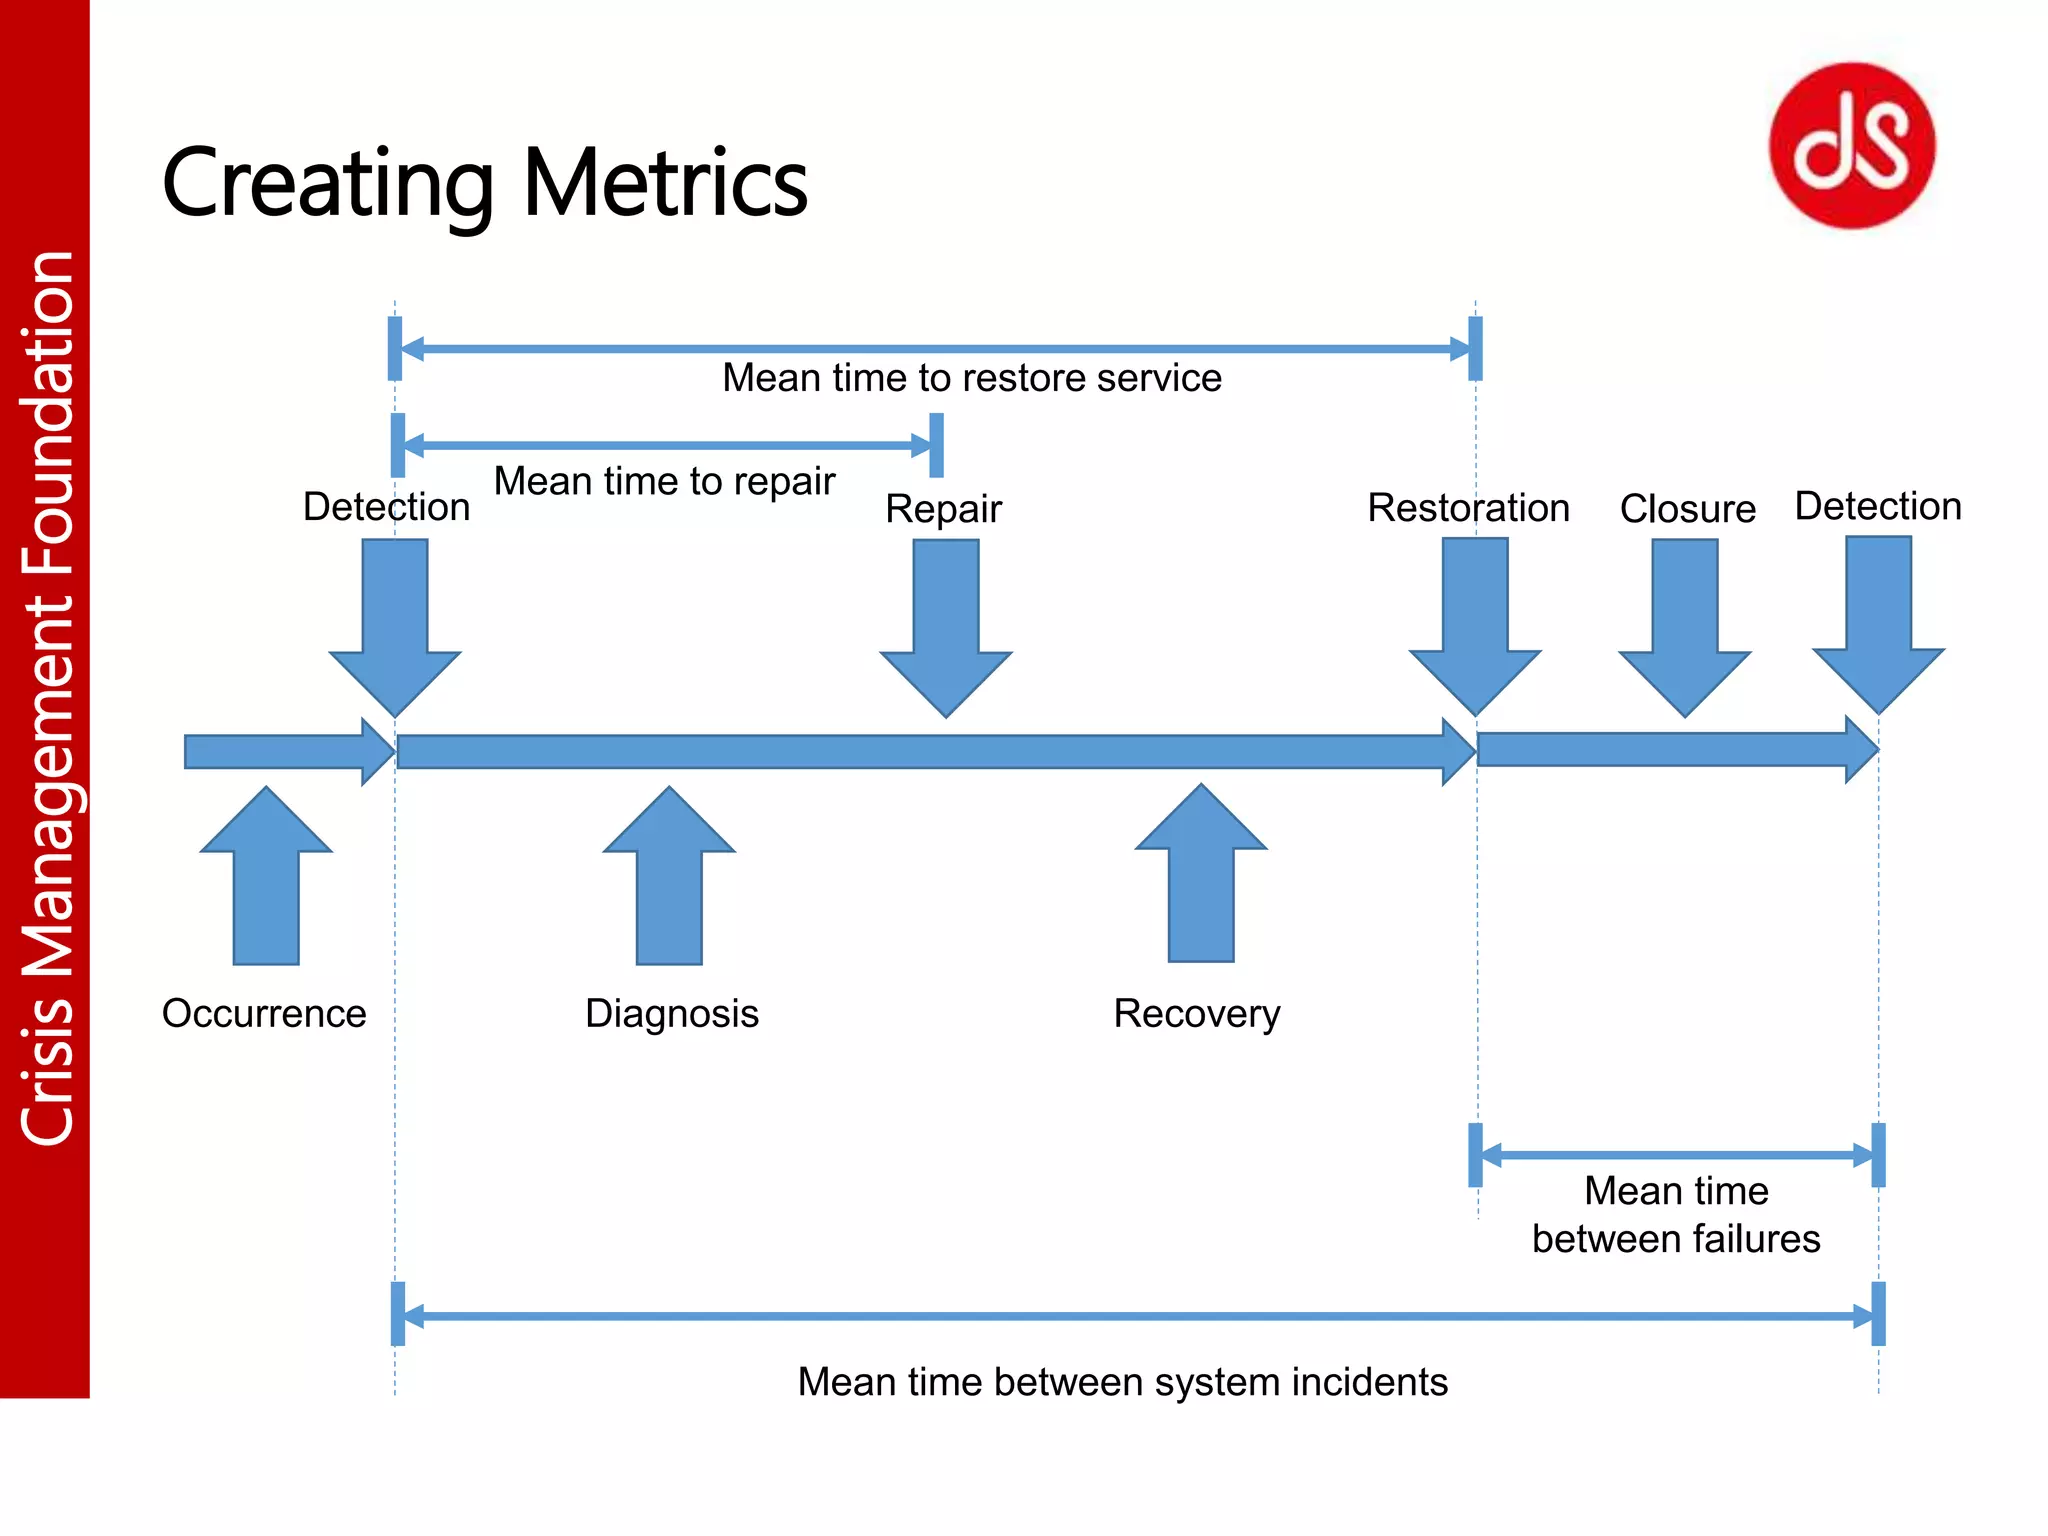
Preview of Crisis Management Foundation
The lifecycle of a crisis which includes a disaster, outage or Major Incident. The process and all aspects of the process of dealing with the lifecycle of a crisis is covered.
Reducing Product Development Risk with Reliability Engineering MethodsWilde Analysis Ltd.
Overview of how reliability engineering methodology and software tools can help companies manage risk during product development and improve performance.
Presented at the Interplas'2011 exhibition and conference at the NEC on 27th October 2011 by Mike McCarthy.
This presentation looks at how ‘Reliability Engineering’ tools and methods are used to reduce risk in a typical product development lifecycle involving both plastic and metallic components. These tools range in complexity from simple approaches to managing product reliability data to the application of sophisticated simulation methods on large systems with complex duty cycles. Three examples are:
- Failure Mode Effects (and Criticality) Analysis (FMECA) to identify, manage and reuse information on what could go wrong with a design or manufacturing process and how to avoid it
- Design of Experiments for optimising performance through a structured and efficient study of parameters that affect the product or manufacturing process (e.g. injection moulding)
- Accelerated Life Testing to identify potential long term failure modes of products released to market within a shortened development time.
We will explore how gathering enough of the right kind of data and applying it in an intelligent way can reduce risk, not only in plastic product design and manufacture, but also in managing the associated supply chain and in the ‘Whole Life Management’ of products (including warranties). Furthermore, we will show how ‘sparse’ data gathered from previous or similar products, such as field/warranty reports, engineering testing data and supplier data sheets, as well as FEA, CFD and injection moulding/extrusion simulation, can inform and positively influence new product design processes from concept stage onwards.
Short presentation that tries to explain what As Late as Possible constraint is and what it does. I hope to clarify some of the misconceptions surrounding its use. Please send your feedback if the information provided was useful.
Advanced Regulatory Control (ARC) Control Scheme Examples: Handling volatile loads using PID controllers and custom programming within the control system. Includes: Sulfur recovery units, Boilers/Steam distribution, Hydrogen plants, Syngas plants, Air compressors, Acid gas handling, Waste gas incinerators and wastewater treatment.
http://www.aiche.org/ccps/conferences/global-congress-on-process-safety/2015
The Perfect STOrm in nature is a weather phenomenon where three systems converge on each other over the ocean to create havoc, making it nearly impossible for ocean-going vessels to navigate. Since our primary focus is on navigating complex, risky and expensive projects, it’s only fitting that we use this concept to demonstrate how to avoid, or manage STO Events in the petrochemical, oil & gas, and mining sectors.
Deep Dive into Disaster Recovery in the CloudBluelock
Learn how Recovery-as-a-Service actually works. Cloud-based Recovery-as-a-Service is the latest in disaster recovery technology. Recovery-as-a-Service (RaaS) is the ideal on-ramp to cloud to solve your need to recover quickly, easily and efficiently after a disaster strikes.
LEARN HOW TO:
- Seed or migrate your data to the cloud
- Set your RTO and RPO policies
- Recover an app remotely or across the country
- Assess workloads and size your project
- Budget for cloud-based DR
Public Authorities and Private Companies have developed good emergency planning suited to face emergency risks and situations that can potentially involve their jurisdiction. Yet, only a part of them had the opportunity to actually test the emergency plans in a productive, credible and effective way. This conference brings the participant through best practices in organizing several types of
emergency plan tests, from field activities to virtual reality tools.
Online Crisis Management + Case Studies - Elkottab WorkshopAhmed Maher
Online Crisis Management + Case Studies - Elkottab Workshopز
Please note that this presentation was designed to fit into a workshop, so not everything written in the slides, just headlines & less descriptions.
If you wish to have more explanations please don't hesitate to contact me as shown on my profile here.
World-Class Incident Response ManagementKeith Smith
Taken from principles learned over many years at several companies including Microsoft, this presentation describes the process of creating a strongly defined and repeatable Incident Response Management pipeline. The goal of this presentation is to increase companies ability to maintain healthy cloud services throughout the entire application lifecycle. It describes how companies should identify, respond to, and manage incidents, on-call procedures, and organizational implementations that reduce incident fatigue and keep services consistently reliable and available.
Disaster Recovery: the process related to preparing for recovery or planning critical technology infrastructure before a natural or human disaster occurs.
Systeme de contrôle - Vos opérateurs sont trop occupés pour s'occuper de ce q...Laurentide Controls
Présentation des meilleures pratiques et de la norme ISA 18.2, des outils permettant de réduire le nombre d'alarmes et aux opérateurs d'être plus efficaces.
Process Mining and Predictive Process MonitoringMarlon Dumas
Presentation delivered at the Second Colombian Forum on Business Process Management, University of Los Andes, Bogotá, 22 June 2018 - https://sistemas.uniandes.edu.co/en/foros-isis/temas-foros-isis/bpm/foro-2/80-foros-isis/bpm
Similar to DS Crisis Management Foundation - Lifecycle (20)
DevOps and Testing slides at DASA ConnectKari Kakkonen
My and Rik Marselis slides at 30.5.2024 DASA Connect conference. We discuss about what is testing, then what is agile testing and finally what is Testing in DevOps. Finally we had lovely workshop with the participants trying to find out different ways to think about quality and testing in different parts of the DevOps infinity loop.
Elevating Tactical DDD Patterns Through Object CalisthenicsDorra BARTAGUIZ
After immersing yourself in the blue book and its red counterpart, attending DDD-focused conferences, and applying tactical patterns, you're left with a crucial question: How do I ensure my design is effective? Tactical patterns within Domain-Driven Design (DDD) serve as guiding principles for creating clear and manageable domain models. However, achieving success with these patterns requires additional guidance. Interestingly, we've observed that a set of constraints initially designed for training purposes remarkably aligns with effective pattern implementation, offering a more ‘mechanical’ approach. Let's explore together how Object Calisthenics can elevate the design of your tactical DDD patterns, offering concrete help for those venturing into DDD for the first time!
Smart TV Buyer Insights Survey 2024 by 91mobiles.pdf91mobiles
91mobiles recently conducted a Smart TV Buyer Insights Survey in which we asked over 3,000 respondents about the TV they own, aspects they look at on a new TV, and their TV buying preferences.
GraphRAG is All You need? LLM & Knowledge GraphGuy Korland
Guy Korland, CEO and Co-founder of FalkorDB, will review two articles on the integration of language models with knowledge graphs.
1. Unifying Large Language Models and Knowledge Graphs: A Roadmap.
https://arxiv.org/abs/2306.08302
2. Microsoft Research's GraphRAG paper and a review paper on various uses of knowledge graphs:
https://www.microsoft.com/en-us/research/blog/graphrag-unlocking-llm-discovery-on-narrative-private-data/
UiPath Test Automation using UiPath Test Suite series, part 4DianaGray10
Welcome to UiPath Test Automation using UiPath Test Suite series part 4. In this session, we will cover Test Manager overview along with SAP heatmap.
The UiPath Test Manager overview with SAP heatmap webinar offers a concise yet comprehensive exploration of the role of a Test Manager within SAP environments, coupled with the utilization of heatmaps for effective testing strategies.
Participants will gain insights into the responsibilities, challenges, and best practices associated with test management in SAP projects. Additionally, the webinar delves into the significance of heatmaps as a visual aid for identifying testing priorities, areas of risk, and resource allocation within SAP landscapes. Through this session, attendees can expect to enhance their understanding of test management principles while learning practical approaches to optimize testing processes in SAP environments using heatmap visualization techniques
What will you get from this session?
1. Insights into SAP testing best practices
2. Heatmap utilization for testing
3. Optimization of testing processes
4. Demo
Topics covered:
Execution from the test manager
Orchestrator execution result
Defect reporting
SAP heatmap example with demo
Speaker:
Deepak Rai, Automation Practice Lead, Boundaryless Group and UiPath MVP
Connector Corner: Automate dynamic content and events by pushing a buttonDianaGray10
Here is something new! In our next Connector Corner webinar, we will demonstrate how you can use a single workflow to:
Create a campaign using Mailchimp with merge tags/fields
Send an interactive Slack channel message (using buttons)
Have the message received by managers and peers along with a test email for review
But there’s more:
In a second workflow supporting the same use case, you’ll see:
Your campaign sent to target colleagues for approval
If the “Approve” button is clicked, a Jira/Zendesk ticket is created for the marketing design team
But—if the “Reject” button is pushed, colleagues will be alerted via Slack message
Join us to learn more about this new, human-in-the-loop capability, brought to you by Integration Service connectors.
And...
Speakers:
Akshay Agnihotri, Product Manager
Charlie Greenberg, Host
Software Delivery At the Speed of AI: Inflectra Invests In AI-Powered QualityInflectra
In this insightful webinar, Inflectra explores how artificial intelligence (AI) is transforming software development and testing. Discover how AI-powered tools are revolutionizing every stage of the software development lifecycle (SDLC), from design and prototyping to testing, deployment, and monitoring.
Learn about:
• The Future of Testing: How AI is shifting testing towards verification, analysis, and higher-level skills, while reducing repetitive tasks.
• Test Automation: How AI-powered test case generation, optimization, and self-healing tests are making testing more efficient and effective.
• Visual Testing: Explore the emerging capabilities of AI in visual testing and how it's set to revolutionize UI verification.
• Inflectra's AI Solutions: See demonstrations of Inflectra's cutting-edge AI tools like the ChatGPT plugin and Azure Open AI platform, designed to streamline your testing process.
Whether you're a developer, tester, or QA professional, this webinar will give you valuable insights into how AI is shaping the future of software delivery.
LF Energy Webinar: Electrical Grid Modelling and Simulation Through PowSyBl -...DanBrown980551
Do you want to learn how to model and simulate an electrical network from scratch in under an hour?
Then welcome to this PowSyBl workshop, hosted by Rte, the French Transmission System Operator (TSO)!
During the webinar, you will discover the PowSyBl ecosystem as well as handle and study an electrical network through an interactive Python notebook.
PowSyBl is an open source project hosted by LF Energy, which offers a comprehensive set of features for electrical grid modelling and simulation. Among other advanced features, PowSyBl provides:
- A fully editable and extendable library for grid component modelling;
- Visualization tools to display your network;
- Grid simulation tools, such as power flows, security analyses (with or without remedial actions) and sensitivity analyses;
The framework is mostly written in Java, with a Python binding so that Python developers can access PowSyBl functionalities as well.
What you will learn during the webinar:
- For beginners: discover PowSyBl's functionalities through a quick general presentation and the notebook, without needing any expert coding skills;
- For advanced developers: master the skills to efficiently apply PowSyBl functionalities to your real-world scenarios.
The Art of the Pitch: WordPress Relationships and SalesLaura Byrne
Clients don’t know what they don’t know. What web solutions are right for them? How does WordPress come into the picture? How do you make sure you understand scope and timeline? What do you do if sometime changes?
All these questions and more will be explored as we talk about matching clients’ needs with what your agency offers without pulling teeth or pulling your hair out. Practical tips, and strategies for successful relationship building that leads to closing the deal.
Accelerate your Kubernetes clusters with Varnish CachingThijs Feryn
A presentation about the usage and availability of Varnish on Kubernetes. This talk explores the capabilities of Varnish caching and shows how to use the Varnish Helm chart to deploy it to Kubernetes.
This presentation was delivered at K8SUG Singapore. See https://feryn.eu/presentations/accelerate-your-kubernetes-clusters-with-varnish-caching-k8sug-singapore-28-2024 for more details.
State of ICS and IoT Cyber Threat Landscape Report 2024 previewPrayukth K V
The IoT and OT threat landscape report has been prepared by the Threat Research Team at Sectrio using data from Sectrio, cyber threat intelligence farming facilities spread across over 85 cities around the world. In addition, Sectrio also runs AI-based advanced threat and payload engagement facilities that serve as sinks to attract and engage sophisticated threat actors, and newer malware including new variants and latent threats that are at an earlier stage of development.
The latest edition of the OT/ICS and IoT security Threat Landscape Report 2024 also covers:
State of global ICS asset and network exposure
Sectoral targets and attacks as well as the cost of ransom
Global APT activity, AI usage, actor and tactic profiles, and implications
Rise in volumes of AI-powered cyberattacks
Major cyber events in 2024
Malware and malicious payload trends
Cyberattack types and targets
Vulnerability exploit attempts on CVEs
Attacks on counties – USA
Expansion of bot farms – how, where, and why
In-depth analysis of the cyber threat landscape across North America, South America, Europe, APAC, and the Middle East
Why are attacks on smart factories rising?
Cyber risk predictions
Axis of attacks – Europe
Systemic attacks in the Middle East
Download the full report from here:
https://sectrio.com/resources/ot-threat-landscape-reports/sectrio-releases-ot-ics-and-iot-security-threat-landscape-report-2024/
Kubernetes & AI - Beauty and the Beast !?! @KCD Istanbul 2024Tobias Schneck
As AI technology is pushing into IT I was wondering myself, as an “infrastructure container kubernetes guy”, how get this fancy AI technology get managed from an infrastructure operational view? Is it possible to apply our lovely cloud native principals as well? What benefit’s both technologies could bring to each other?
Let me take this questions and provide you a short journey through existing deployment models and use cases for AI software. On practical examples, we discuss what cloud/on-premise strategy we may need for applying it to our own infrastructure to get it to work from an enterprise perspective. I want to give an overview about infrastructure requirements and technologies, what could be beneficial or limiting your AI use cases in an enterprise environment. An interactive Demo will give you some insides, what approaches I got already working for real.
8. CrisisManagementFoundation
Recording of time
• When working with problems time is the most crucial attribute to
record.
• The time an event happens, the time between events provide the
most significant clues into a problem’s source.
• As an example, it is important to known when the event occurred
as opposed to when it was detected. The two might not
necessarily have occurred at the same time and that in itself could
be a problem.
9. CrisisManagementFoundation
Why record time?
An analysis of times may assist in clarifying the following:
• When was the business impacted by major incidents?
• Is it at recognised stages like month-end?
• Is the return to service being prioritised?
• Are we detecting incidents quickly?
• Are the systems being suitably managed or monitored?
• Are the incidents correctly diagnosed?
• Is this diagnosis performed within expected time parameters?
• Are investigators and technicians suitably trained?
10. CrisisManagementFoundation
Why record time cont.
• Are repair processes initiated within suitable time limits after
diagnosis?
• Is there a logistics issue?
• Are service restore times for the client adequate?
• Is there an issue around continuity or outdated technology?
• Does the system start processing in an acceptable time period
after being restored?
• Are there cumbersome system interface issues?
11. CrisisManagementFoundation
Timelines (date and times) the
expanded incident lifecycle
Time when incident started (actual – something
has happened to a CI or a risk event has occurred)
<dd/mm/yy> <hh:mm>
Time when incident was detected (incident is
detected either by monitoring tools, IT personnel or, worse case,
the user/customer)
<dd/mm/yy> <hh:mm>
Time of diagnosis (underlying cause – we know what
happened?)
<dd/mm/yy> <hh:mm>
Time of repair (process to fix failure started or corrective
action initiated)
<dd/mm/yy> <hh:mm>
Time of recovery (component recovered – the CI is back
in production – business ready to be resumed)
<dd/mm/yy> <hh:mm>
Time of restoration (normal operations resume – the
service is back in production)
<dd/mm/yy> <hh:mm>
Time of workaround (Service is back in production
with workaround)
<dd/mm/yy> <hh:mm>
Time of escalation (to problem management team) <dd/mm/yy> <hh:mm>
Time period service was unavailable (SLA measure) <minutes>
Time period service was degraded (SLA measure) <minutes>
12. CrisisManagementFoundation
Measuring time
How do you improve?
Understand the different time periods from outage to full resolution
and which ones are not optimal.
• Detection time - between when outage occurred and when it was
known (does the monitoring tool work?) (Do you detect HD RAID
failures?) (Do you detect redundant network path failures?)
• Diagnostic time – working out what went wrong. How good are
your troubleshooting skills. Have you identified the correct
causes?
• Ready to repair – being able to gather all required resources to fix
what is broken. (Are the parts available?)
13. CrisisManagementFoundation
Measuring time cont.
• Recovery time – the failed components have been fixed and are
ready to be placed back in production.
• Restoration time – the system is back in production.
• Notification times – clients and users of the system are informed
e.g. do they know they can transact?
• Risk profile completion time – time to gather and analyse risk
associated with incident.
• Counter measures implementation – time that relevant counter
measures are implement to reduce identified threats.
14. CrisisManagementFoundation
Representing time
• Understand where the problem is by using graphs.
• Useful to aggregate these statistics over multiple Major incidents
to understand trends
• Extrapolate statistics that will define and set appropriate SLA times
16. CrisisManagementFoundation
Measurements
• The typical values of the above is expressed as 9s (from two 9s to five
9s). Here is an example:
• 99% availability: 5,256 minutes (87.6 hours) / year downtime
• 99.5% availability: 2,628 minutes (43.8 hours) / year downtime
• 99.9% availability: 528 minutes (8.8 hours) / year downtime
• 99.99% availability: 53 minutes / year downtime
• 99.999% availability: 5 minutes / year downtime
• The above values are mapped to the following terms by Gartner:
• Normal system availability is 99.5%
• High system availability is 99.9%
• Fault system resilience is 99.99%
• Fault tolerance is 99.999%
• Continuous processing is as close to 100% as possible.
18. CrisisManagementFoundation
Detection
• When a disaster has occurred, it is important to record the events –
numerous mechanisms are possible dependant on the outage.
• It is possible to use video surveillance or even Smartphone cameras to
take pictures of what has occurred.
• This might help as a later diagnosis and root causation could be
expedited by a review of the material.
• A source of detection are also logs, typically SYSLOG or the logs from
applications such as web servers (use ELK to create a mission control
dashboard!
• Tools like NETFLOW can assist in providing the precise time of outages
and also be a primary tool for root causation.
• Often it will assist to have screen scraping or enforce logging of access
(such as log files when using SSH access and putty).
• A disproportionate number of incidents being logged at the Service Desk
are a potential indicator for a major incident.
19. CrisisManagementFoundation
Tools and Retrofit
• When an outage happens it is not possible to retrofit a detection
tool.
• Surveillance of IT needs to be in place.
• Gathering of SNMP metrics can provide a guideline for usage and
congestion.
• ICMP provides a means of detecting failures and degradation
(latency).
• Great poller for ICMP and SNMP is Opmantek’s NMIS.
• Reference the section on tools in this course.
20. CrisisManagementFoundation
IS / IS NOT detection tool
Description
IS
(Observation):
IS NOT
(Observation):
What is the defect?
Which processes are impacted?
Where in the processes has the
failure occurred ?
Who is affected?
When did it happen?
How frequently did it happen?
Is there a pattern?
How much is it costing?
21. CrisisManagementFoundation
Alternative means
• Detection from the Service Desk - display call centre queues from
Service Desk to detect increased call volumes which can be an
indication of problems.
• Use social media such as tweetdeck to view notifications from own
company clients; utilities such as power and water; local news or
traffic.
23. CrisisManagementFoundation
Diagnose
• One of the primary triggers for an outage is a change in the
environment.
• The first step in should be to determine if there has been a change.
• The importance of recording precise times in the major incident
lifecycle is now highlighted as this is used to correlate the outage to
when the last known change was made.
• Unauthorised changes also need to be investigated by reviewing
anomalies, preferably in dashboards.
• A key part of diagnosis is referring to the system documentation to
see what should have happened.
• Put eyes on the problem as soon as possible.
• As part of the diagnosis process, it’s important to refer to previous
major incident reports to assess whether the issue has occurred
previously and whether the same actions can be followed to solve
the issue.
26. CrisisManagementFoundation
The predecessor of the Flying Fortress:
the birth of the checklist
The Air Corps faced arguments that the
aircraft was too big to handle. The Air
Corps, however, properly recognised
that the limiting factor here was human
memory, not the aircraft’s size or
complexity. To avoid another accident,
Air Corps personnel developed
checklists the crew would follow for
take-off, flight, before landing, and
after landing. The idea was so simple,
and so effective, that the checklist was
to become the future norm for aircraft
operations. The basic concept had
already been around for decades, and
was in scattered use in aviation
worldwide, but it took the Model 299
crash to institutionalize its use.
“The Checklist,” Air Force Magazine
27. CrisisManagementFoundation
Checklists
• Execute checklist to diagnose failures and outages.
• Checklist can evolve to include items from lessons learnt.
• The most common and often diagnosed checks should be
prioritized and executed first.
• Mechanism to transfer skill and knowledge (checklist should
reflect the knowledge base).
• Ability to improve time for diagnosis.
• Examples of areas for checklists includes
networks, data centres and information security.
• Refer to the Appendix for a Network
Troubleshooting checklist.
the original checklist
28. CrisisManagementFoundation
Atul Gawande: How to Make Doctors
Better
Surgeon and author Atul Gawande says
the very vastness of our knowledge gets in
the way: doctors make errors because they
simply can't remember it all.
The solution isn't fancier technology or
more training.
It's as simple as an old-fashioned checklist,
like those used by pilots, restaurateurs and
construction engineers.
When his research team introduced a
checklist in eight hospitals in 2008, major
surgery complications dropped 36% and
deaths plunged 47%.
from Time magazine
29. The New England Journal of Medicine supports the use of checklists during a surgical
emergency for better safety performance results.
In a study of 100Michigan
hospitals 30% of the time,
surgical teams skipped one of these
five essential steps:
• washing hands
• cleaning the site
• draping the patient
• applying a sterile dressing
• donning surgical mask, gloves
and gown
But after 15 months of using a
simple checklist, the hospitals cut
their infection rate from 4 percent
of cases to zero, saving
1,500 lives
and nearly
$200 million
30. CrisisManagementFoundation
Put eyes on the problem
• The process followed to solve a murder
is no different to the process followed
when solving a crisis.
• The location where the problem has
occurred needs to be investigated.
• It is preferable to secure the area and
gather all evidence and log it, just like a
crime scene.
• This principle is also used in production
and manufacturing environments.
31. CrisisManagementFoundation
Crime scene (location of problem)
Taiichi Ohno, who refined the production systems at (TPS) Toyota
Production System, would take new managers and engineers to the
factory and draw a chalk circle on the floor. The subordinate would
be told to stand in the circle and to observe and note down what
he saw. When Ohno returned he would check - if the person in the
circle had not seen enough he would be asked to keep observing.
Ohno was trying to imprint upon his future managers and
engineers that the only way to truly understand what happens in
the factory was to go there. It was here that value was added and
here that waste could be observed. This was known as Genchi
Genbutsu and is a primary method used for solving problems. If
the problem exists in the factory then it needs to be understood
and solved in the factory and not on the top floors of some office
block or city skyscraper.
32. CrisisManagementFoundation
Genchi Genbutsu 現地現物 – go see
• Genchi Genbutsu sets out the expectation that it is a requirement
to personally evaluate operations so that a first-hand
understanding of situations and problems is derived.
• Genchi Genbutsu means "go and see" and it is a key principle of
the Toyota Production System. It suggests that in order to truly
understand a situation one needs to go to gemba (現場) or, the
'real place' - where work is done.
33. CrisisManagementFoundation
Recording the event
• An investigator will record the observations
of eye witnesses.
• These records serve as a basis for review.
• What seems insignificant now, might be
crucial when more becomes known about
the problem.
• Determine:
• What
• Why
• When
• Who
• Where
• How
34. CrisisManagementFoundation
Prevailing conditions and business
impact
• Take note of the prevailing conditions.
• It is also important to take a snapshot of the prevailing conditions at
the time of the problem. If the problem remains unresolved and it
happens again, a comparison of prevailing conditions might provide
significant insight.
• These might be economic or even weather related. Don’t discount
prevailing conditions.
• If it is a technical problem it is important to determine and measure
the business impact.
• This needs to be assessed from a client and an internal organisational
perspective.
• When the probability of an occurrence is low, it is incorrect to assume
that it will only happen way into the future.
• Major incidents can happen anytime within the probability period and
not at the end of the probability period.
35. CrisisManagementFoundation
Prevailing conditions
On the morning of Monday, 29th August 2005 hurricane Katrina hit the
Gulf coast of the US.
New Orleans, Louisiana suffered the main brunt of the hurricane but the
major damage and loss of life occurred when the levee system
catastrophically failed.
Floodwaters surged into 80% of the city and lingered for weeks. At least
1,836 people lost their lives in the hurricane and resulting floods, making
it the largest natural disaster in the history of the United States. Video or
better pic.
36. CrisisManagementFoundation
Prevailing conditions
On July 31, 2006 the Independent Levee Investigation Team
released a report on the Greater New Orleans area levee failures.
In the report, it was noted that the hypothetical model storm upon
which storm protection plans were based, (called the Standard
Project Hurricane or SPH) model was simplistic.
The report found that an inadequate network of levees, flood walls,
storm gates and pumps were established.
The report also found that
“the creators of the standard project hurricane, in an attempt to
find a representative storm, actually excluded the fiercest storms
from the database.”
Quote source
37. CrisisManagementFoundation
Visualization
• It is one thing collecting data of a problem and recording it, but a
totally different skill is required to interpret it.
• Here you look at visual representations by graphing the data in
an appropriate fashion. As an example, bar graphs are often
referred to as Manhattan graphs.
• Just as with the Manhattan skyline where the large buildings are
prominent, so too is those significant bits of data that is
represented in a graph.
• Convert the data to a visual representation and this will aid in the
process of solving the problems.
• The visualisation present in the CMOC should always be designed
to assist in diagnosis.
39. CrisisManagementFoundation
Workarounds (aka fire fighting)
Something that is important especially when the crisis is significant
is to realise that you need to be skilled in fighting fires. Meaning,
the problem might require an immediate workaround to maintain
service. As such you might not be solving the problem but on a
temporary basis alleviating any further negative consequences.
41. CrisisManagementFoundation
Repair
Following diagnosis are the activities associated with repairing the
configuration item (CI) that failed. Hardware may need to be
ordered, vendors contacted, consultants brought in, and so forth.
The biggest gap here is understanding how a given CI was
configured. Groups with accurate configuration management
systems (CMS) know right away whereas others will need to
perform forensic archaeology to try and determine that; losing
valuable time in the process.
42. CrisisManagementFoundation
Recover
Once the CI is repaired, it must be brought back online including
reloading any necessary images, applications and/or data. Again,
rapid accurate knowledge about CIs will speed this up as will
having standard builds/images to restore from versus building a
unique system from scratch.
43. CrisisManagementFoundation
Restore
This is the final step and is known as the restoration of the service.
It may be that related CIs must be rebooted in a certain order to
re-establish connectivity, and so on. Service design documentation
and/or standard operating procedures that are readily accessible
and accurate will aid groups restoring services.
44. CrisisManagementFoundation
Collation
• There is a requirement to collate the information from each of the
steps in the Major Incident lifecycle.
• This information is utilised as the basis of the Major Incident
Report.
• This collation involves all members of the Tiger Team and is
typically managed and owned by the SLM/SDM or Process
Owner.
• This is generally under a time constraint dictated by a service
level agreement.
• The collated report is always issued in draft first and reviewed by
all internal parties.
45. CrisisManagementFoundation
Major Incident reporting
• Generate the Major Incident report.
• Contain a detailed description of the outage/failure; timing;
sequencing; the actions taken; the people involved; resources; next
steps and identified/remaining actions.
• Typically a draft is issued to the business/client and discussed for
agreement or update.
• A final report is then issued to the client/business.
• There may be resulting actions which need to be dealt with as a
service request; problem; project or a Problem for further analysis.
• The CMDB (KEDB) is updated if there is one, or a suitable repository.
• If required, this may be fed into the Problem Management Process for
further analysis.
Eddy Merckx, born 17 June 1945, is a Belgian considered to be the greatest pro-cyclist ever. He sells his own line of bicycles and I have owned one since 1997. He is one of my heroes and his never-equaled domination while cycling led to his nickname, when the daughter of one French racer said, "That Belgian guy, he doesn't even leave you the crumbs. He's a real cannibal."
The French magazine Vélo described Merckx as
"the most accomplished rider that cycling has ever known." Merckx, who turned professional in 1965, won the World Championship thrice, the Tour de France and Giro d'Italia five times each, and the Vuelta a España once. He also won each of the professional cycling's classic "monument" races at least twice.
Merckx dominated his first Tour de France winning by 17 minutes, 54 seconds. But it was Stage 17 that was most emblematic. Though comfortably in the yellow jersey, victory assured if he merely followed his rivals as modern champions do, Merckx risked blowing up and losing the Tour when he attacked over the top of the Tourmalet then rode solo for 130 kilometres. He won the stage by nearly eight minutes.
Merckx set the world hour record on 25th October 1972. Merckx covered 49.431 km at high altitude in Mexico City using a Colnago bicycle to break the record, which had been lightened to a weight of 5.75 kg. Over 15 years starting in 1984, various racers improved the record to more than 56 km. However, because of the increasingly exotic design of the bikes and position of the rider, these performances were no longer reasonably comparable to Merckx's achievement. In response, the UCI in 2000 required a standard or more traditional bike to be used. When time trial specialist Chris Boardman, who had retired from road racing and had prepared himself specifically for beating the record, had another go at Merckx's distance 28 years later, he beat it by slightly more than 10 meters (at sea level). To date, only Boardman and Ondřej Sosenka have improved on Merckx's record using traditional equipment.
Although Merckx's great moments were alone, he had those leadership qualities of when it countered he was motivated to win. He didn't just win, he did the best he could, which exceeded expectations like in that first Tour de France win. He was also like Amundsen (read about him here) in that he was an expert in the use of his equipment which was highlighted when he set the benchmark for the world one hour. My Merckx bike is held in such high regard that I have it in my bedroom to prevent it being stolen!
In the major incident process, timelines are the most important aspect of the process to get right. The reason is that it is the best source of data for problem management, which oversees the process from a quality viewpoint. Deviations from the norm are clear indicators of underlying issues.
The timelines in the major incident process are aligned with the ITIL process as these timelines in ITIL are referred to as the Expanded Incident Lifecycle.
The Expanded Incident Lifecycle has a path of Incident -> Detect -> Diagnose -> Repair -> Restore -> Recover. The times of each of these events should be diligently recorded as well as the time of when a workaround becomes available and is implemented.
For many IT people the times are confusing as they misunderstand the naming of the terms in the Expanded Incident Life cycle. To better explain these terms, we'll use an analogy, of riding a bike.
I am riding my bike. It is a nice Sunday morning ride in the country side. The Incident happens, the rear wheel experiences a puncture. This is the time of the Incident. As it is the rear wheel I do not notice it immediately, and only detect the incident when the road starts to feel extremely bumpy. This is the detection time. I stop my bicycle and dismount. My mates with me also do the same. We discuss the issue. It is clear that it is a puncture and it was caused by a small nail which is clearly visible. We can remove the nail, and the tire will still be usable but we need to either repair the tube or replace it. I have a spare tube in my saddle bag, and we agree that replacing the tube is the quickest and best way to continue on our journey. This is the time of diagnosis. We decide that this is a good time to have some water and cool drink before we start replacing the tube. We also notice that the incident has happened at a very scenic location so we take a few pictures. Finally, we start removing the wheel. This is the time of repair. We remove the wheel, remove the tire, replace the tube and reattach the tire. We put the wheel back on the bike. This is the time of restore. At this point we all decide to answer the call of nature. We then mount our bikes and continue our ride. This is the point and time of recovery.
If we analyse the time lines, in the incident above, we will notice a deviation from the norm in two time periods, i.e. time to repair and time to recover. This is the time where we had some drinks and took a pit stop. In the context of our ride this wasn't a big deal, but if we were in a competitive race we in all probability would have skipped those actions. In a actual IT incident the same principals are applied.
Diagram of the Major incident process
The notifications and escalations including the interaction with the service desk and clients is handled in the communications chapter.
The best example of how time solved a problem is illustrated by that of Harrison, a carpenter. Time solved the problem of determining longitude and hence your exact position on Earth. Longitude a geographic coordinate that specifies the east-west position of a point on the Earth's surface and is best determined using time measurements. Galileo Galilei proposed that with accurate knowledge of the orbits of the moons of Jupiter one could use their positions as a universal clock to determine of longitude, but this was practically difficult especially at sea. An English clockmaker, John Harrison, invented the marine chronometer, helping solve the problem of accurately establishing longitude at sea, thus revolutionising safe long distance travel. Harrison’s watches were rediscovered after the First World War, restored and given the designations H1 to H5 by Rupert T. Gould. Harrison completed the manufacturing of H4 in 1759.
When working with problems time is the most crucial attribute to record.
The time an event happens, the time between events provide the most significant clues into a problems source.
As an example, it is important to known when the event occurred as opposed to be it was detected. The two might not necessarily have occurred at the same time and could in itself be a problem.
An analysis of these times will assist in clarifying some of the following potential issues:
When is the business impacted by major incidents? Is it at recognised stages like month-end?
Is the return to service being prioritised?
Are we detecting incidents quickly? Are the systems being suitably managed or monitored?
Are the incidents correctly diagnosed? Is this diagnoses performed within expected time parameters. Are technicians suitably trained?
Are repair processes initiated within suitable time limits after diagnosis? Is there a logistics issue?
Are restore times adequate? Is there an issue around continuity or dated technology?
Does the system start processing and become functional in a useful manner to the business in an acceptable time period after being restored? Are there cumbersome interface issues?
Timelines
How do you improve. Understand the what makes up the time periods from outage to full resolution. Which of those were less than optimal?
Detection – time between when outage occurred and when it was known (does the monitoring tool work?) (Do you detect HD RAID failures?) (Do you detect redundant network path failures?)
Diagnostic time – working out what went wrong. How good are your troubleshooting skills. Have you identified the correct causes?
Ready to repair – being able to gather all required resources to fix what is broken. (Are the parts available?)
Recovered – the failed components have been fixed and are ready to be placed back in production
Restoration time – the system is back in production and cooking on gas
Notification times – customers and users of the system are informed (Do they know they cab transact?)
Risk profile completion time – time to gather and analysis risk associated with incident
Counter measures implementation – time that relevant counter measures are implement to reduce identified threats
Using time to become effective and efficient
Metrics
Measurements
Detection
When disaster has occurred it is important to record the events – numerous mechanisms are possible dependant on the outage
It is possible to use video surveillance or even Smartphone cameras to take pictures of what has occurred
This might help as a later diagnosis and root causation could be expedited by a latter review of the material
A source of detection are also logs, typically SYSLOG or the logs from applications such as web servers (use ELK to create a mission control dashboard!)
Use of NETFLOW can assist in providing the precise time of outages and also be a primary tool for root causation
Often it will assist to have screen scraping or enforce logging of access (such as log files when using SSH access and putty)
A disproportionate number of incidents being logged at the Service Desk and a potential indicator for a major incident (but the question should be asked as to why another more automated tool hasn’t detected the problem
Refer Netflow - https://en.wikipedia.org/wiki/NetFlow
Tools and retrofit
“IS – IS NOT” is an example of a tool that facilitates the detection of which components are involved in an outage. This technique eliminates the potential of components being identified falsely. At the end of the exercise, the components involved are confirmed which will allow diagnosis to continue.
Tweetdeck – refer https://tweetdeck.twitter.com/
Diagnosis
Diagnose
Reference: https://lnkd.in/efjZqhr
The predecessor of the Flying FortressThe birth of the checklist
Still, the Air Corps faced arguments that the aircraft was too big to handle. The Air Corps, however, properly recognized that the limiting factor here was human memory, not the aircraft’s size or complexity. To avoid another accident, Air Corps personnel developed checklists the crew would follow for take-off, flight, before landing, and after landing. The idea was so simple, and so effective, that the checklist was to become the future norm for aircraft operations. The basic concept had already been around for decades, and was in scattered use in aviation worldwide, but it took the Model 299 crash to institutionalize its use.
“The Checklist,” Air Force Magazine
In crisis management, especially during a major incident, the team that is responsible for identifying a potential repair is known as the delta team. The delta team is a tiger team (read more about them here). The team is specifically responsible for diagnoses which is the process that delivers on the potential repair. In this article we will be referring to Information technology (IT) major incidents but many of the concepts are generic to all types of crisis management.
Now the team never has a live cat thrown over the wall but a dead one! The team often has to start from a clean slate in diagnosis. The first actions around diagnosis is to usually perform various checklists dependant on what type of dead cat has been thrown. In an optimized process the dead cat would have a note attached. In the context of a major incident, a preliminary checklist would have been completed and the note would be the results of that checklist.
Checklists can take various forms and are used to compensate for the weaknesses of human memory to help ensure consistency and completeness in carrying out a task. Checklists came into prominence with pilots with the pilot's checklist first being used and developed in 1934 when a serious accident hampered the adoption into the armed forces of a new aircraft (the predecessor to the famous Flying Fortress). The pilots sat down and put their heads together. What was needed was some way of making sure that everything was done; that nothing was overlooked. What resulted was a pilot's checklist. Actually, four checklists were developed - take-off, flight, before landing, and after landing. The new aircraft was not "too much aeroplane for one man to fly", it was simply too complex for any one man's memory. These checklists for the pilot and co-pilot made sure that nothing was forgotten. Additionally, the plane had two pilots to ensure continuity of operations should there be a problem with one of the pilots.
During operations, especially IT ones, it is important to document and record dependencies. Often these are too many for a single individual to remember and thus lists capture those critical requirements that would otherwise have slipped through the cracks.
The concept of using checklists in medicine is explained by Dr Atul Gawande in this youtube video of his presentation to TED here. Although the talk focusses on medicine, it also has great relevance to IT! Strangely enough, there is no suitable checklists app available in any app store, especially for IT.
Well, often the easiest repair for a dead cat, if it is really dead is to buy a new cat. But is the cat really dead?
Take for example, a remote branch. If a systems, outage is reported at the branch, and a similar outage does not exist at other locations, two obvious scenarios are that the link to the branch is non-operational or that systems used for access in the remote branch aren’t functioning. If we focus for a moment on the latter, it would obviously be difficult to make a determination without an out of band mechanism. As an example, in South Africa we have a disproportionate amount of load shedding present due to the lack and oversight of grid maintenance by the electrical utility. Normal systems, such as network management systems use the same infrastructure, which is now not functioning, to determine the status. This is known as in band. Clearly this type of diagnoses is irrelevant. What is required is an out of band system.
An out of band system would require a monitoring board with its own separate battery backup pack that uses a 3rd party network connection such as a mobile network to poll and sample the state of operations at the branch. This monitoring board would sample the power status and immediately the delta team would now be able to assess whether they are dealing with a power outage or potential hardware fault. Multiple power probes can determine whether it is utility related or if the cleaner has unplugged the network equipment to power up he vacuum cleaner for cleaning. The monitoring board is also a potential Swiss army knife of diagnosis. Wireless asset probes can determine whether the network switch and router has been stolen. A location device on the monitoring board itself can determine if it has been moved or is a target of theft itself. Additional probes for water floods and overheating can also be added as examples.
Obviously when these initial checklist have been completed and further diagnosis is required the next important step is to put eyes on the problem. Delaying this and attempting to continue endless remote diagnoses is not productive. From personal experience, I was once dealing with intermittent outages at a remote site. The network management system and metrics were analysed till I was blue in the face. This continued for two weeks. Finally, I climbed on an aircraft and went to visit the location which was a Toyota car manufacturing plant. At the plant we went to the paint shop, where the network equipment had the symptoms of intermittent faults. The network equipment was at the top of the building near the roof and we had to climb the access gangways to the top. Once there we immediately realized what the problem was when we laid eyes on the equipment. Pigeons were roosting above the network equipment rack and over the course of a few years the pigeon poo had started to cake on the equipment. Well, poo is acidic and it started eating into the casing of the equipment and eventually it went through the casing and was now starting on the PCB boards. No amount of remote diagnosis would have solved the pigeon poo problem!
Hardware failures are an obvious issue as it results in a blackout error. More difficult to diagnose is the brownout. This is a degradation in service and not a total outage. In this case, in band tools that provide insight into customer experience. Often poor customer experience is as a result of their own data pollution. It could be that malware has entered the computer system of a customer, generating excessive spam email traffic which saps the network link. Or, peer to peer file exchange may be occurring in violation of copyright laws at the same time as absorbing great network capacity. A group of customers might be viewing videos in HD. These sorts of problems can make customers think something is wrong with their network service, when in reality, the service is working fine and provides plenty of bandwidth for proper and legitimate usages. The delta team gain access to special flow analysis software and systems available for their networking equipment that provide excellent insight into the exact real-time sources of loads on the network links under investigation.
Typically as a network operator a team will have access to ITU-T Y.1564 metrics. These metrics will provide insight into actual customer bandwidth (usage), latency (response), jitter (variance), loss (congestion), Service Level Agreement (SLA) compliance and availability. These are typically available as attributes of a Carrier Ethernet link and provides accelerated insight into whether and issue is customer related or network operator related.
Although more will be written about diagnosis in the major incident process another large source of investigation that can assist in finding a repair is an analysis of recent changes. Additional a repository of the latest changes is also beneficial for providing the romeo team with a working configuration of a system. This will be clarified in greater detail in a future article. Checklists are an important and often overlooked tool. Tom Peters has this to say about checklists:
Process & Simplicity: Checklists!! Complexifiers often rule—in part the by-product of far too many “consultants” in the world, determined to demonstrate the fact that their IQs are higher than yours or mine. Enter Johns Hopkins’ Dr Peter Pronovost. Dr P was appalled by the fact that 50% of folks in ICUs (90,000 at any point—in the U.S. alone) develop serious complications as a result of their stay in the ICU, per se. He also discovered that there were 179 steps, on average, required to sustain an ICU patient every day. His answer: Dr P “invented” the … ta-da … checklist! With the religious use of simple paper lists, prevalent ICU “line infection” errors at Hopkins dropped from 11% to zero—and stay-length was halved. (Results have been consistently replicated, from the likes of Hopkins to inner-city ERs.) “[Dr Pronovost] is focused on work that is not normally considered a significant contribution in academic medicine,” Dr Atul Gawande, wrote in “The Checklist” (New Yorker, 1210.07). “As a result, few others are venturing to extend his achievements. Yet his work has already saved more lives than that of any laboratory scientist in the last decade.”
Infographic about checklists
Crime scene
Taiichi Ohno, who refined the production systems at (TPS) Toyota Production System, would take new managers and engineers to the factory and drawing a chalk circle on the floor. The subordinate would be told to stand in the circle and to observe and note down what he saw. When Ohno returned he would check; if the person in the circle had not seen enough he would be asked to keep observing. Ohno was trying to imprint upon his future managers and engineers that the only way to truly understand what happens in the factory was to go there. It was here that value was added and here that waste could be observed. This was known as Genchi Genbutsu and is a primary method to start solving problems. If the problem exists in the factory then it needs to be understood and solved in the factory and not on the top floors of some office block or city skyscraper.
Genchi Genbutsu sets out the expectation that it is a requirement to personally evaluate operations so that a firsthand understanding of situations and problems is derived.
Genchi Genbutsu means "go and see" and it is a key principle of the Toyota Production System. It suggests that in order to truly understand a situation one needs to go to gemba (現場) or, the 'real place' - where work is done.
Recording the account of what happened
Prevailing conditions and business impact
On the morning of Monday, 29th August 2005 hurricane Katrina hit the Gulf coast of the US. New Orleans, Louisiana suffered the main brunt of the hurricane but the major damage and loss of life occurred when the levee system catastrophically failed. Floodwaters surged into 80% of the city and lingered for weeks. At least 1,836 people lost their lives in the hurricane and resulting floods making it the largest natural disaster in the history of the United States.
On July 31, 2006 the Independent Levee Investigation Team released a report on the Greater New Orleans area levee failures. Their report
“identified flaws in design, construction and maintenance of the levees. But underlying it all, the report stated, were the problems with the initial model used to determine how strong the system should be.”
The hypothetical model storm upon which storm protection plans were based is called the Standard Project Hurricane or SPH. The model storm was simplistic, and led to an inadequate network of levees, flood walls, storm gates and pumps. The report also found that
“the creators of the standard project hurricane, in an attempt to find a representative storm, actually excluded the fiercest storms from the database.”
It is one thing collecting data of a problem and recording it, but a totally different skill is required to interpret it. Here you look at visual representations by graphing the data in an appropriate fashion. As an example, bar graphs are often referred to as Manhattan graphs. Just as with the Manhattan skyline where the large buildings are prominent, so too is those significant bits of data that is represent in a graph. Convert the data to a visual representation and this will aid in the process of solving the problems.
The visualization present in the NOC should always be designed to assist in diagnosis.
Refer to examples of graphing of times in Major Incident Lifecycle.
Uptime is about reducing downtime
Firefighting
Video refer: https://lnkd.in/eVF7XUy
Firefighting
Firefighting
Firefighting
Firefighting
Incident consequence analysis
Reference: https://lnkd.in/eCZ4X5c
1. Clarify the problem includes alignment to the Ultimate Goal or Purpose and to identify the Ideal situation, current situation and the gap
2. Breakdown the problem requires breakdown into manageable pieces using the 4 W’s and finding the Prioritized Problem, Process, and Point of Cause
3. Set a Target is to Set Target to the Point of Cause and determine “How much” and “By When”
4. Analyze Root Cause is to brainstorm multiple Potential Causes by asking WHY and to determine Root Cause by going to see the process
5. Develop Countermeasures is to brainstorm countermeasures, narrow using criteria, develop a detailed action plan, and gain consensus
6. See Countermeasures Through means to share status of plan by reporting, informing and consulting and build consensus, never give up, think and act persistently
7. Evaluate - determine if the target was achieved and evaluate 3 viewpoints, and look at process and results
8. Standardize - standardize Successful practices, share results and start the next round of kaizen