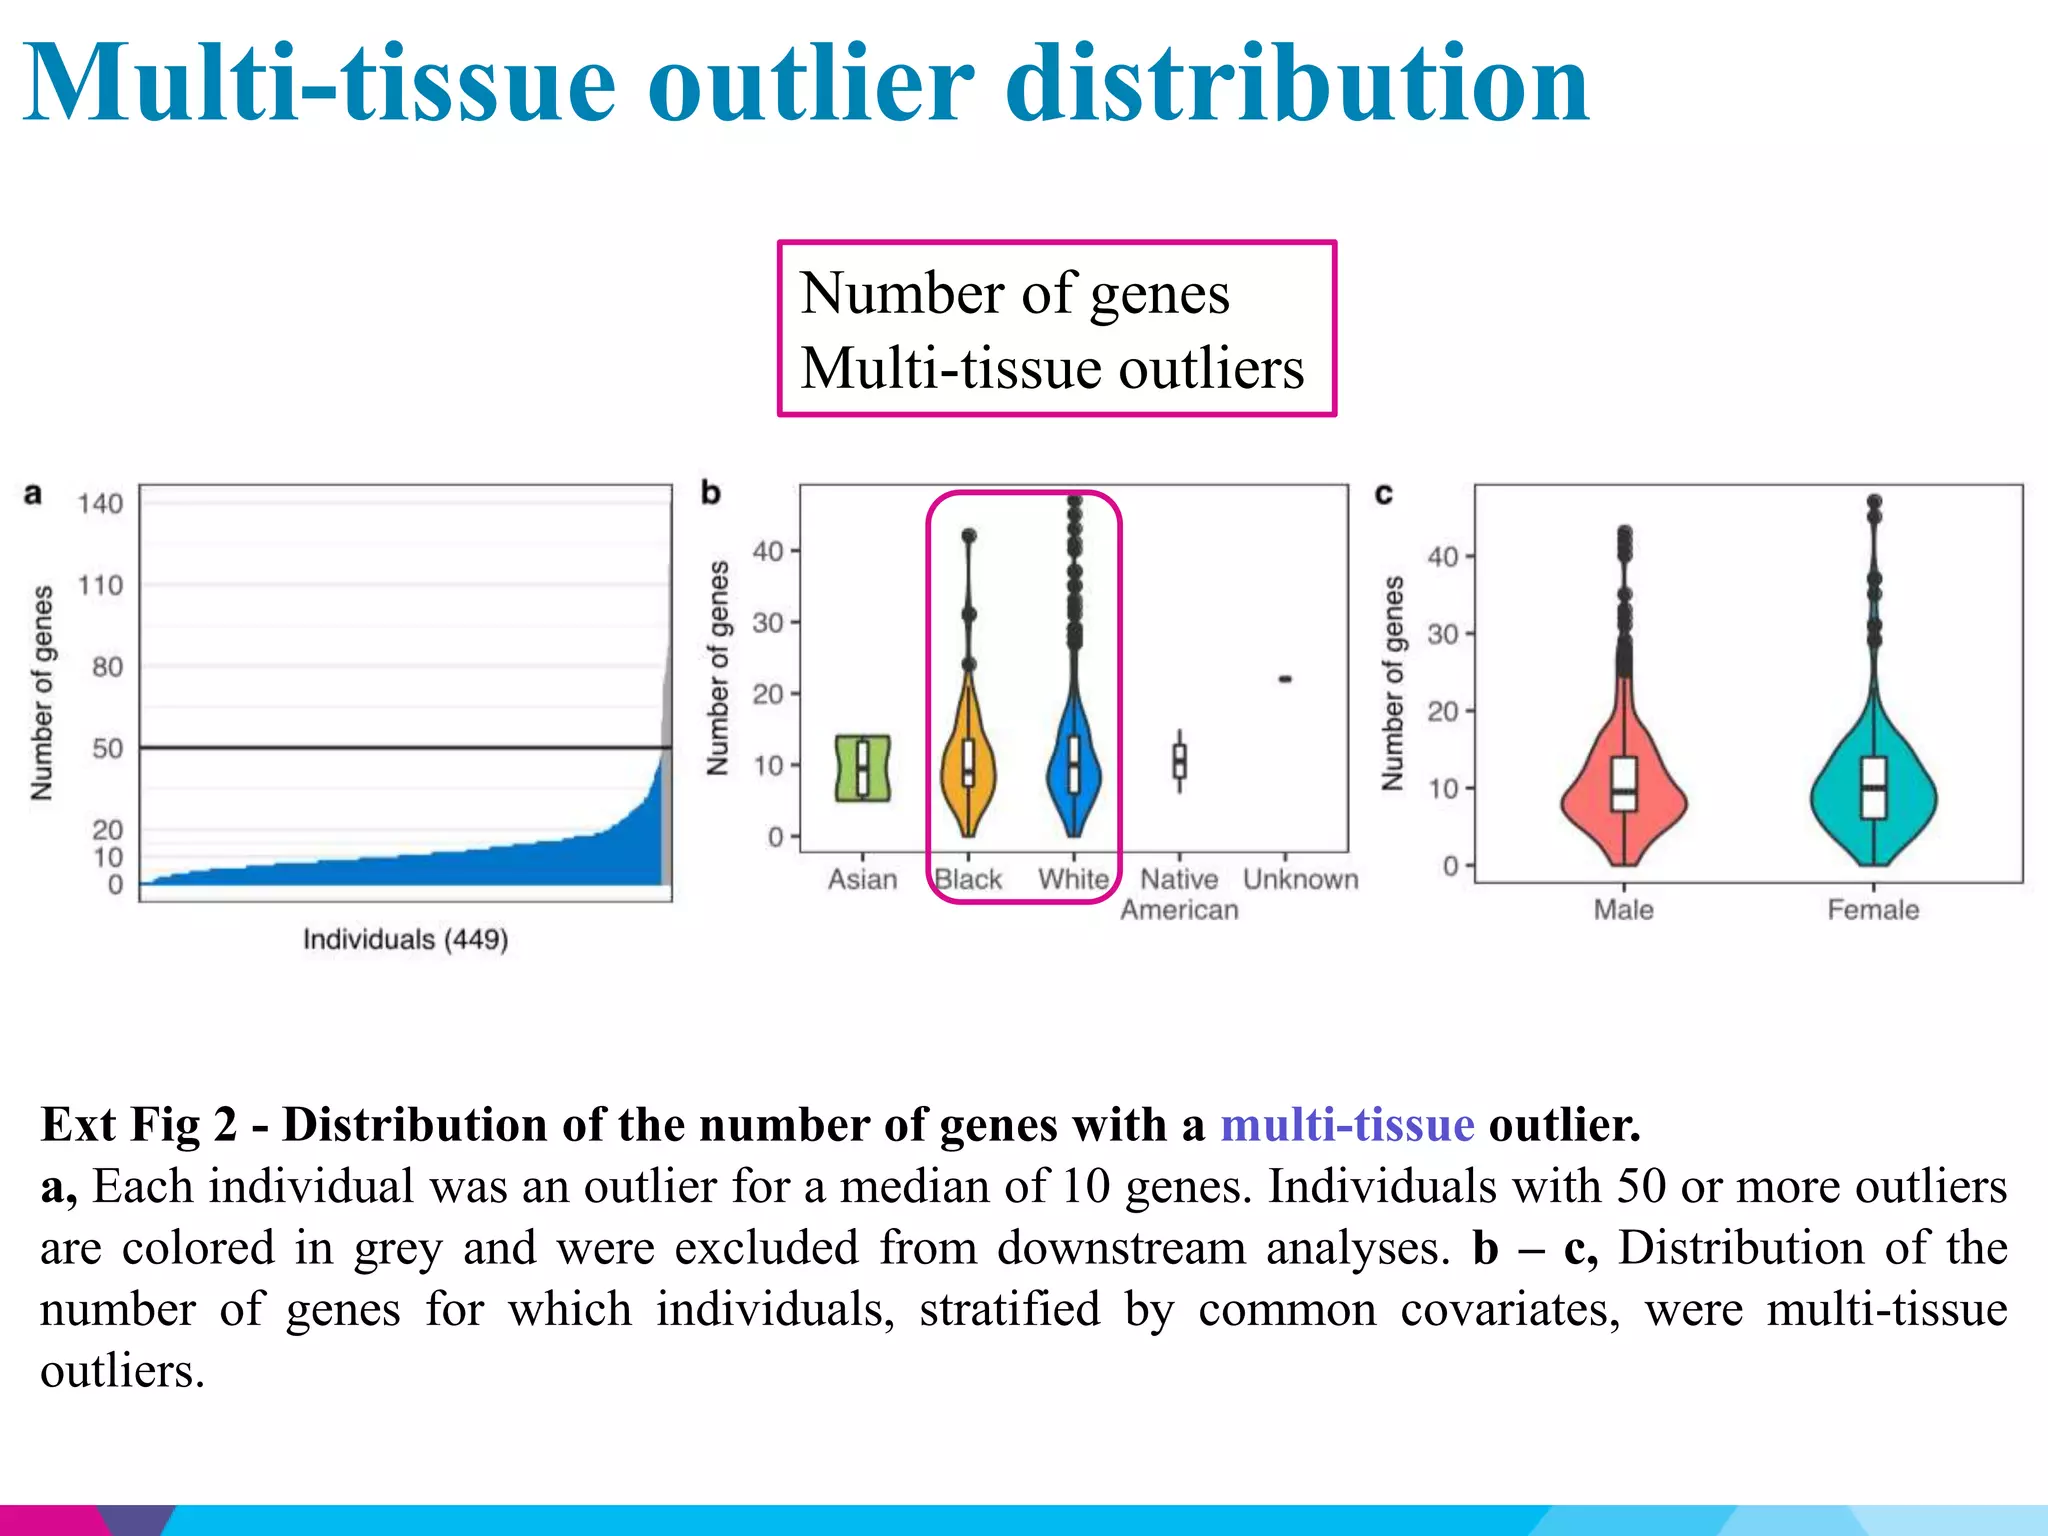
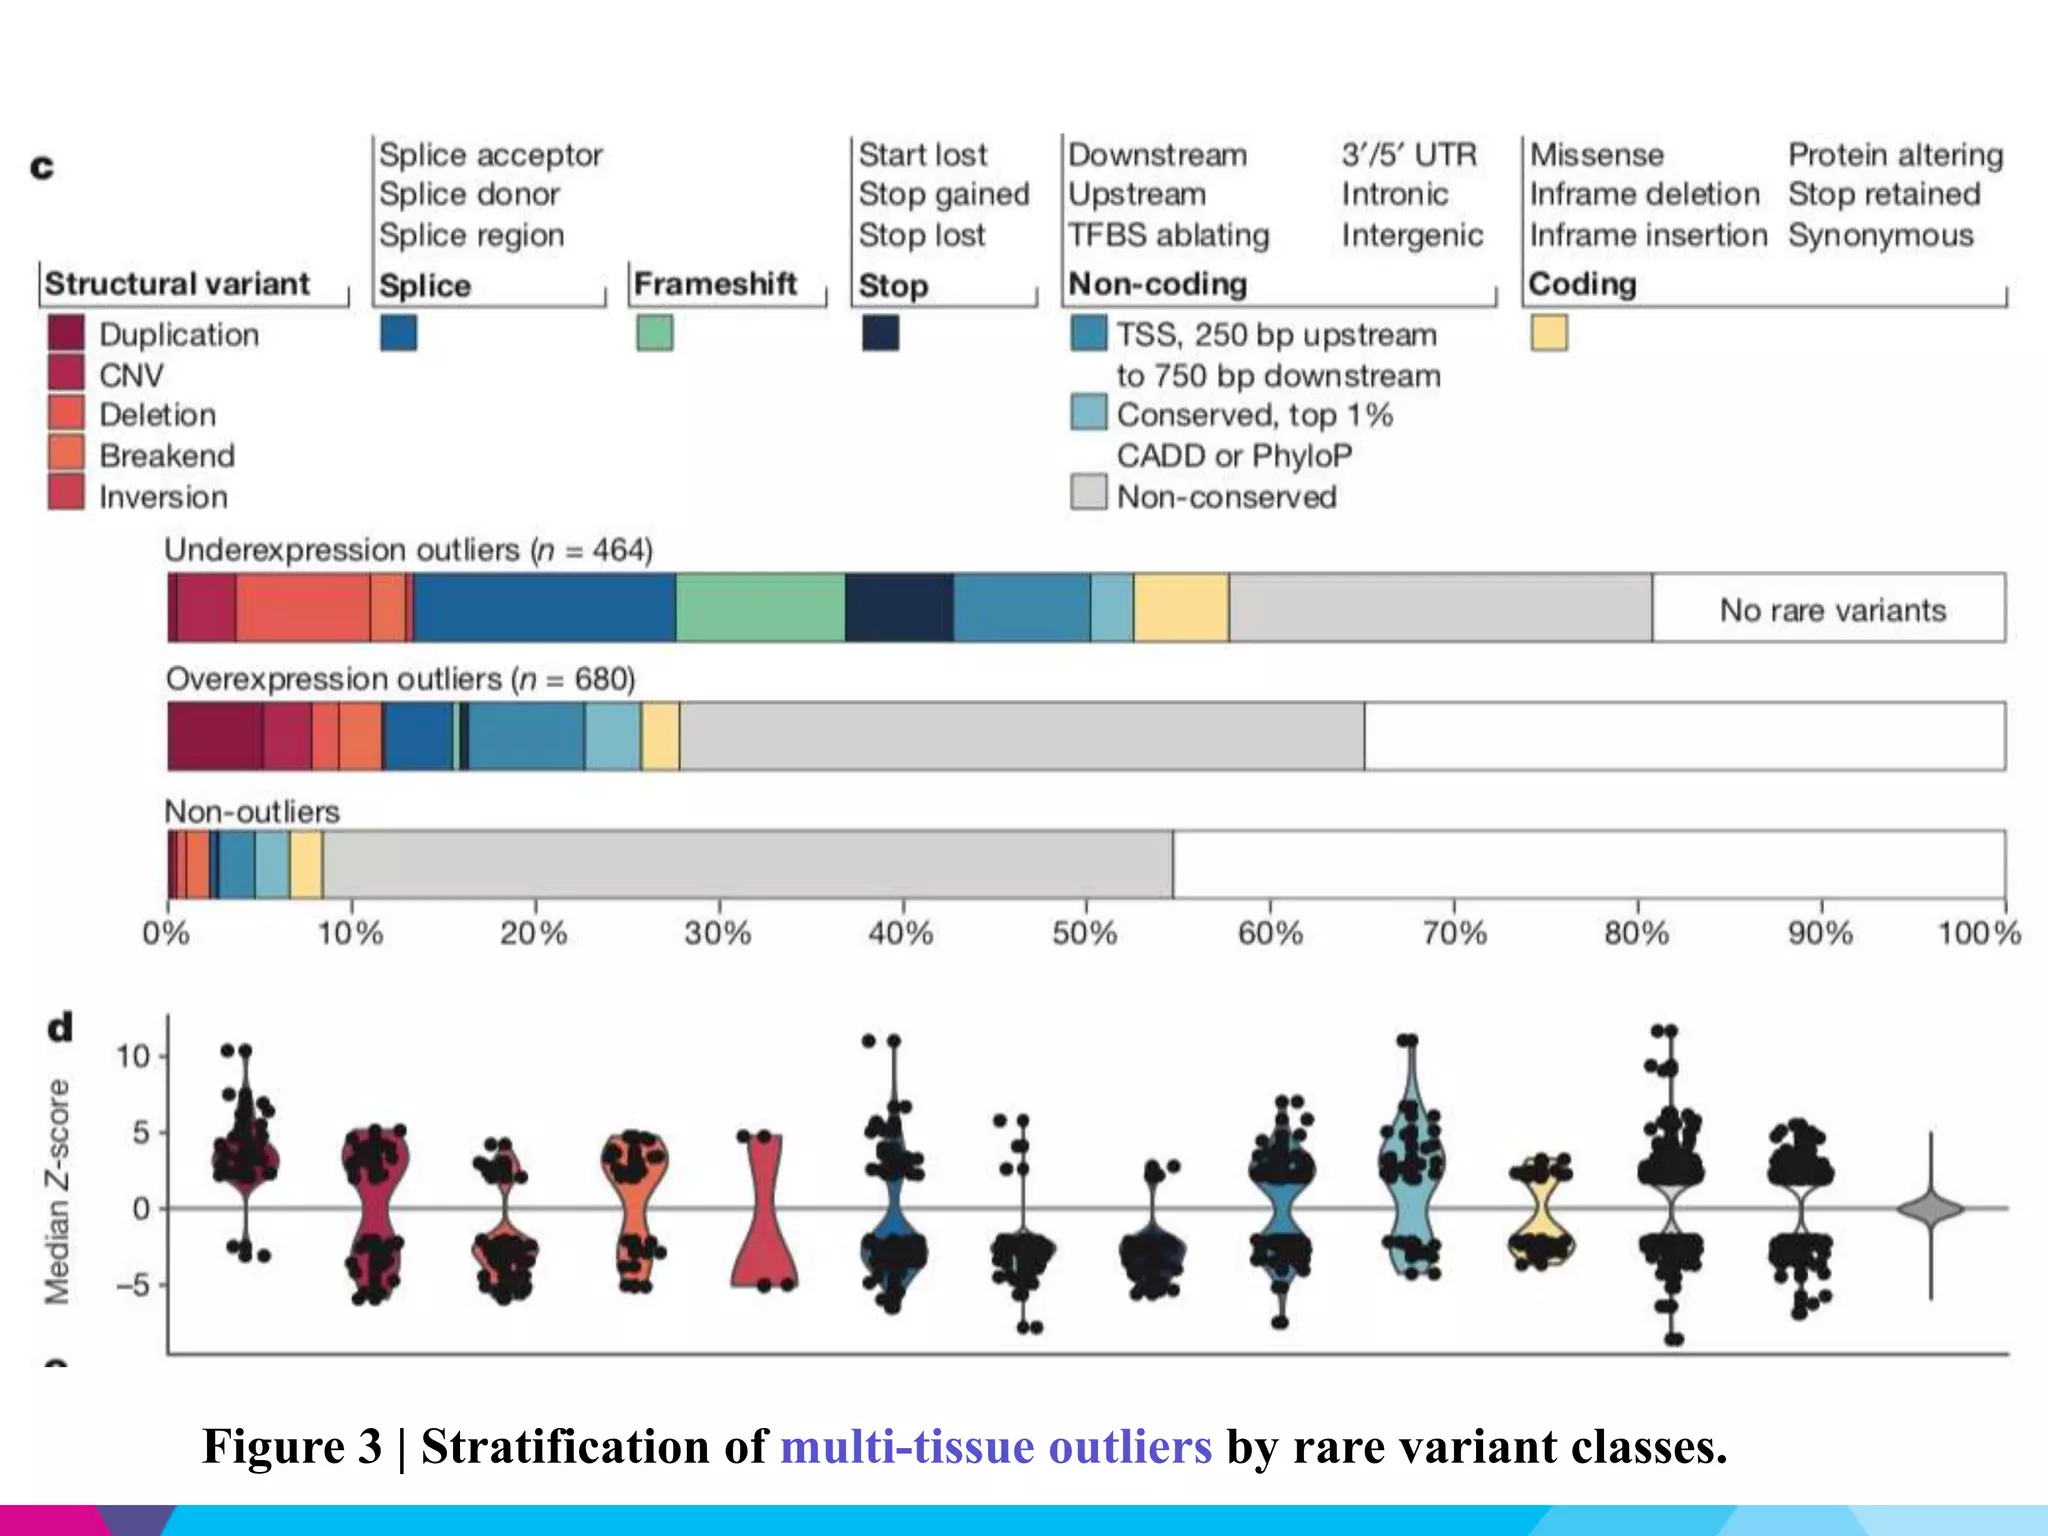
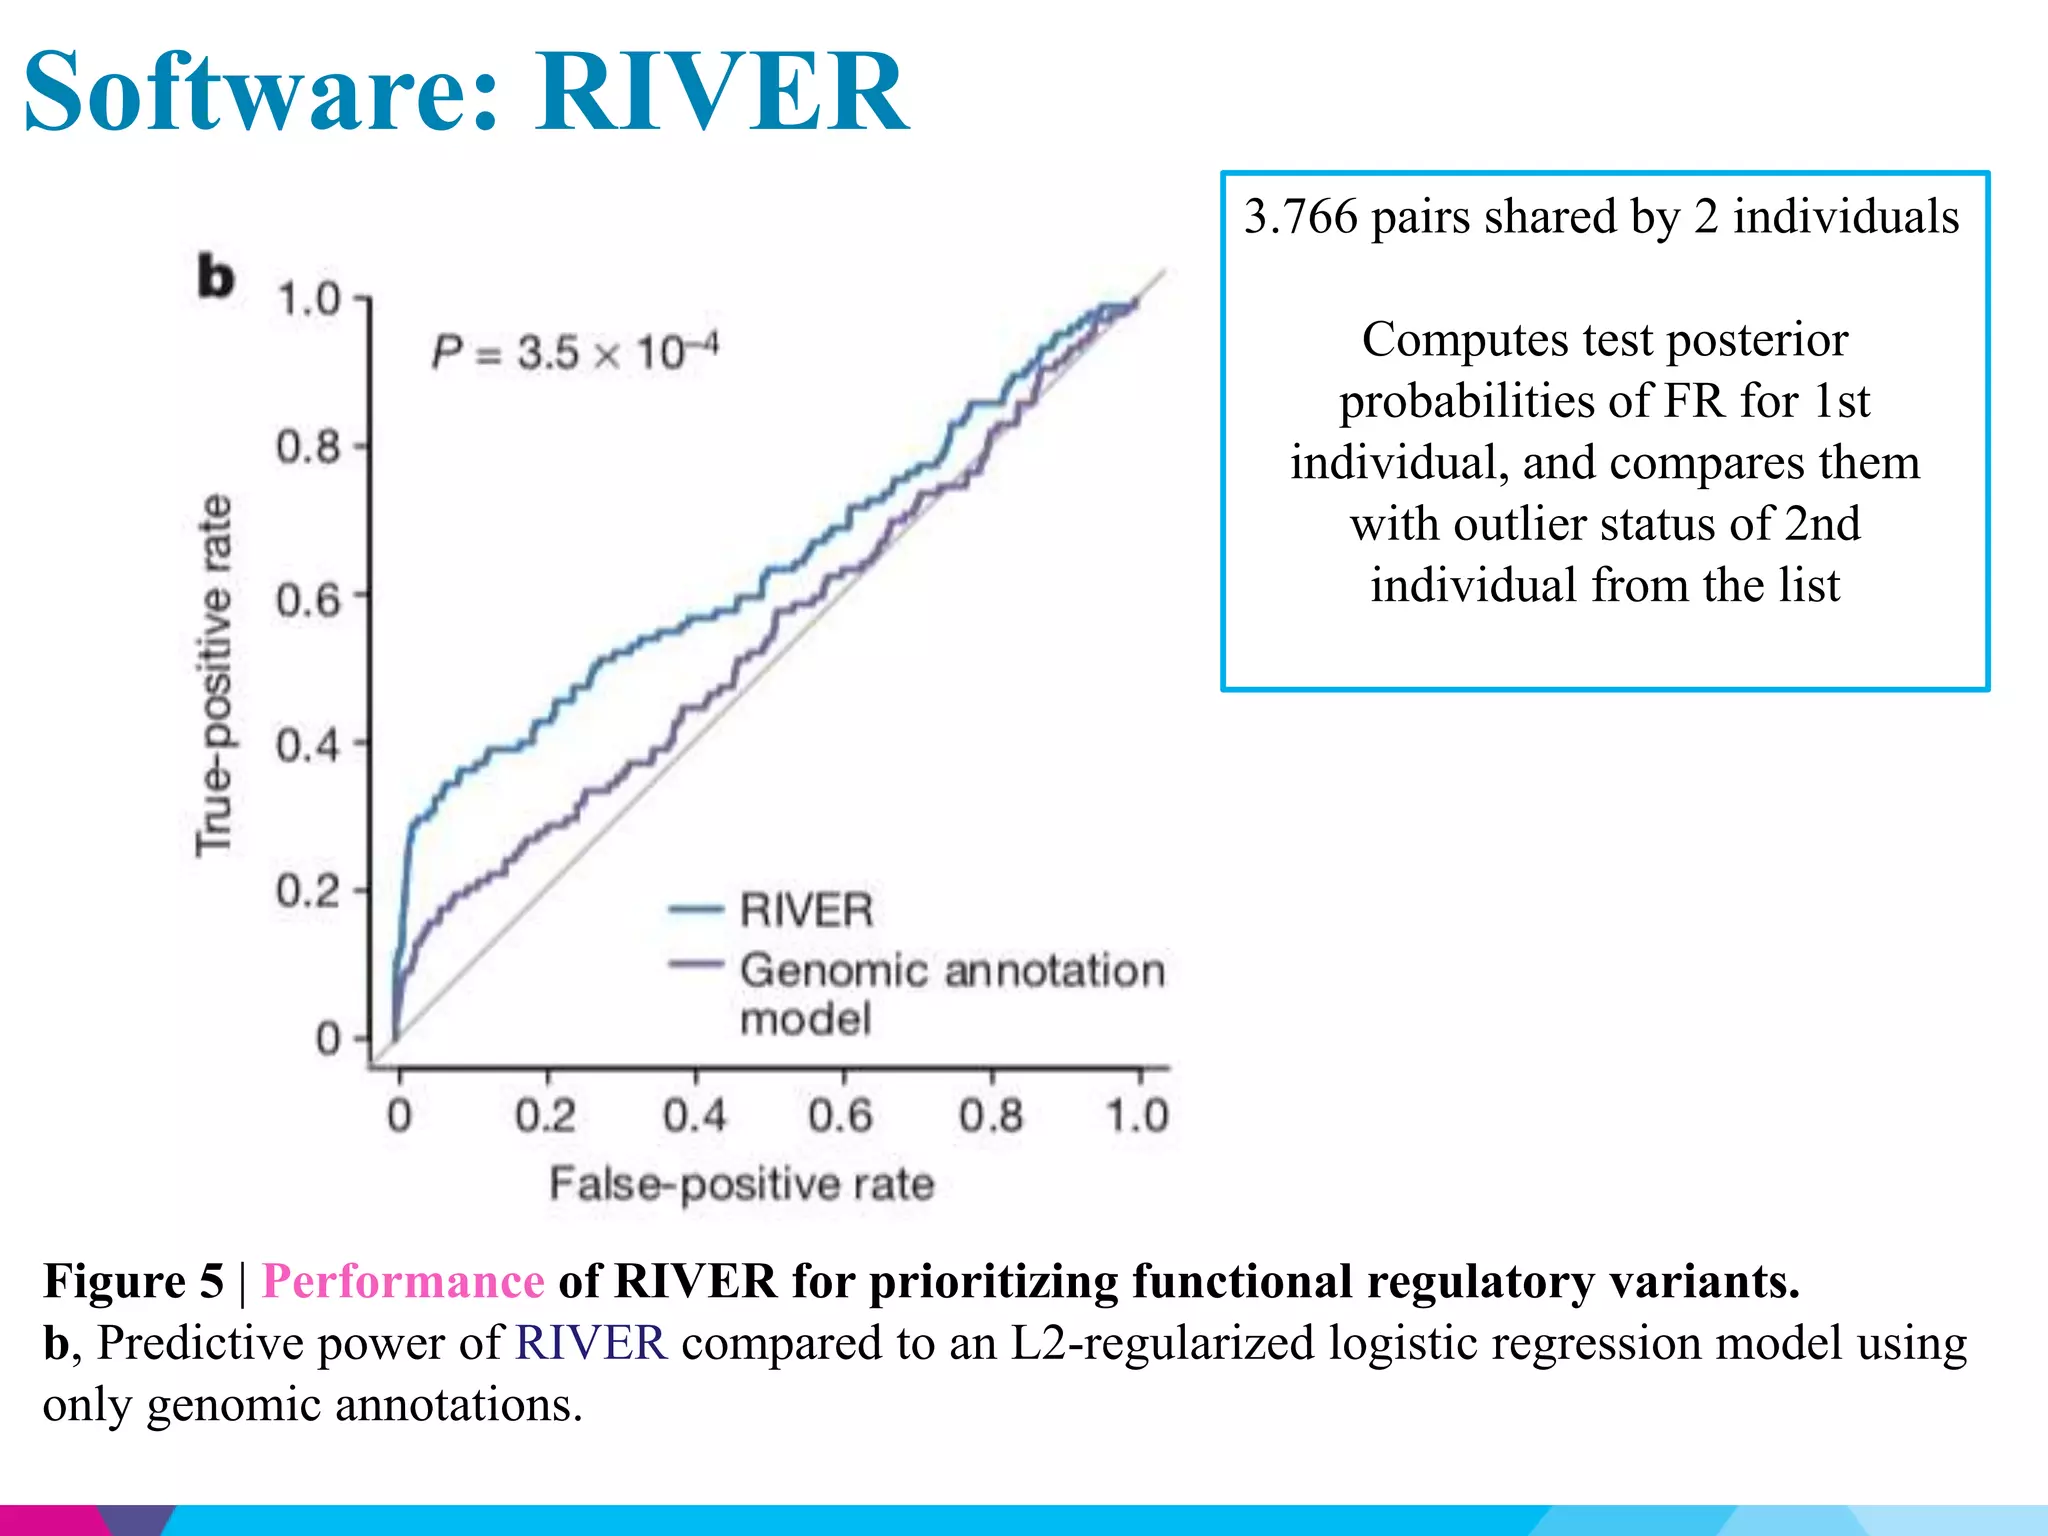
The impact of rare
variation on gene
expression across tissues
Katia Lopes, PhD
Ricardo Vialle, PhD
Raj Lab
Department of Neurosciences
May 1st 2019
Background
Currently is hard to distinguish pathogenic from benign rare non-
coding variants
Association studies (like GWAS) usually works fine for common
variants, however they are not practical for rare variants (large
sample sizes are required)
Analyzing the effect of rare non-coding variants in the expression
across different tissues may help to elucidate their roles in
diseases!
GTEx project v6p release
RNA-seq + Whole-genome sequencing (WGS)
449 individuals
44 tissues
log2(RPKM + 2)
Allele-specific expression (ASE)
Gencode v.19 annotation
Protein coding genes + long intergenic noncoding RNAs (lincRNA)
Estimated hidden factors using PEER
Standardized the expression for each gene with Z-scores
Data
PEER correction
Total expression removed by PEER
A noticeable difference between the brain and other tissues ???
Linear Regression between the covariate values
and the PEER factors
White = missing values
Outlier definition
Focus: Individuals with extremely high or extremely low expression of
a particular gene compared with the population
OUTLIERS
|Z-score| >= 2
AKR1C4
Single-tissue outlier
Multi-tissue outlier
At least 5 tissues
For each gene… e.g.
Pair Gene + Individual
Multi-tissue outlier distribution
Ext Fig 2 - Distribution of the number of genes with a multi-tissue outlier.
a, Each individual was an outlier for a median of 10 genes. Individuals with 50 or more outliers
are colored in grey and were excluded from downstream analyses. b – c, Distribution of the
number of genes for which individuals, stratified by common covariates, were multi-tissue
outliers.
Number of genes
Multi-tissue outliers
GTEx
449 individuals
44 tissues
10 brain tissues
18,830 genes tested
b, Outlier expression sharing between
tissues measured by the proportion of
single-tissue outliers that have a |Z-
score| >= 2
Single tissue outlier
Replication of expression outliers
2 groups of expression data:
Discovery set of 34 tissues
Replication set of 10 tissues
For t = 10, 15, 20, 25 and 30
Multi-tissue outlier replication
Replication = 60% | Z-score >=1
Replication = ~30% | Z-score >=2
In order to investigate the influence of rare genetic variation on extreme
expression levels they focused on individuals of European ancestry with
WGS data (1,144 multi-tissue outliers)
Autosomal variants that passed all filters in the VCF (PASS in the filter
column)
Rare variants were defined as having MAF ≤ 0.01 in GTEx
SNVs and indels with MAF ≤ 0.01 in the European population of the 1000
Genomes Project Phase 3 data
They checked if the allele frequency was similar in the 1000 Genome Project
Rare genetic variation
Multi-tissue outliers were strongly enriched for nearby rare variants. The enrichment was most
pronounced for structural variants (SV) and greater for short insertions and deletions (indels)
than for single-nucleotide variants (SNVs)
Enrichment of rare variants in outliers
Figure 2 | Enrichment of rare variants and allele-specific expression (ASE) in outliers.
a, Enrichment within 10 kb of the transcription start site (TSS) among outliers.
Rare Common
1144 multi-tissue outlier
(WGS)
Y = Enrichment as the
relative risk of having a
nearby rare variant
Figure 2 | Enrichment of rare variants and allele-specific expression (ASE) in outliers.
b, Rare SNV enrichments at increasing Z-score thresholds.
Rare genetic variation
Under vs Over expressed outliers
Under vs Over expressed outliersAllele-specificexpression(ASE)
Figure 3 | Stratification of multi-tissue outliers by rare variant classes.
RIVER (RNA-informed variant effect on regulation)
A Bayesian statistical model that jointly analyses genome and transcriptome
data from the same individual to estimate the probability that a variant has
regulatory impact!
Software - RIVER
Roadmap Epigenomics
CADD
VEP
F = binary variable
representing the
functional regulatory
status of the rare variant
E = binary node
representing expression
outlier status
Software: RIVER
Figure 5 | Performance of RIVER for prioritizing functional regulatory variants.
b, Predictive power of RIVER compared to an L2-regularized logistic regression model using
only genomic annotations.
3.766 pairs shared by 2 individuals
Computes test posterior
probabilities of FR for 1st
individual, and compares them
with outlier status of 2nd
individual from the list
Software: RIVER
Figure 5 | Performance of RIVER for prioritizing functional regulatory variants.
c, Distribution of RIVER scores as a function of expression and genomic annotation scores.
ClinVar pathogenic variants
GAMT is associated with cerebral
creatine deficiency syndrome 2, and
causes neurological deficiencies and
also lead to low body fat
SBDS is associated with the
recessive Shwachman–Diamond
syndrome
Software: RIVER
Applications for Raj Lab
1. Correlate factors with covariates (PEER, PCA … )
2. Z-scores for gene-individual outlier detection
3. Enrichment of rare variants near outliers
4. Use RIVER to prioritize rare variants in each individual genome by their
predicted impact on gene expression
5. Single vs Multi-tissue data (or multi cell types?)

Raj Lab Meeting May/01/2019

  • 1.
    The impact ofrare variation on gene expression across tissues Katia Lopes, PhD Ricardo Vialle, PhD Raj Lab Department of Neurosciences May 1st 2019
  • 3.
    Background Currently is hardto distinguish pathogenic from benign rare non- coding variants Association studies (like GWAS) usually works fine for common variants, however they are not practical for rare variants (large sample sizes are required) Analyzing the effect of rare non-coding variants in the expression across different tissues may help to elucidate their roles in diseases!
  • 4.
    GTEx project v6prelease RNA-seq + Whole-genome sequencing (WGS) 449 individuals 44 tissues log2(RPKM + 2) Allele-specific expression (ASE) Gencode v.19 annotation Protein coding genes + long intergenic noncoding RNAs (lincRNA) Estimated hidden factors using PEER Standardized the expression for each gene with Z-scores Data
  • 5.
    PEER correction Total expressionremoved by PEER A noticeable difference between the brain and other tissues ??? Linear Regression between the covariate values and the PEER factors White = missing values
  • 6.
    Outlier definition Focus: Individualswith extremely high or extremely low expression of a particular gene compared with the population OUTLIERS |Z-score| >= 2 AKR1C4 Single-tissue outlier Single-tissue outlier Single-tissue outlier Multi-tissue outlier At least 5 tissues For each gene… e.g. Pair Gene + Individual
  • 7.
    Multi-tissue outlier distribution ExtFig 2 - Distribution of the number of genes with a multi-tissue outlier. a, Each individual was an outlier for a median of 10 genes. Individuals with 50 or more outliers are colored in grey and were excluded from downstream analyses. b – c, Distribution of the number of genes for which individuals, stratified by common covariates, were multi-tissue outliers. Number of genes Multi-tissue outliers
  • 8.
    GTEx 449 individuals 44 tissues 10brain tissues 18,830 genes tested b, Outlier expression sharing between tissues measured by the proportion of single-tissue outliers that have a |Z- score| >= 2 Single tissue outlier
  • 9.
    Replication of expressionoutliers 2 groups of expression data: Discovery set of 34 tissues Replication set of 10 tissues For t = 10, 15, 20, 25 and 30 Multi-tissue outlier replication Replication = 60% | Z-score >=1 Replication = ~30% | Z-score >=2
  • 10.
    In order toinvestigate the influence of rare genetic variation on extreme expression levels they focused on individuals of European ancestry with WGS data (1,144 multi-tissue outliers) Autosomal variants that passed all filters in the VCF (PASS in the filter column) Rare variants were defined as having MAF ≤ 0.01 in GTEx SNVs and indels with MAF ≤ 0.01 in the European population of the 1000 Genomes Project Phase 3 data They checked if the allele frequency was similar in the 1000 Genome Project Rare genetic variation
  • 11.
    Multi-tissue outliers werestrongly enriched for nearby rare variants. The enrichment was most pronounced for structural variants (SV) and greater for short insertions and deletions (indels) than for single-nucleotide variants (SNVs) Enrichment of rare variants in outliers Figure 2 | Enrichment of rare variants and allele-specific expression (ASE) in outliers. a, Enrichment within 10 kb of the transcription start site (TSS) among outliers. Rare Common 1144 multi-tissue outlier (WGS) Y = Enrichment as the relative risk of having a nearby rare variant
  • 12.
    Figure 2 |Enrichment of rare variants and allele-specific expression (ASE) in outliers. b, Rare SNV enrichments at increasing Z-score thresholds. Rare genetic variation
  • 13.
    Under vs Overexpressed outliers
  • 14.
    Under vs Overexpressed outliersAllele-specificexpression(ASE)
  • 15.
    Figure 3 |Stratification of multi-tissue outliers by rare variant classes.
  • 16.
    RIVER (RNA-informed varianteffect on regulation) A Bayesian statistical model that jointly analyses genome and transcriptome data from the same individual to estimate the probability that a variant has regulatory impact! Software - RIVER Roadmap Epigenomics CADD VEP F = binary variable representing the functional regulatory status of the rare variant E = binary node representing expression outlier status
  • 17.
    Software: RIVER Figure 5| Performance of RIVER for prioritizing functional regulatory variants. b, Predictive power of RIVER compared to an L2-regularized logistic regression model using only genomic annotations. 3.766 pairs shared by 2 individuals Computes test posterior probabilities of FR for 1st individual, and compares them with outlier status of 2nd individual from the list
  • 18.
    Software: RIVER Figure 5| Performance of RIVER for prioritizing functional regulatory variants. c, Distribution of RIVER scores as a function of expression and genomic annotation scores.
  • 19.
  • 20.
    GAMT is associatedwith cerebral creatine deficiency syndrome 2, and causes neurological deficiencies and also lead to low body fat SBDS is associated with the recessive Shwachman–Diamond syndrome Software: RIVER
  • 21.
    Applications for RajLab 1. Correlate factors with covariates (PEER, PCA … ) 2. Z-scores for gene-individual outlier detection 3. Enrichment of rare variants near outliers 4. Use RIVER to prioritize rare variants in each individual genome by their predicted impact on gene expression 5. Single vs Multi-tissue data (or multi cell types?)