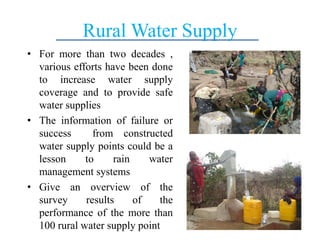
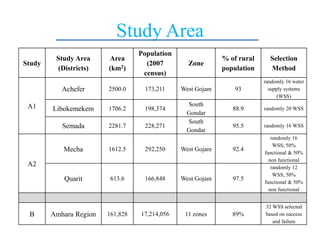
Factors in sub-optimum performance of rural water supply (RWS)
systems (as lessons learned for rain water management (RWM)
systems) in the Ethiopian Highlands
Seifu A. Tilahun, Aschalew D. Tigabu, Tegegne M. Tarekegne , Meseret B. Addisie, Habtamu
A. Beyene, Zemenu A. Alemeyehu, Manyahlshal Ayele, Amy S. Collick, Tammo S. Steenhuis
Nile Basin Development Challenge (NBDC) Science Workshop
Addis Ababa, Ethiopia, 9–10 July 2013
Rural Water Supply
• For more than two decades ,
various efforts have been done
to increase water supply
coverage and to provide safe
water supplies
• The information of failure or
success from constructed
water supply points could be a
lesson to rain water
management systems
• Give an overview of the
survey results of the
performance of the more than
100 rural water supply point
Study Area
Study
Study Area
(Districts)
Area
(km2)
Population
(2007
census)
Zone
% of rural
population
Selection
Method
A1
Achefer 2500.0 173,211 West Gojam 93
randomly 16 water
supply systems
(WSS)
Libokemekem 1706.2 198,374
South
Gondar
88.9 randomly 20 WSS
Semada 2281.7 228,271
South
Gondar
95.5 randomly 16 WSS
A2
Mecha 1612.5 292,250 West Gojam 92.4
randomly 16
WSS; 50%
functional & 50%
non functional
Quarit 613.6 166,848 West Gojam 97.5
randomly 12
WSS; 50%
functional & 50%
non functional
B Amhara Region 161,828 17,214,056 11 zones 89%
32 WSS selected
based on success
and failure
Methodology
• Formal interview, focal
group discussion and field
observation in 2008, 2010
and 2011
• Descriptive statistics based
on percentages and ratios
• Linear regression model
– For example, per capita water
consumption with household size
and distance from the source
– contributions of cash with number
of alternative water sources,
degree of household participation,
and trust on water use committees
Result
• Functionality of schemes:
about only two thirds were
operational
• Amount of water use per day:
Water use was between 10 and
15 l/day per capita
– an increase of household by one
person decreases significantly the
per capita water consumption by
1.5 l/day
– increase in travel by 1 km to the
water source decreased water use
by 6 l/day per capita
Result
• Alternative sources:
– 70% of the 160
respondents in
Semada had more
than one source
– 65% of the villages
from Study B had
unprotected
alternative source
– A unit increase in the number of
alternative sources decreases
the contribution of cash by 0.25
Ethiopian birr from a household
0.0
10.0
20.0
30.0
40.0
50.0
60.0
River unprotected
spring
Traditional
hand dug well
Other
Percent
Functional Schemes
Nonfunctional
schemes
Type of water source used before the developed
scheme in Mecha woreda
Result
• Operation and maintenance: In about 60% of the
sites in the region, no cash contribution is
observed
• the contributions were not more than 1 birr except
for sites with borehole
• they are poor which is not taken into account
when systems are planned (Carter, 2009) and
• low participation of beneficiaries in the design
and construction as explained by Deneke et al
(2011).
Result
• WUCs: Water Use Committees (WUCs) were
instituted in many villages for governing water
systems
• Ratio is 5 experts for 200 water supply points
• An increase of the level of trust in WUCs by
one unit significantly increases the cash
contributions by 0.19 ETB per month
• Not effective because local indigenous
institutions missing (Deneke et al., 2011)
Community, local leader and implementers share responsibility in
site selection in Quarit and Mecha Woredas
0
10
20
30
40
50
60
70
80
90
community local leader implementers community local leader implementers
Percent
Quarit Mecha
Functional Non-functional
Result
Result
Project Cost in Mecha woreda
Most successful RWS
• The Harbu area which is the water scarce
areas described as semi-arid.
• There are no alternative sources such as
springs and shallow wells.
• System is borehole
• 6 Birr/month
• RWS with multiple use
• 6 HDW, one is constructed for
livestock water
• Fontenina springs-developed
by Water Action that have
strong revenue
• Irrigation user safe-guard the
system
Most successful RWS
Conclusions
• The availability of alternative water sources was
an important factor in the failure of the system
– improving unprotected alternative sources near the
houses
• most cash collected for O & M should be spent
on maintenance rather than operation such as
payment for guard
– Operation payments could be in kind by through
participation of all households
Conclusions
• RWS is relatively successful in community that
local leaders participated in the selection of site,
project scheduling, and important decisions
during construction
• Improving the functioning of the Water User
Committees (WUCs)
– be preferable to use local indigenous institutions as described in
Deneke et al (2011) or local leaders
Further Information
http://soilandwater.bee.cornell.edu/research/internati
onal/eth_pubs.htm
http://www.youtube.com/watch?v=ckAgEUFK5yM
Thesis, briefing notes and main report
Documentary Film
Thank You!!

Factors in sub-optimum performance of rural water supply (RWS) systems (as lessons learned for rain water management (RWM) systems) in the Ethiopian Highlands

  • 1.
    Factors in sub-optimumperformance of rural water supply (RWS) systems (as lessons learned for rain water management (RWM) systems) in the Ethiopian Highlands Seifu A. Tilahun, Aschalew D. Tigabu, Tegegne M. Tarekegne , Meseret B. Addisie, Habtamu A. Beyene, Zemenu A. Alemeyehu, Manyahlshal Ayele, Amy S. Collick, Tammo S. Steenhuis Nile Basin Development Challenge (NBDC) Science Workshop Addis Ababa, Ethiopia, 9–10 July 2013
  • 2.
    Rural Water Supply •For more than two decades , various efforts have been done to increase water supply coverage and to provide safe water supplies • The information of failure or success from constructed water supply points could be a lesson to rain water management systems • Give an overview of the survey results of the performance of the more than 100 rural water supply point
  • 3.
    Study Area Study Study Area (Districts) Area (km2) Population (2007 census) Zone %of rural population Selection Method A1 Achefer 2500.0 173,211 West Gojam 93 randomly 16 water supply systems (WSS) Libokemekem 1706.2 198,374 South Gondar 88.9 randomly 20 WSS Semada 2281.7 228,271 South Gondar 95.5 randomly 16 WSS A2 Mecha 1612.5 292,250 West Gojam 92.4 randomly 16 WSS; 50% functional & 50% non functional Quarit 613.6 166,848 West Gojam 97.5 randomly 12 WSS; 50% functional & 50% non functional B Amhara Region 161,828 17,214,056 11 zones 89% 32 WSS selected based on success and failure
  • 4.
    Methodology • Formal interview,focal group discussion and field observation in 2008, 2010 and 2011 • Descriptive statistics based on percentages and ratios • Linear regression model – For example, per capita water consumption with household size and distance from the source – contributions of cash with number of alternative water sources, degree of household participation, and trust on water use committees
  • 5.
    Result • Functionality ofschemes: about only two thirds were operational • Amount of water use per day: Water use was between 10 and 15 l/day per capita – an increase of household by one person decreases significantly the per capita water consumption by 1.5 l/day – increase in travel by 1 km to the water source decreased water use by 6 l/day per capita
  • 6.
    Result • Alternative sources: –70% of the 160 respondents in Semada had more than one source – 65% of the villages from Study B had unprotected alternative source – A unit increase in the number of alternative sources decreases the contribution of cash by 0.25 Ethiopian birr from a household 0.0 10.0 20.0 30.0 40.0 50.0 60.0 River unprotected spring Traditional hand dug well Other Percent Functional Schemes Nonfunctional schemes Type of water source used before the developed scheme in Mecha woreda
  • 7.
    Result • Operation andmaintenance: In about 60% of the sites in the region, no cash contribution is observed • the contributions were not more than 1 birr except for sites with borehole • they are poor which is not taken into account when systems are planned (Carter, 2009) and • low participation of beneficiaries in the design and construction as explained by Deneke et al (2011).
  • 8.
    Result • WUCs: WaterUse Committees (WUCs) were instituted in many villages for governing water systems • Ratio is 5 experts for 200 water supply points • An increase of the level of trust in WUCs by one unit significantly increases the cash contributions by 0.19 ETB per month • Not effective because local indigenous institutions missing (Deneke et al., 2011)
  • 9.
    Community, local leaderand implementers share responsibility in site selection in Quarit and Mecha Woredas 0 10 20 30 40 50 60 70 80 90 community local leader implementers community local leader implementers Percent Quarit Mecha Functional Non-functional Result
  • 10.
  • 11.
    Most successful RWS •The Harbu area which is the water scarce areas described as semi-arid. • There are no alternative sources such as springs and shallow wells. • System is borehole • 6 Birr/month
  • 12.
    • RWS withmultiple use • 6 HDW, one is constructed for livestock water • Fontenina springs-developed by Water Action that have strong revenue • Irrigation user safe-guard the system Most successful RWS
  • 13.
    Conclusions • The availabilityof alternative water sources was an important factor in the failure of the system – improving unprotected alternative sources near the houses • most cash collected for O & M should be spent on maintenance rather than operation such as payment for guard – Operation payments could be in kind by through participation of all households
  • 14.
    Conclusions • RWS isrelatively successful in community that local leaders participated in the selection of site, project scheduling, and important decisions during construction • Improving the functioning of the Water User Committees (WUCs) – be preferable to use local indigenous institutions as described in Deneke et al (2011) or local leaders
  • 15.
  • 16.