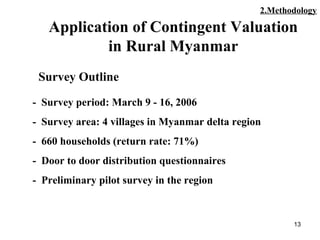
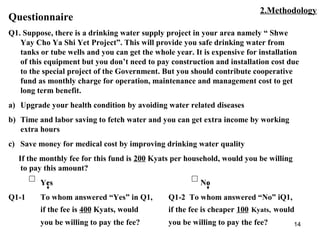
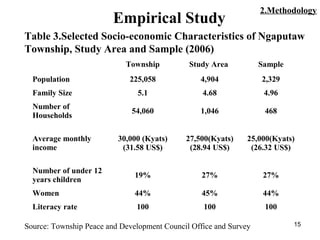
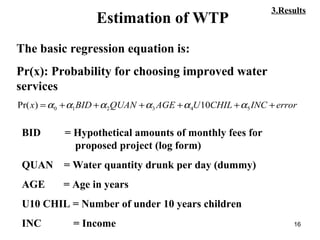
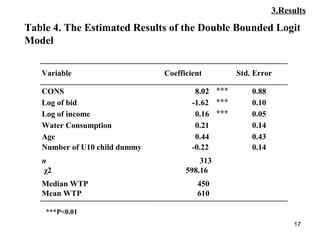
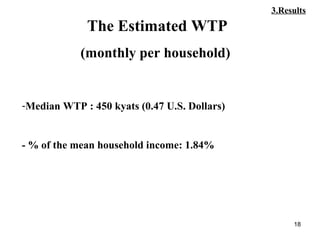
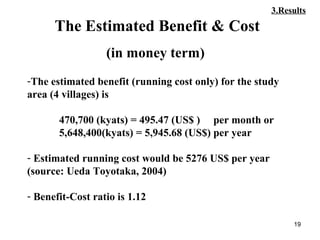
1
Valuing Safe Drinking Water Supply
in Rural Myanmar
M 046468
Graduate School for International Development and
Cooperation, Hiroshima University
August 1, 2006
THI THI KHIN
2
Contents
1. Introduction
2. Methodology
(Application of Contingent Valuation in Rural
Myanmar)
3. Results
4. Conclusion
3
Water Supply in Myanmar
Background of the Issue
Drinking water sources (mainly water ponds) are often
unprotected in rural Myanmar:
- Poor quality: polluted with bacteria and viruses
- Causing water-borne diseases such as Diarrhea,
Hepatitis, Typhoid and Cholera
 Protecting and upgrading drinking water supply is
much needed to reduce human health risks
1.Introduction
4
1.Introduction
Study Area
5
1.Introduction
Study Area
6
Drinking Water Pond in Wet Tsu Village
Photo taken by author on 3/14/2006
1.Introduction
7
Using Hand Pumps
in villages
Photo taken by author on 3/14/2006
1.Introduction
8
Objective
Objective: Estimate the economic value of establishing
safe drinking water supply in rural part of
Myanmar
Valuing the Environment: - Measuring the values of
environmental goods
(better water/air quality, forest,
urban green space and so on)
- Costs money and uses up real
resources plus overall
satisfaction of welfare (utility)
1.Introduction
9
The Use of Water
Table 1. Relationship between GDP per capita and access to
Safe Drinking Water Sources in some selected Countries
Source: UN-ESCAP and Human Development Reports
1.Introduction
  1990 2002
 
GDP per
capita (US$)
Access water
from improved
source (% of
total
population)
GDP per
capita (US$)
Access water
from improved
source (% of
total
population)
Malaysia 2,467 - 3,970 95
Thailand 1,562 81 2,028 85
Philippines 725 87 975 85
Indonesia 628 71 806 78
Pakistan 467 83 495 90
Sri Lanka 449 68 812 78
India 382 68 482 86
Myanmar 127 48 202 80
10
Methods for Valuing Environment
Stated Preference
Revealed Preference
Travel cost
Hedonic Pricing
Contingent Valuation
Conjoint
2.Methodology
11
Previous Studies
Table 2.Previous Studies’ WTPs for Drinking Water
No
.
Authors Objectives Study
Area
Method WTP per
month
1. Memon A. M.
and Matsuoka S.
(2001)
Estimate the
economic
benefit of
project
Pakistan
(Rural
Area)
Benefit
Transfer,
CVM,
OLS
(41.42 Rs
=0.74 US$)
1.02% of
income
2. Dutta V. (2003) To obtain an
estimate of the
value of urban
water supply
improvements
Delhi Probit ,
Logit ,
CVM
(160.56 Rs
=0.23US $)
2.Methodology
12
Previous Studies
No
.
Authors Objectives Study
Area
Method WTP per
month
3. Mones de Oca
Soto Gloria,
Bateman J. I.,
Tinch R. and
Moffatt G
Peter (2002)
1.Maintenance
2.Improvement
of water supply
changes
Mexico
City
CVM, Probit
Model
1) 123
pesos(10.76US
$ )(2.85% of
income
2) 142 pesos
(12.42US$)
( 5.27% of
income
4. Nam K.P. and
Hung Son V.
T.
(2003)
To improve
water services in
Ho Chi Minh
City
Ho Chi
Minh
City
Multinomial
logit , CVM
and CM
Piped 3.5%
income
Non-piped
4.1%-4.6%
Table 2.Previous Studies’ WTPs for Drinking Water
2.Methodology
13
Survey Outline
- Survey period: March 9 - 16, 2006
- Survey area: 4 villages in Myanmar delta region
- 660 households (return rate: 71%)
- Door to door distribution questionnaires
- Preliminary pilot survey in the region
Application of Contingent Valuation
in Rural Myanmar
2.Methodology
14
Questionnaire
Q1. Suppose, there is a drinking water supply project in your area namely “ Shwe
Yay Cho Ya Shi Yet Project”. This will provide you safe drinking water from
tanks or tube wells and you can get the whole year. It is expensive for installation
of this equipment but you don’t need to pay construction and installation cost due
to the special project of the Government. But you should contribute cooperative
fund as monthly charge for operation, maintenance and management cost to get
long term benefit.
a) Upgrade your health condition by avoiding water related diseases
b) Time and labor saving to fetch water and you can get extra income by working
extra hours
c) Save money for medical cost by improving drinking water quality
If the monthly fee for this fund is 200 Kyats per household, would you be willing
to pay this amount?
Yes No
Q1-1 To whom answered “Yes” in Q1, Q1-2 To whom answered “No” iQ1,
if the fee is 400 Kyats, would if the fee is cheaper 100 Kyats, would
you be willing to pay the fee? you be willing to pay the fee?
2.Methodology
15
Table 3.Selected Socio-economic Characteristics of Ngaputaw
Township, Study Area and Sample (2006)
Source: Township Peace and Development Council Office and Survey
Township Study Area Sample
Population 225,058 4,904 2,329
Family Size 5.1 4.68 4.96
Number of
Households
54,060 1,046 468
Average monthly
income
30,000 (Kyats)
(31.58 US$)
27,500(Kyats)
(28.94 US$)
25,000(Kyats)
(26.32 US$)
Number of under 12
years children
19% 27% 27%
Women 44% 45% 44%
Literacy rate 100 100 100
Empirical Study
2.Methodology
16
Estimation of WTP
The basic regression equation is:
Pr(x): Probability for choosing improved water
services
errorINCCHILUAGEQUANBIDx ++++++= 543210 10)Pr( αααααα
3.Results
BID = Hypothetical amounts of monthly fees for
proposed project (log form)
QUAN = Water quantity drunk per day (dummy)
AGE = Age in years
U10 CHIL = Number of under 10 years children
INC = Income
17
***P<0.01
Table 4. The Estimated Results of the Double Bounded Logit
Model
3.Results
***P<0.01
Variable Coefficient Std. Error
CONS 8.02 *** 0.88
Log of bid -1.62 *** 0.10
Log of income 0.16 *** 0.05
Water Consumption 0.21 0.14
Age 0.44 0.43
Number of U10 child dummy -0.22 0.14
n 313
χ2 598.16
Median WTP 450
Mean WTP 610
18
The Estimated WTP
(monthly per household)
-Median WTP : 450 kyats (0.47 U.S. Dollars)
- % of the mean household income: 1.84%
3.Results
19
-The estimated benefit (running cost only) for the study
area (4 villages) is
470,700 (kyats) = 495.47 (US$ ) per month or
5,648,400(kyats) = 5,945.68 (US$) per year
- Estimated running cost would be 5276 US$ per year
(source: Ueda Toyotaka, 2004)
- Benefit-Cost ratio is 1.12
The Estimated Benefit & Cost
(in money term)
3.Results
20
- The estimated WTP is consistent with existing studies
(in terms of the share of income)
- WTP results can show the respondents are favor to the
proposed project, they are eager to contribute to the
operation and maintenance cost for proposed project even
though their incomes are low
Conclusion
4.Conclusion
21
Conclusion
-The estimated WTP may not be sufficient to all the
costs necessary to establish and maintain safe drinking
water
-Initial cost should be supplied from external sources
( e.g ODA or other financial assistance)
4.Conclusion
22
References
Dutta,V.“Public Support for Water Supply Reforms in Unplanned Sector:
Empirical Evidence from an Urban Water Utility”, GDN Medal Award Paper, 7th
GDN Annual Conference, St. Petersburg, Russia, 2005.
Freeman III A.M. “The Measurement of Environmental and Resource Values:
Theories and Methods”. Resources for the Future, Washington DC, 2003.
Nam Khanh Pham and Hung Son Vo Tran, “Households Demand for Improved Water
Services in Ho Chi Minh City: A comparison of contingent valuation and choice
modeling estimates”. Research report EEPSEA, 2003.
Haab T. and McConnell K.E, “Valuing Environmental and Natural Resources: The
econometrics of non-market valuation”, Edward Elgar, Cheltenham, UK, 2003.
Memon M.A. and Matsuoka S. “Benefit Transfer Function to Estimate WTP for
Rural Water Supply in Pakistan”, Journal of International Development Studies, Vol.
10, No.2, pp. 101-119, 2001.
Whittington. Dale, “The Challenge of Demand Assessment in Pro-Poor Infrastructure
projects” PPIAF/ADB Conference on Infrastructure Development – Private Solutions
for the Poor: The Asian Perspective, 2002.

Thi thi khin (1st august 2006)

  • 1.
    1 Valuing Safe DrinkingWater Supply in Rural Myanmar M 046468 Graduate School for International Development and Cooperation, Hiroshima University August 1, 2006 THI THI KHIN
  • 2.
    2 Contents 1. Introduction 2. Methodology (Applicationof Contingent Valuation in Rural Myanmar) 3. Results 4. Conclusion
  • 3.
    3 Water Supply inMyanmar Background of the Issue Drinking water sources (mainly water ponds) are often unprotected in rural Myanmar: - Poor quality: polluted with bacteria and viruses - Causing water-borne diseases such as Diarrhea, Hepatitis, Typhoid and Cholera  Protecting and upgrading drinking water supply is much needed to reduce human health risks 1.Introduction
  • 4.
  • 5.
  • 6.
    6 Drinking Water Pondin Wet Tsu Village Photo taken by author on 3/14/2006 1.Introduction
  • 7.
    7 Using Hand Pumps invillages Photo taken by author on 3/14/2006 1.Introduction
  • 8.
    8 Objective Objective: Estimate theeconomic value of establishing safe drinking water supply in rural part of Myanmar Valuing the Environment: - Measuring the values of environmental goods (better water/air quality, forest, urban green space and so on) - Costs money and uses up real resources plus overall satisfaction of welfare (utility) 1.Introduction
  • 9.
    9 The Use ofWater Table 1. Relationship between GDP per capita and access to Safe Drinking Water Sources in some selected Countries Source: UN-ESCAP and Human Development Reports 1.Introduction   1990 2002   GDP per capita (US$) Access water from improved source (% of total population) GDP per capita (US$) Access water from improved source (% of total population) Malaysia 2,467 - 3,970 95 Thailand 1,562 81 2,028 85 Philippines 725 87 975 85 Indonesia 628 71 806 78 Pakistan 467 83 495 90 Sri Lanka 449 68 812 78 India 382 68 482 86 Myanmar 127 48 202 80
  • 10.
    10 Methods for ValuingEnvironment Stated Preference Revealed Preference Travel cost Hedonic Pricing Contingent Valuation Conjoint 2.Methodology
  • 11.
    11 Previous Studies Table 2.PreviousStudies’ WTPs for Drinking Water No . Authors Objectives Study Area Method WTP per month 1. Memon A. M. and Matsuoka S. (2001) Estimate the economic benefit of project Pakistan (Rural Area) Benefit Transfer, CVM, OLS (41.42 Rs =0.74 US$) 1.02% of income 2. Dutta V. (2003) To obtain an estimate of the value of urban water supply improvements Delhi Probit , Logit , CVM (160.56 Rs =0.23US $) 2.Methodology
  • 12.
    12 Previous Studies No . Authors ObjectivesStudy Area Method WTP per month 3. Mones de Oca Soto Gloria, Bateman J. I., Tinch R. and Moffatt G Peter (2002) 1.Maintenance 2.Improvement of water supply changes Mexico City CVM, Probit Model 1) 123 pesos(10.76US $ )(2.85% of income 2) 142 pesos (12.42US$) ( 5.27% of income 4. Nam K.P. and Hung Son V. T. (2003) To improve water services in Ho Chi Minh City Ho Chi Minh City Multinomial logit , CVM and CM Piped 3.5% income Non-piped 4.1%-4.6% Table 2.Previous Studies’ WTPs for Drinking Water 2.Methodology
  • 13.
    13 Survey Outline - Surveyperiod: March 9 - 16, 2006 - Survey area: 4 villages in Myanmar delta region - 660 households (return rate: 71%) - Door to door distribution questionnaires - Preliminary pilot survey in the region Application of Contingent Valuation in Rural Myanmar 2.Methodology
  • 14.
    14 Questionnaire Q1. Suppose, thereis a drinking water supply project in your area namely “ Shwe Yay Cho Ya Shi Yet Project”. This will provide you safe drinking water from tanks or tube wells and you can get the whole year. It is expensive for installation of this equipment but you don’t need to pay construction and installation cost due to the special project of the Government. But you should contribute cooperative fund as monthly charge for operation, maintenance and management cost to get long term benefit. a) Upgrade your health condition by avoiding water related diseases b) Time and labor saving to fetch water and you can get extra income by working extra hours c) Save money for medical cost by improving drinking water quality If the monthly fee for this fund is 200 Kyats per household, would you be willing to pay this amount? Yes No Q1-1 To whom answered “Yes” in Q1, Q1-2 To whom answered “No” iQ1, if the fee is 400 Kyats, would if the fee is cheaper 100 Kyats, would you be willing to pay the fee? you be willing to pay the fee? 2.Methodology
  • 15.
    15 Table 3.Selected Socio-economicCharacteristics of Ngaputaw Township, Study Area and Sample (2006) Source: Township Peace and Development Council Office and Survey Township Study Area Sample Population 225,058 4,904 2,329 Family Size 5.1 4.68 4.96 Number of Households 54,060 1,046 468 Average monthly income 30,000 (Kyats) (31.58 US$) 27,500(Kyats) (28.94 US$) 25,000(Kyats) (26.32 US$) Number of under 12 years children 19% 27% 27% Women 44% 45% 44% Literacy rate 100 100 100 Empirical Study 2.Methodology
  • 16.
    16 Estimation of WTP Thebasic regression equation is: Pr(x): Probability for choosing improved water services errorINCCHILUAGEQUANBIDx ++++++= 543210 10)Pr( αααααα 3.Results BID = Hypothetical amounts of monthly fees for proposed project (log form) QUAN = Water quantity drunk per day (dummy) AGE = Age in years U10 CHIL = Number of under 10 years children INC = Income
  • 17.
    17 ***P<0.01 Table 4. TheEstimated Results of the Double Bounded Logit Model 3.Results ***P<0.01 Variable Coefficient Std. Error CONS 8.02 *** 0.88 Log of bid -1.62 *** 0.10 Log of income 0.16 *** 0.05 Water Consumption 0.21 0.14 Age 0.44 0.43 Number of U10 child dummy -0.22 0.14 n 313 χ2 598.16 Median WTP 450 Mean WTP 610
  • 18.
    18 The Estimated WTP (monthlyper household) -Median WTP : 450 kyats (0.47 U.S. Dollars) - % of the mean household income: 1.84% 3.Results
  • 19.
    19 -The estimated benefit(running cost only) for the study area (4 villages) is 470,700 (kyats) = 495.47 (US$ ) per month or 5,648,400(kyats) = 5,945.68 (US$) per year - Estimated running cost would be 5276 US$ per year (source: Ueda Toyotaka, 2004) - Benefit-Cost ratio is 1.12 The Estimated Benefit & Cost (in money term) 3.Results
  • 20.
    20 - The estimatedWTP is consistent with existing studies (in terms of the share of income) - WTP results can show the respondents are favor to the proposed project, they are eager to contribute to the operation and maintenance cost for proposed project even though their incomes are low Conclusion 4.Conclusion
  • 21.
    21 Conclusion -The estimated WTPmay not be sufficient to all the costs necessary to establish and maintain safe drinking water -Initial cost should be supplied from external sources ( e.g ODA or other financial assistance) 4.Conclusion
  • 22.
    22 References Dutta,V.“Public Support forWater Supply Reforms in Unplanned Sector: Empirical Evidence from an Urban Water Utility”, GDN Medal Award Paper, 7th GDN Annual Conference, St. Petersburg, Russia, 2005. Freeman III A.M. “The Measurement of Environmental and Resource Values: Theories and Methods”. Resources for the Future, Washington DC, 2003. Nam Khanh Pham and Hung Son Vo Tran, “Households Demand for Improved Water Services in Ho Chi Minh City: A comparison of contingent valuation and choice modeling estimates”. Research report EEPSEA, 2003. Haab T. and McConnell K.E, “Valuing Environmental and Natural Resources: The econometrics of non-market valuation”, Edward Elgar, Cheltenham, UK, 2003. Memon M.A. and Matsuoka S. “Benefit Transfer Function to Estimate WTP for Rural Water Supply in Pakistan”, Journal of International Development Studies, Vol. 10, No.2, pp. 101-119, 2001. Whittington. Dale, “The Challenge of Demand Assessment in Pro-Poor Infrastructure projects” PPIAF/ADB Conference on Infrastructure Development – Private Solutions for the Poor: The Asian Perspective, 2002.