Download as PDF, PPTX

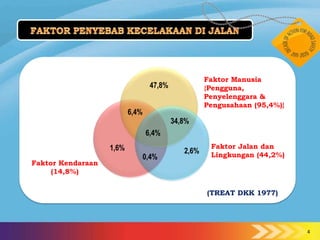
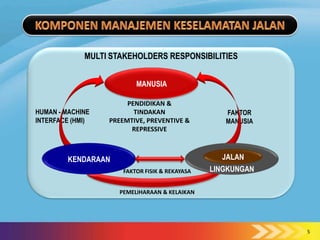
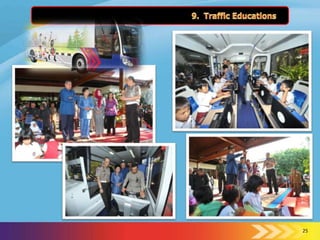

Faktor manusia merupakan penyebab utama kecelakaan lalu lintas dengan persentase 47,8%, diikuti faktor jalan dan lingkungan sebesar 34,8%, dan faktor kendaraan sebesar 14,8%. Semua pemangku kepentingan memiliki tanggung jawab untuk meningkatkan keselamatan lalu lintas melalui pendidikan, tindakan preventif dan represif, serta pemeliharaan infrastruktur dan kendaraan yang memenuhi standar keselamatan. Visi R


