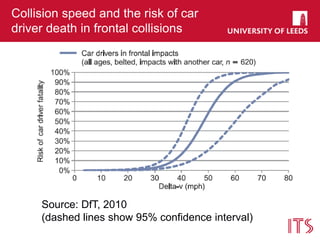
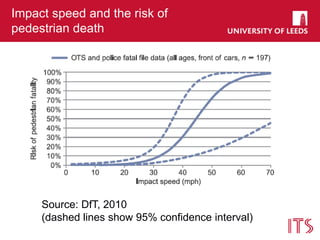
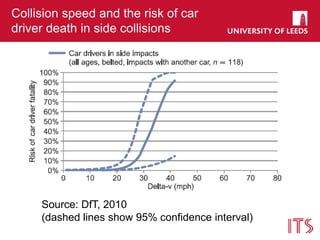
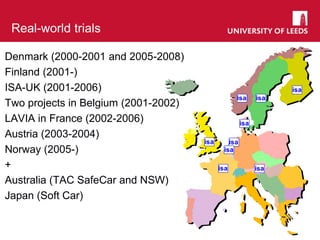
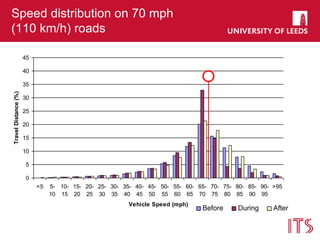
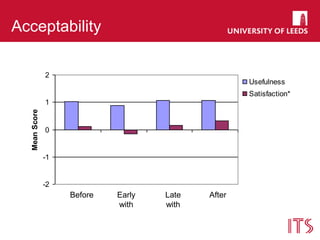
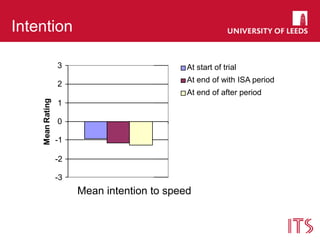
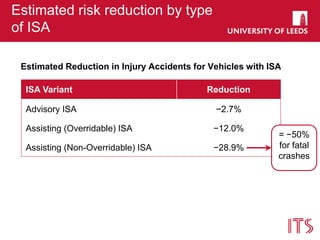
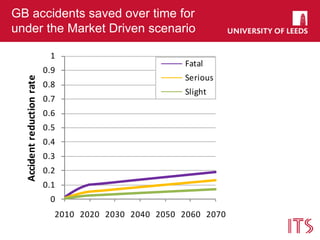
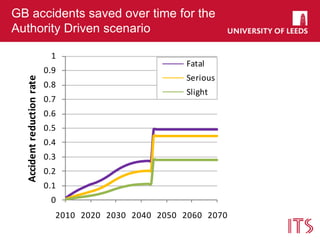
Institute for Transport Studies
ISA: The Research Evidence
Oliver Carsten
Institute for Transport Studies
University of Leeds
UK
Speed
“Speed remains a very important risk factor. It has a greater
effect on the number of accidents and injury severity than
almost all other known risk factors.”
Rune Elvik, The Power Model of the relationship between speed and road safety:
Update and new analyses (2009)
We know a lot about speed and
risk
Severity: the power model
Andersson and Nilsson,1997;
Nilsson, 2004; Elvik et al., 2004;
Elvik, 2009:
– Injury accidents go up
approximately with the
proportionate change in
speed squared for a length
of road
– Serious injury accidents
with speed cubed
– Fatal accidents with speed
to the fourth power
Source: Nilsson, 2004
Collision speed and the risk of car
driver death in frontal collisions
Source: DfT, 2010
(dashed lines show 95% confidence interval)
Impact speed and the risk of
pedestrian death
Source: DfT, 2010
(dashed lines show 95% confidence interval)
Collision speed and the risk of car
driver death in side collisions
Source: DfT, 2010
(dashed lines show 95% confidence interval)
Real-world trials
isa
isa
isa
isa
isa
isa
isa isa
isa
Denmark (2000-2001 and 2005-2008)
Finland (2001-)
ISA-UK (2001-2006)
Two projects in Belgium (2001-2002)
LAVIA in France (2002-2006)
Austria (2003-2004)
Norway (2005-)
+
Australia (TAC SafeCar and NSW)
Japan (Soft Car)
Assisting ISA: effect on behaviour and attitudes
The ISA-UK trials
2 urban trials
(1 private motorists, 1
fleet)
2 rural trials
(1 private motorists, 1
fleet)
79 drivers with a mix of:
Younger / older
Male / female
Speeding intenders / non-intenders
An overridable assisting system
• System that limited
speed to the prevailing
limit (no acceleration
beyond limit)
• Drivers could override at
will
• Vibration on throttle
pedal to prevent over-
throttling
30 30
Speed distribution on 30 mph
(50 km/h) urban roads
0
5
10
15
20
25
30
35
40
45
<5 5-
10
10-
15
15-
20
20-
25
25-
30
30-
35
35-
40
40-
45
45-
50
50-
55
55-
60
60-
65
65-
70
70-
75
75-
80
80-
85
85-
90
90-
95
>95
Vehicle Speed (mph)
TravelDistance(%)
Phase 1 Phase 2 Phase 3
<5 5-
10
10-
15
15-
20
20-
25
25-
30
30-
35
35-
40
40-
45
45-
50
50-
55
55-
60
60-
65
65-
70
70-
75
75-
80
80-
85
85-
90
90-
95
>95
Vehicle Speed (mph)
Phase 1 Phase 2 Phase 3Before During After
Speed distribution on 70 mph
(110 km/h) roads
0
5
10
15
20
25
30
35
40
45
<5 5-
10
10-
15
15-
20
20-
25
25-
30
30-
35
35-
40
40-
45
45-
50
50-
55
55-
60
60-
65
65-
70
70-
75
75-
80
80-
85
85-
90
90-
95
>95
Vehicle Speed (mph)
TravelDistance(%)
Phase 1 Phase 2 Phase 3
<5 5-
10
10-
15
15-
20
20-
25
25-
30
30-
35
35-
40
40-
45
45-
50
50-
55
55-
60
60-
65
65-
70
70-
75
75-
80
80-
85
85-
90
90-
95
>95
Vehicle Speed (mph)
Phase 1 Phase 2 Phase 3Before During After
Acceptability
-2
-1
0
1
2
Time 1 Time 2 Time 3 Time 4
Time Point
MeanScore
Usefulness
Satisfaction*
Before AfterEarly
with
Late
with
Intention
-3
-2
-1
0
1
2
3
speeding**
Scenario
MeanRating
-3
-2
-1
0
1
2
3
speeding** disengage
Scenario
MeanRating
Time 1
Time 2
Time 3
-3
-2
-1
0
1
2
3
speeding**
Scenario
MeanRating
-3
-2
-1
0
1
2
3
MeanRating
speeding**
Scenario
Time 1
Time 2
Time 3
disengage
Time 1
Time 2
Time 3
speeding**
Scenario
At start of trial
At end of Phase 2
At end of Phase 3
Mean intention to speed
At start of trial
At end of with ISA period
At end of after period
Impact Prediction
Method for estimating accident
reductions with ISA
• Based on models from the literature relating speed
to crash risk (e.g. Kloeden et al., 2001, 2002)
• These models have been calculated from real-world
data
• They are not drawn from the police reported
contributory factors for accidents
Estimated risk reduction by type
of ISA
Estimated Reduction in Injury Accidents for Vehicles with ISA
ISA Variant Reduction
Advisory ISA −2.7%
Assisting (Overridable) ISA −12.0%
Assisting (Non-Overridable) ISA −28.9%
= −50%
for fatal
crashes
What is the importance of regulation?
GB accidents saved over time for
under the Market Driven scenario
0
0.1
0.2
0.3
0.4
0.5
0.6
0.7
0.8
0.9
1
2010 2020 2030 2040 2050 2060 2070
Accidentreductionrate
Fatal
Serious
Slight
GB accidents saved over time for the
Authority Driven scenario
0
0.1
0.2
0.3
0.4
0.5
0.6
0.7
0.8
0.9
1
2010 2020 2030 2040 2050 2060 2070
Accidentreductionrate
Fatal
Serious
Slight
Comparison of predicted outcomes
• Benefit to cost ratios (accidents + fuel + CO2):
– Market Driven scenario 3.4
– Authority Driven scenario 7.4
Slight Crashes Serious Crashes Fatal Crashes
Market Driven 4% 8% 13%
Authority Driven 15% 25% 30%
GB Crashes Saved from, 2010 to 2070
Interpretation of scenario analysis
• Both scenarios are winners
• The harder the push for ISA and the “stronger” the system,
the greater the benefits
• Shows the importance of regulation
• Much of the potential of ISA, e.g. to replace traditional and
costly traffic calming, was not counted
Confirmation from Norway
Vaa et al. (2014) examined the safety potential for Norway of
a number of driver assistance systems, including Adaptive
Cruise Control, alcolocks, seatbelt reminders, Electronic
Stability Control and fatigue warning.
Their conclusion was:
“The most effective driver support system is ISA.”
Conclusions
• ISA is a well-proven technology with very significant safety
benefits
• Regulation is necessary to maximise the impact of ISA on
European traffic injuries and deaths
• It is therefore logical to:
1. Adopt legislation for fitting of all new commercial vehicles with
assisting ISA systems in line with the recommendations of the
evaluation study conducted on behalf of the European Commission
2. Adopt European legislation for fitting of all new passenger cars with
an overridable assisting ISA system
Thank you for your attention!
o.m.j.carsten@its.leeds.ac.uk

ISA: The Research Evidence

  • 1.
    Institute for TransportStudies ISA: The Research Evidence Oliver Carsten Institute for Transport Studies University of Leeds UK
  • 2.
    Speed “Speed remains avery important risk factor. It has a greater effect on the number of accidents and injury severity than almost all other known risk factors.” Rune Elvik, The Power Model of the relationship between speed and road safety: Update and new analyses (2009)
  • 3.
    We know alot about speed and risk
  • 4.
    Severity: the powermodel Andersson and Nilsson,1997; Nilsson, 2004; Elvik et al., 2004; Elvik, 2009: – Injury accidents go up approximately with the proportionate change in speed squared for a length of road – Serious injury accidents with speed cubed – Fatal accidents with speed to the fourth power Source: Nilsson, 2004
  • 5.
    Collision speed andthe risk of car driver death in frontal collisions Source: DfT, 2010 (dashed lines show 95% confidence interval)
  • 6.
    Impact speed andthe risk of pedestrian death Source: DfT, 2010 (dashed lines show 95% confidence interval)
  • 7.
    Collision speed andthe risk of car driver death in side collisions Source: DfT, 2010 (dashed lines show 95% confidence interval)
  • 8.
    Real-world trials isa isa isa isa isa isa isa isa isa Denmark(2000-2001 and 2005-2008) Finland (2001-) ISA-UK (2001-2006) Two projects in Belgium (2001-2002) LAVIA in France (2002-2006) Austria (2003-2004) Norway (2005-) + Australia (TAC SafeCar and NSW) Japan (Soft Car)
  • 9.
    Assisting ISA: effecton behaviour and attitudes
  • 10.
    The ISA-UK trials 2urban trials (1 private motorists, 1 fleet) 2 rural trials (1 private motorists, 1 fleet) 79 drivers with a mix of: Younger / older Male / female Speeding intenders / non-intenders
  • 11.
    An overridable assistingsystem • System that limited speed to the prevailing limit (no acceleration beyond limit) • Drivers could override at will • Vibration on throttle pedal to prevent over- throttling 30 30
  • 12.
    Speed distribution on30 mph (50 km/h) urban roads 0 5 10 15 20 25 30 35 40 45 <5 5- 10 10- 15 15- 20 20- 25 25- 30 30- 35 35- 40 40- 45 45- 50 50- 55 55- 60 60- 65 65- 70 70- 75 75- 80 80- 85 85- 90 90- 95 >95 Vehicle Speed (mph) TravelDistance(%) Phase 1 Phase 2 Phase 3 <5 5- 10 10- 15 15- 20 20- 25 25- 30 30- 35 35- 40 40- 45 45- 50 50- 55 55- 60 60- 65 65- 70 70- 75 75- 80 80- 85 85- 90 90- 95 >95 Vehicle Speed (mph) Phase 1 Phase 2 Phase 3Before During After
  • 13.
    Speed distribution on70 mph (110 km/h) roads 0 5 10 15 20 25 30 35 40 45 <5 5- 10 10- 15 15- 20 20- 25 25- 30 30- 35 35- 40 40- 45 45- 50 50- 55 55- 60 60- 65 65- 70 70- 75 75- 80 80- 85 85- 90 90- 95 >95 Vehicle Speed (mph) TravelDistance(%) Phase 1 Phase 2 Phase 3 <5 5- 10 10- 15 15- 20 20- 25 25- 30 30- 35 35- 40 40- 45 45- 50 50- 55 55- 60 60- 65 65- 70 70- 75 75- 80 80- 85 85- 90 90- 95 >95 Vehicle Speed (mph) Phase 1 Phase 2 Phase 3Before During After
  • 14.
    Acceptability -2 -1 0 1 2 Time 1 Time2 Time 3 Time 4 Time Point MeanScore Usefulness Satisfaction* Before AfterEarly with Late with
  • 15.
    Intention -3 -2 -1 0 1 2 3 speeding** Scenario MeanRating -3 -2 -1 0 1 2 3 speeding** disengage Scenario MeanRating Time 1 Time2 Time 3 -3 -2 -1 0 1 2 3 speeding** Scenario MeanRating -3 -2 -1 0 1 2 3 MeanRating speeding** Scenario Time 1 Time 2 Time 3 disengage Time 1 Time 2 Time 3 speeding** Scenario At start of trial At end of Phase 2 At end of Phase 3 Mean intention to speed At start of trial At end of with ISA period At end of after period
  • 16.
  • 17.
    Method for estimatingaccident reductions with ISA • Based on models from the literature relating speed to crash risk (e.g. Kloeden et al., 2001, 2002) • These models have been calculated from real-world data • They are not drawn from the police reported contributory factors for accidents
  • 18.
    Estimated risk reductionby type of ISA Estimated Reduction in Injury Accidents for Vehicles with ISA ISA Variant Reduction Advisory ISA −2.7% Assisting (Overridable) ISA −12.0% Assisting (Non-Overridable) ISA −28.9% = −50% for fatal crashes
  • 19.
    What is theimportance of regulation?
  • 20.
    GB accidents savedover time for under the Market Driven scenario 0 0.1 0.2 0.3 0.4 0.5 0.6 0.7 0.8 0.9 1 2010 2020 2030 2040 2050 2060 2070 Accidentreductionrate Fatal Serious Slight
  • 21.
    GB accidents savedover time for the Authority Driven scenario 0 0.1 0.2 0.3 0.4 0.5 0.6 0.7 0.8 0.9 1 2010 2020 2030 2040 2050 2060 2070 Accidentreductionrate Fatal Serious Slight
  • 22.
    Comparison of predictedoutcomes • Benefit to cost ratios (accidents + fuel + CO2): – Market Driven scenario 3.4 – Authority Driven scenario 7.4 Slight Crashes Serious Crashes Fatal Crashes Market Driven 4% 8% 13% Authority Driven 15% 25% 30% GB Crashes Saved from, 2010 to 2070
  • 23.
    Interpretation of scenarioanalysis • Both scenarios are winners • The harder the push for ISA and the “stronger” the system, the greater the benefits • Shows the importance of regulation • Much of the potential of ISA, e.g. to replace traditional and costly traffic calming, was not counted
  • 24.
    Confirmation from Norway Vaaet al. (2014) examined the safety potential for Norway of a number of driver assistance systems, including Adaptive Cruise Control, alcolocks, seatbelt reminders, Electronic Stability Control and fatigue warning. Their conclusion was: “The most effective driver support system is ISA.”
  • 25.
    Conclusions • ISA isa well-proven technology with very significant safety benefits • Regulation is necessary to maximise the impact of ISA on European traffic injuries and deaths • It is therefore logical to: 1. Adopt legislation for fitting of all new commercial vehicles with assisting ISA systems in line with the recommendations of the evaluation study conducted on behalf of the European Commission 2. Adopt European legislation for fitting of all new passenger cars with an overridable assisting ISA system
  • 26.
    Thank you foryour attention! o.m.j.carsten@its.leeds.ac.uk