Download as PDF, PPTX

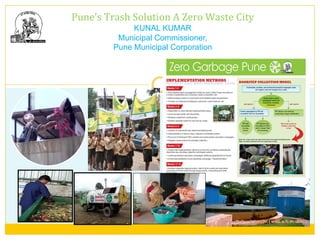
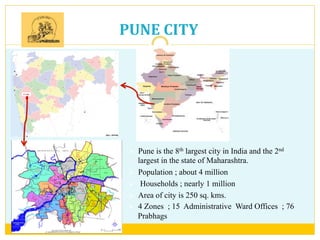
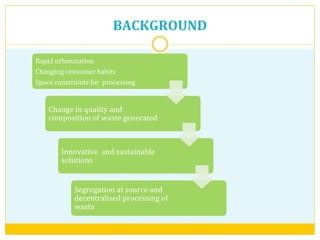
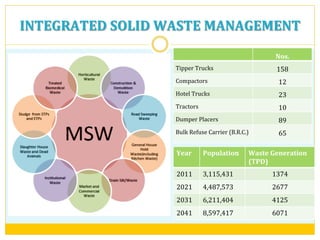
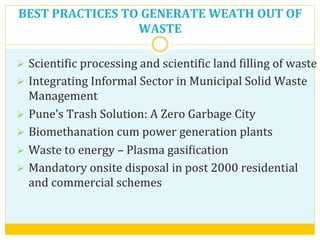
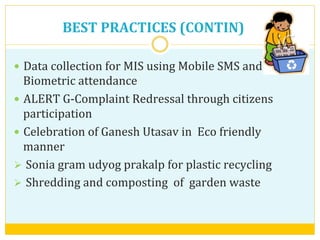
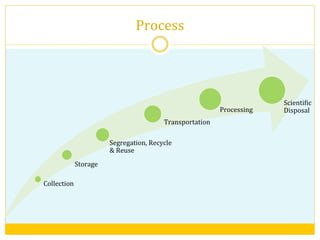
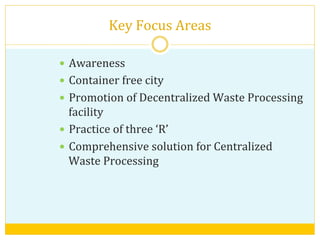
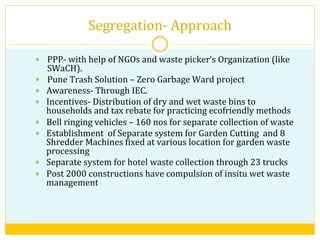
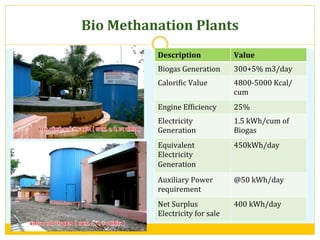
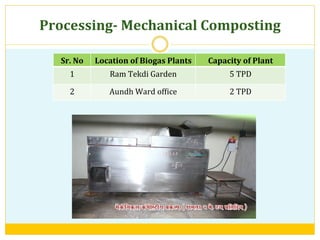
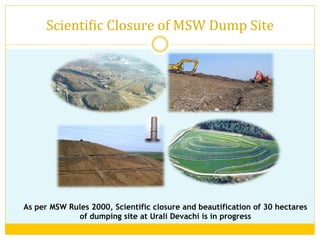
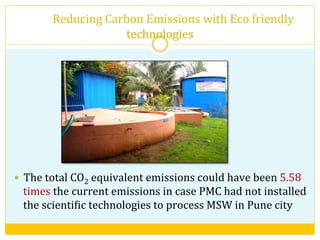
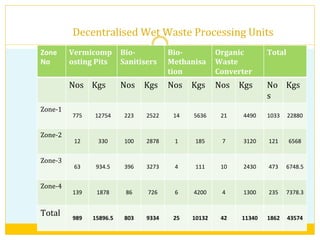
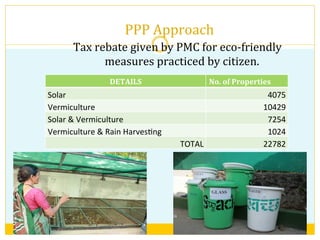


This document summarizes Kunal Kumar's presentation on Pune's approach to zero waste management. Some key points: - Pune generates around 1600 tons of solid waste per day and collects waste door-to-door using 160 trucks. - Their integrated waste management approach focuses on segregation at source, decentralized processing, and scientific disposal. - Best practices include integrating the informal sector, biomethanation plants, mandatory on-site disposal for new developments, and an app for citizen complaints. - The goal is to become a zero garbage city through increasing awareness, promoting recycling and composting, and developing comprehensive centralized processing.


